


1. Introduction
Marine macroalgae have attracted increasing attention as sustainable sources of food ingredients and bioactive compounds owing to their nutritional value and diverse functional properties (Holdt and Kraan, 2011; Reboleira et al., 2021). Among edible brown seaweeds, Laminaria japonica is an economically important species that has long been cultivated and consumed as food in East Asia. Brown seaweeds are rich sources of structurally diverse bioactive constituents, including phlorotannins and sulfated polysaccharides, such as fucoidan, laminarin, alginate, iodine, and minerals, which have been associated with a broad range of biological activities (Holdt and Kraan, 2011). Phlorotannins, polymers of phloroglucinol, characteristic of brown algae, have attracted particular interest because of their antioxidant and anti-inflammatory properties and capacity to modulate cellular signaling pathways associated with oxidative stress and inflammation (Li et al., 2011; Thomas and Kim, 2011). Fucoidans, a class of sulfated fucose-rich polysaccharides found predominantly in brown algae, have also been extensively investigated for their immunomodulatory and anti-inflammatory properties (Fitton et al., 2015). These bioactive constituents contribute to the potential of L. japonica as a promising marine resource for developing functional food ingredients.
Despite their functional potential, the recovery and utilization of bioactive compounds from brown seaweeds are limited by their structurally complex cell walls. Brown algal cell walls contain abundant polysaccharides that hinder the release and extraction of intracellular and matrix-associated metabolites, providing a rationale for the use of cell wall-degrading enzymes to improve the recovery of valuable seaweed constituents (Wijesinghe and Jeon, 2012a). In addition, phlorotannins occur not only as soluble intracellular compounds, but also as cell wall-associated fractions, indicating that a portion of these phenolic compounds may be less readily extractable (Koivikko et al., 2005). Therefore, bioprocessing strategies that modify the seaweed matrix and increase the accessibility of bioactive constituents may enhance the functional value of L. japonica.
Fermentation has emerged as a promising bioprocessing approach to improve the nutritional and functional properties of algae- and seaweed-derived materials (Reboleira et al., 2021; Sarıtaş et al., 2024). Microbial fermentation can alter the physicochemical characteristics of algal substrates and promote the biotransformation or increased accessibility of bioactive compounds, thereby contributing to enhanced antioxidant, anti-inflammatory, and other functional properties (Sarıtaş et al., 2024). Among food-grade microorganisms, lactic acid bacteria (LAB) are particularly attractive starter cultures because their metabolic and enzymatic activities can modify plant-derived substrates during fermentation. LAB possess diverse metabolic pathways that are involved in the transformation of carbohydrates and phenolic compounds, and their enzymatic activity contributes to the conversion of complex food constituents into more accessible or biologically active forms (Filannino et al., 2018). In particular, β-glucosidase activity can hydrolyze β-glycosidic linkages in glycosylated compounds and thereby contribute to phenolic biotransformation in plant-based substrates (Filannino et al., 2018). LAB proteolytic systems can also release encrypted bioactive peptides from food proteins, including those with antioxidant and other biological activities (Pessione and Cirrincione, 2016). Collectively, these metabolic and enzymatic properties provide a mechanistic basis for the application of LAB fermentation in complex biological matrices.
The functional effects of fermentation have also been demonstrated in brown seaweeds. Fermentation of Ecklonia cava processing by-products has been associated with enhanced antioxidant properties and the production of phlorotannin-rich extracts exhibiting anti-inflammatory activity in lipopolysaccharide (LPS)-stimulated RAW 264.7 macrophages (Sarıtaş et al., 2024; Wijesinghe et al., 2013). In L. japonica, fermentation with Bacillus subtilis has been reported to enhance anti-inflammatory activity and suppress inflammatory mediators in LPS-stimulated macrophages, suggesting that microbial bioprocessing can alter the biological functionality of this seaweed (Lin et al., 2016). However, the effects of LAB fermentation on the relationships between hydrolytic enzyme activities, bioactive compound recovery, and the antioxidant and anti-inflammatory properties of L. japonica remain insufficiently characterized.
Enzyme-assisted processing may further improve the accessibility of seaweed constituents prior to microbial fermentation. Enzyme-assisted extraction using carbohydrases has been widely investigated as an environmentally friendly strategy for disrupting seaweed cell-wall polysaccharides and facilitating the recovery of bioactive metabolites (Wijesinghe and Jeon, 2012a). Viscozyme L, a commercial multi-enzyme carbohydrase preparation, can therefore be used as a pretreatment to modify the polysaccharide-rich seaweed matrix and increase substrate accessibility for subsequent microbial bioconversion. From this perspective, coupling carbohydrase pretreatment with LAB fermentation may provide a sequential bioprocessing strategy in which the initial enzymatic modification of the seaweed matrix facilitates subsequent strain-dependent metabolic and enzymatic transformations.
Traditional fermented foods contain complex microbial ecosystems and represent valuable sources of LAB with potentially useful technological and functional traits. In our previous screening study, three LAB strains isolated from onion jangajji, a Korean fermented onion product (Weissella confusa FO-L5, Leuconostoc citreum FO-L9, and Pediococcus acidilactici FO-L10), were selected as starter candidates based on their probiotic potential and hydrolytic enzyme activity (manuscript under review). These strains exhibited distinct metabolic and enzymatic characteristics, suggesting that their functional performance during L. japonica fermentation may differ depending on the strain-specific substrate utilization and bioconversion capacity. Moreover, mixed-culture fermentation may generate outcomes that differ from those obtained using individual starter cultures.
Mixed-culture fermentation has received increasing attention because interactions between microorganisms can influence substrate utilization, metabolite production, and overall fermentation performance (Smid and Lacroix, 2013). The functionality of mixed starter cultures is determined by complex physiological and metabolic interactions among the constituent microorganisms, and appropriately selected microbial combinations may improve fermentation performance or generate product characteristics that are not achieved by individual strains (Smid and Lacroix, 2013).
In the present study, a combination of heterofermentative W. confusa FO-L5 and homofermentative P. acidilactici FO-L10 was selected to compare the fermentation characteristics of this mixed culture with those of individual strains. These differences in strain characteristics may influence the fermentation performance of structurally complex seaweed substrates; however, strain-specific interactions have not been directly evaluated. Comparative information on single-strain and mixed-culture LAB fermentation of L. japonica remains limited, and the relationships between fermentation-associated enzyme activities, changes in bioactive constituents, and biological activities have not been clearly elucidated.
Therefore, the present study aimed to determine whether fermentation of L. japonica with LAB isolated from the traditional Korean onion jangajji enhances its antioxidant and anti-inflammatory properties and to elucidate the relationships among fermentation-associated enzyme activities, bioactive compound recovery, and functional activities. Three single-strain fermentations were performed using W. confusa FO-L5, Leu. citreum FO-L9, P. acidilactici FO-L10, and binary mixed-culture fermentation using FO-L5 and FO-L10 (FO-MIX) were compared with an untreated control and a Viscozyme L-treated control. This experimental design enabled the effects of enzymatic pretreatment to be distinguished from those of LAB fermentation and allowed evaluation of whether mixed-culture fermentation provides functional advantages over individual starter cultures. The overall experimental design and relationships among these variables are summarized in Supplementary Fig. S1.
2. Materials and methods
Dried L. japonica was obtained as a commercially cut, dried kelp product (Wando Myeongga Dashima, Bada Myeongga Co., Wando, Korea). Seaweed was processed as described below. Three LAB strains (W. confusa FO-L5, Leu. citreum FO-L9, and P. acidilactici FO-L10) previously isolated from traditional Korean fermented onion (jangajji) and maintained in our laboratory culture collection were used as starter cultures. ViscozymeⓇ L (Novozymes A/S, Bagsværd, Denmark), a commercial multienzyme carbohydrase preparation, was used for enzymatic pretreatment of the seaweed substrate.
Stock cultures were maintained in de Man, Rogosa and Sharpe (MRS) broth (Difco, Detroit, MI, USA) supplemented with 20% (v/v) glycerol at −80°C. Before fermentation, each strain was revived and subcultured twice in fresh MRS broth at 37°C for 18 h under static anaerobic conditions using an Anoxomat Mark II anaerobic culture system (Mart Microbiology B. V., Drachten, Netherlands) to obtain metabolically active cultures. The optical density at 600 nm (OD600) was monitored to identify the late exponential growth phase. Cultures were harvested by centrifugation at 8,000 ×g for 10 min at 4°C, washed twice with sterile phosphate-buffered saline (PBS; pH 7.2), and resuspended in PBS. The cell density was adjusted to approximately 1 × 10⁸ CFU/mL based on OD600 and confirmed by viable plate counting on MRS agar after anaerobic incubation at 37°C for 48 h. Equal volumes of the FO-L5 and FO-L10 cell suspensions were mixed at a 1:1 (v/v) ratio to prepare the FO-MIX inoculum.
Dried L. japonica was thoroughly washed with distilled water to remove surface impurities, dried at 40°C for 24 h, milled using a laboratory grinder (KTM30 basic, Korea Process Technology Co., Ltd., Seoul, Korea), passed through a 500-μm sieve (BS0500-75, LK Lab Korea, Namyangju, Korea), and stored at 4°C until use. The powder was suspended in sterile distilled water at 10% (w/v), and the pH was adjusted to 5.0 using 0.1 M citrate buffer. ViscozymeⓇ L was added at 0.5% (v/w, based on the dry weight of L. japonica), and enzymatic hydrolysis was performed at 50°C for 2 h with continuous orbital shaking at 150 rpm. Following enzymatic hydrolysis, the enzyme was thermally inactivated at 90°C for 10 min, and the hydrolysate was cooled to 37°C before LAB inoculation.
Six experimental groups were established: (i) Control, untreated L. japonica without Viscozyme L pretreatment or LAB inoculation; (ii) Visco, Viscozyme L-pretreated substrate without LAB inoculation; (iii) FO-L5, Viscozyme L-pretreated substrate inoculated with W. confusa FO-L5; and (iv) FO-L9, Viscozyme L-pretreated substrate inoculated with Leu. citreum FO-L9; (v) FO-L10, Viscozyme L-pretreated substrate inoculated with P. acidilactici FO-L10; and (vi) FO-MIX, Viscozyme L-pretreated substrate inoculated with an equal-volume mixture (1:1, v/v) of FO-L5 and FO-L10. FO-L5 and FO-L10 were selected for the mixed culture to represent contrasting fermentation characteristics, with W. confusa being heterofermentative and P. acidilactici being predominantly homofermentative. FO-L9 was retained as a single-strain comparator. Thus, the present study evaluated only the specific FO-L5/FO-L10 combination and was not designed to determine whether this not imply that it is superior to other possible strain combinations.
Starter cultures were aseptically added to the inoculated groups at 10% (v/v) to obtain a total initial cell density of approximately 1 × 10 colony forming units/mL. For FO-MIX, an equal-volume mixture of FO-L5 and FO-L10 contained approximately 5 × 10 CFU/mL of each strain in the final fermentation mixture. Fermentation was conducted in 500-mL borosilicate Erlenmeyer flasks containing 100 mL of substrate, sealed with silicone stoppers, and incubated at 37°C under static oxygen-limited conditions for 72 h. The Control and Visco groups were subjected to the same incubation time, temperature, and handling conditions, without LAB inoculation. Because no direct gas-flushing or strain-resolved oxygen measurement was performed, the conditions are described here as oxygen-limited rather than strictly anaerobic. After fermentation, samples were collected for physicochemical and biochemical analyses. The remaining fermented samples were freeze-dried (FD8508, ilShinBioBase Co., Ltd., Dongducheon, Korea) and stored at −20°C until further analysis.
The pH of each fermentation sample was measured using a digital pH meter (Fisher Scientific Inc., Waltham, MA, USA). Titratable acidity (TA) was determined by titrating 10 mL of fermentation broth with standardized 0.1 N NaOH to an endpoint of pH 8.3 and expressed as percentage lactic acid (% w/v). The TA was calculated as follows: TA (%) = [V × N × 0.09008 × 100] / sample volume (mL), where V is the volume of NaOH used for titration (mL), N is the normality of the NaOH solution, and 0.09008 is the lactic acid equivalent corresponding to 1 mL of 1 N NaOH.
Viable LAB counts were determined by serial dilution and plating on MRS agar supplemented with 0.2% CaCO3. Plates were incubated anaerobically at 37°C for 48 h, and viable counts were expressed as log CFU/g.
Reducing sugar content was determined using the 3,5-dinitrosalicylic acid (DNS) method described by Miller (1959). Briefly, 0.5 mL of sample was mixed with an equal volume of DNS reagent, heated at 100°C for 5 min, and cooled to room temperature. The absorbance was measured at 540 nm. The reducing sugar concentrations were calculated using a glucose standard curve and expressed as milligrams of glucose equivalents (GE)/mL.
Lactic and acetic acid concentrations were determined by high-performance liquid chromatography (HPLC; Shimadzu Corporation, Kyoto, Japan) equipped with an Aminex HPX-87H ion-exclusion column (300 × 7.8 mm; Bio-Rad Laboratories, Hercules, CA, USA). Fermentation samples were centrifuged at 10,000 ×g for 15 min at 4°C, and the supernatants were filtered through 0.22-μm membrane filters. A 20-μL aliquot of each filtrate was injected into the HPLC system. Separation was performed using 5 mM H2SO4 as the mobile phase at a flow rate of 0.5 mL/min and a column temperature of 60°C. Organic acids were detected at 220 nm and quantified using calibration curves prepared with authentic lactic and acetic acid standards (≥ 99% purity; Sigma-Aldrich). The total chromatographic run time was 30 min. Chromatographic analysis was performed using the ion-exclusion HPLC method described by Bevilacqua and Califano (1989).
Fermented and unfermented L. japonica samples (10 g dry weight) were extracted to determine total polyphenol content (TPC), phlorotannin content, and antioxidant activities. Each sample was homogenized with 100 mL of 80% (v/v) aqueous methanol using a high-speed homogenizer (Ultra-Turrax T25; IKA, Staufen, Germany) at 10,000 rpm for 3 min and extracted with continuous stirring at room temperature for 24 h in the dark. The homogenate was filtered through Whatman No. 1 filter paper, and the filtrate was concentrated under reduced pressure at 40°C using a rotary evaporator (Büchi R-210, Büchi Labortechnik AG, Flawil, Switzerland). The concentrated extract was reconstituted in distilled water to a final concentration of 10 mg/mL on a dry-extract-weight basis and stored at −20°C until analysis.
For the preparation of acid-extractable polysaccharide fractions, fermented and unfermented L. japonica samples (5 g, dry weight) were extracted with 100 mL of 0.1 M HCl at 80°C for 2 h with continuous stirring. After extraction, the suspension was cooled and neutralized to pH 7.0 with 1 M NaOH. The extract was dialyzed against distilled water using regenerated cellulose dialysis tubing with a molecular weight cutoff of 12-14 kDa at 4°C for 48 h, with dialysis water replaced every 24 h. The dialyzed fraction was freeze-dried and stored at −20°C until further analysis.
TPC was determined using the Folin-Ciocalteu colorimetric method, according to Singleton et al. (1999). The 80% methanolic extract (100 μL) was mixed with 500 μL of Folin-Ciocalteu reagent diluted 1:10 (v/v) and allowed to react for 5 min. Subsequently, 400 μL of 7.5% (w/v) Na2CO3 was added. The mixture was incubated in the dark at room temperature for 30 min, and the absorbance was measured at 760 nm using a microplate reader (BioTek Instruments, Inc., Winooski, VT, USA). TPC was calculated using a gallic acid standard curve (0-200 μg/mL, R2 ≥ 0.999) and expressed as mg gallic acid equivalents per gram dry weight (mg GAE/g DW).
Phlorotannin content was determined using a Folin-Ciocalteu-based colorimetric assay with phloroglucinol as the calibration standard, with reference to the analytical approach used for brown algal phenolic compounds by Audibert et al. (2010). Briefly, 0.5 mL of the 80% methanolic extract was mixed with 3 mL of Folin-Ciocalteu reagent diluted 1:10 (v/v) and 0.4 mL of 7.5% (w/v) Na2CO3. The mixture was incubated at 45°C for 30 min, and the absorbance was measured at 755 nm. Phlorotannin content was calculated using a phloroglucinol standard curve (0-200 μg/mL, R2 ≥ 0.999) and expressed as mg phloroglucinol equivalents per gram dry weight (mg PGE/g DW).
The carbohydrate content of the acid-extractable polysaccharide fraction was determined using the phenol-sulfuric acid method described by DuBois et al. (1956), with L-fucose as the calibration standard. Briefly, 1 mL of appropriately diluted extract was mixed with 0.5 mL of 5% (w/v) phenol and 2.5 mL of concentrated H2SO4. The mixture was incubated at room temperature for 20 min, and the absorbance was measured at 490 nm. The carbohydrate content was calculated using an L-fucose standard curve (0-100 μg/mL, R2 ≥ 0.999) and expressed as mg L-fucose equivalents per gram dry weight (mg L-FucE/g DW). Because the phenol-sulfuric acid assay is not specific to purified fucoidan, the resulting values were designated as acid-extractable fucose-containing polysaccharides (AE-FCP) and interpreted as L-fucose-equivalent estimates rather than absolute fucoidan concentrations.
The DPPH radical scavenging activity was determined according to the method described by Brand-Williams et al. (1995) with minor modifications. The 80% methanolic extract (100 μL) was mixed with 900 μL of 0.1 mM DPPH solution prepared in 95% ethanol and incubated in the dark at room temperature for 30 min. Absorbance was measured at 517 nm using a microplate reader. DPPH radical scavenging activity was calculated as follows: DPPH radical scavenging activity (%) = [(A0 - A1) / A0] × 100, where A0 is the absorbance of the DPPH solution without sample and A1 is the absorbance in the presence of the sample. The assay was performed at an extract concentration of 200 μg/mL, and Trolox was used as the positive control.
ABTS radical cation (ABTS•+) scavenging activity was determined according to Re et al. (1999). The ABTS•+ solution was generated by reacting 7 mM ABTS with 2.45 mM potassium persulfate in the dark at room temperature for 12-16 h. Before analysis, the solution was diluted with 95% ethanol to an absorbance of 0.70 ± 0.02 at 734 nm. Methanolic extract (80%; 100 μL) was mixed with 900 μL of the ABTS•+ working solution and incubated at room temperature for 10 min. The absorbance was measured at 734 nm. ABTS radical scavenging activity was calculated as follows: ABTS radical scavenging activity (%) = [(A0 - A1) / A0] × 100, where A0 is the absorbance of the ABTS•+ solution without sample and A1 is the absorbance in the presence of the sample. Trolox was used as a positive control.
The ferric reducing antioxidant power (FRAP) was determined as described by Benzie and Strain (1996). The FRAP reagent was freshly prepared by mixing 300 mM acetate buffer (pH 3.6), 10 mM 2,4,6-tripyridyl-s-triazine (TPTZ) prepared in 40 mM HCl, and 20 mM FeCl3·6H2O at a ratio of 10:1:1 (v/v/v). The reagent was equilibrated at 37°C before analysis. The 80% methanolic extract (100 μL) was mixed with 900 μL of prewarmed FRAP reagent and incubated at 37°C for 4 min. Absorbance was measured at 593 nm. FRAP values were calculated using a FeSO4·7H2O standard curve (0-1.0 mM, R2 ≥ 0.999) and expressed as mM Fe2+ equivalents (mM Fe2+ eq.).
The enzyme samples were prepared as cell-free fermentation supernatants. Briefly, fermentation samples were centrifuged at 10,000 ×g for 10 min at 4°C to remove bacterial cells and insoluble materials, and the resulting supernatants were collected and used directly as crude enzyme preparations for the enzyme activity assays. β-Glucosidase activity was determined using p-nitrophenyl β-D-glucopyranoside (pNP-β-D-Glc) as the substrate, with minor modifications to a previously described method (Arnaldos et al., 1999). The enzyme sample (50 μL) was incubated with 450 μL of 2 mM pNP-β-D-Glc prepared in 50 mM citrate-phosphate buffer (pH 5.0) at 50°C for 30 min. The reaction was terminated by adding 500 μL of 0.2 M Na2CO3. The absorbance of the released p-nitrophenol was measured at 405 nm against a reagent blank prepared by adding a stop solution before substrate addition. The amount of released p-nitrophenol was determined using a p-nitrophenol standard curve (0-1.0 μmol/mL, R2 ≥ 0.999). β-Glucosidase activity was calculated as follows: β-Glucosidase activity (U/mL) = (μmol of p-nitrophenol released × dilution factor) / [reaction time (min) × enzyme volume (mL)]. One unit (U) of β-glucosidase activity was defined as the amount of enzyme releasing 1 μmol of p-nitrophenol per minute under the assay conditions.
Tannase activity was determined using tannic acid as the substrate and the rhodanine-based spectrophotometric method described by Sharma et al. (2000) with minor modifications. The enzyme sample (500 μL) was incubated with 500 μL of 0.5% (w/v) tannic acid prepared in 50 mM citrate-phosphate buffer (pH 5.0) at 37°C for 30 min. The reaction was terminated by adding 1 mL of 0.667% (w/v) rhodanine reagent prepared in 95% ethanol and 1 mL of 0.5 M KOH. After incubation at room temperature for 5 min, 8 mL of distilled water was added, and the absorbance was measured at 520 nm. Liberated gallic acid was quantified using a gallic acid standard curve (0-100 μg/mL, R2 ≥ 0.999). Tannase activity was calculated as follows: Tannase activity (U/mL) = (μmol of gallic acid released × dilution factor) / [reaction time (min) × enzyme volume (mL)]. One unit (U) of tannase activity was defined as the amount of enzyme releasing 1 μmol of gallic acid per minute under the assay conditions. Because tannic acid was used as the model substrate, the measured activity was interpreted as tannase activity toward a hydrolyzable tannin substrate and not as direct evidence of phlorotannin degradation.
Protease activity was determined using azocasein as the substrate, with modifications to a previously described method (Alves et al., 2016). The enzyme sample (200 μL) was incubated with 200 μL of 0.5% (w/v) azocasein prepared in 0.1 M Tris-HCl buffer (pH 7.5) at 37°C for 60 min. The reaction was terminated by adding 400 μL of 10% (w/v) trichloroacetic acid, followed by incubation on ice for 15 min. After centrifugation at 10,000 ×g for 10 min, the absorbance of the TCA-soluble supernatant was measured at 440 nm against a reagent blank prepared by adding TCA prior to substrate incubation. Protease activity was calculated as follows: Protease activity (U/mL) = (ΔA440/min × dilution factor) / 0.01. One unit (U) of protease activity was defined as the amount of enzyme producing an increase of 0.01 absorbance units at 440 nm/min under the assay conditions.
RAW 264.7 murine macrophage cells (ATCC TIB-71; American Type Culture Collection, Manassas, VA, USA) were cultured in DMEM supplemented with 10% heat-inactivated FBS and 1% penicillin-streptomycin (100 U/mL penicillin and 100 μg/mL streptomycin) at 37°C in a humidified atmosphere containing 5% CO2. The cells were subcultured every 2-3 days and used between passages 5 and 20. Before the anti-inflammatory assays, cell viability following extract treatment was evaluated using an MTT reduction assay. The 80% methanolic extracts described in Section 2.5 were used for the cell-based assays. These sample extracts were dissolved in sterile distilled water, filtered through a 0.22-μm membrane filter, and diluted with culture medium to the required concentrations. RAW 264.7 cells were seeded in 96-well plates at a density of 1 × 10⁴ cells/well and allowed to adhere overnight. Cells were subsequently treated with sample extracts at concentrations of 50, 100, 200, and 400 μg/mL for 24 h. MTT solution (5 mg/mL in PBS) was added at 10 μL/well, and the cells were incubated at 37°C for 4 h. The culture medium was then removed, and the resulting formazan crystals were dissolved in 100 μL of DMSO. Absorbance was measured at 570 nm. Cell viability was calculated as follows: Cell viability (%) = (absorbance of extract-treated cells/absorbance of untreated control cells) × 100. Based on the viability assessment, 200 μg/mL was selected for subsequent anti-inflammatory assays. Cell viability data at this concentration are presented in Supplementary Table S1.
RAW 264.7 cells were seeded in 24-well plates at a density of 5 × 10⁵ cells/well and allowed to adhere overnight. The cells were pretreated with sample extracts at 200 μg/mL for 1 h and subsequently stimulated with lipopolysaccharide (LPS; 1 μg/mL; Escherichia coli O111:B4) for 24 h at 37°C. Nitrite accumulation in culture supernatants, an indicator of NO production, was determined using the Griess reaction as described by Green et al. (1982). Briefly, 100 μL of culture supernatant was mixed with an equal volume of Griess reagent and incubated at room temperature according to the reagent protocol. Absorbance was measured at 540 nm using a microplate reader. Nitrite concentrations were calculated using a sodium nitrite (NaNO2) standard curve (0-100 μM). The inhibitory effect of the sample extracts on LPS-induced NO production was calculated relative to the LPS-stimulated control as follows: NO production inhibition (%) = [(CLPS - Csample) / CLPS] × 100, where CLPS is the nitrite concentration of the LPS-stimulated control and Csample is the nitrite concentration of the extract-treated, LPS-stimulated group.
The concentrations of IL-6 and TNF-α in culture supernatants collected 24 h after LPS stimulation were quantified using QuantikineⓇ sandwich ELISA kits (R&D Systems, Minneapolis, MN, USA) according to the manufacturer’s instructions. Briefly, appropriately diluted samples and standards were added to antibody-coated microplates and processed according to kit protocols. After sequential addition of the enzyme-linked detection reagents and substrate solution, the reactions were terminated with a stop solution. Absorbance was measured at 450 nm with wavelength correction at 570 nm using a microplate reader. Cytokine concentrations were calculated from four-parameter logistic standard curves and expressed as pg/mL.
TPC, phlorotannin content, and AE-FCP content of the acid-extractable polysaccharide fraction; β-glucosidase, tannase, and protease activities; DPPH and ABTS radical scavenging activities and FRAP; and NO inhibition, IL-6 production, and TNF-α production were subjected to Pearson correlation analysis. Pearson’s correlation coefficients (r) and the corresponding p-values were calculated using individual biological replicate values (n = 18; six treatment groups × three independent biological replicates) rather than treatment means. Pairwise correlations were evaluated among the 12 measured variables.
PCA was performed using the same replicate-level dataset (n = 18 observations) to explore the multivariate patterns among the measured variables. The data were standardized to zero mean and unit variance before PCA. PC1 and PC2 were plotted in the biplot for visualization of treatment distribution and variable loadings; however, only components meeting the Kaiser criterion (eigenvalue ≥ 1.0) were considered for biological interpretation.
All experiments were performed using three independent biological replicates (n = 3), and the results are expressed as the mean ± SD. Differences among treatments were evaluated using one-way analysis of variance (ANOVA), followed by Duncan’s multiple range test when a significant overall treatment effect was detected. Differences were considered statistically significant at p < 0.05. The assumptions of normality and homogeneity of variance were assessed using Shapiro-Wilk and Levene’s tests, respectively, before ANOVA. For the Pearson correlation analysis, statistical significance was evaluated at p < 0.05, p < 0.01, and p < 0.001. All statistical analyses were performed using IBM SPSS Statistics version 26.0 (IBM Corp., Armonk, NY, USA).
3. Results and discussion
The LAB-inoculated groups underwent a pronounced decline in pH over the 72-h fermentation period, whereas the Control and Visco groups exhibited only minor changes (Table 1). Among the inoculated treatments, FO-MIX showed the lowest final pH (4.28 ± 0.06), followed by FO-L5 (4.41 ± 0.03), FO-L10 (4.66 ± 0.09), and FO-L9 (4.80 ± 0.04) (p < 0.05). This pattern is consistent with the findings of Sørensen et al. (2021), who demonstrated that starter-culture inoculation promoted more consistent acidification of brown seaweeds than spontaneous fermentation. Collectively, the pronounced acidification observed in the present study supports the active LAB fermentation of the pretreated L. japonica substrate.
The TA values followed the order FO-MIX (1.03 ± 0.06%) > FO-L5 (0.92 ± 0.03%) > FO-L10 (0.85 ± 0.07%) > FO-L9 (0.78 ± 0.05%). pH and TA did not exhibit identical patterns across treatments, with the differences being particularly evident between FO-L5 and FO-L9. Despite producing less acetic acid, FO-L5 exhibited lower final pH and higher TA than FO-L9. This apparent divergence may reflect the differences in the relative contributions of individual organic acids to the overall acidification profile. Given its lower pKa, lactic acid generally contributes more strongly to hydrogen-ion concentration than acetic acid under comparable conditions (Degrain et al., 2020).
The organic acid profiles were broadly consistent with the established metabolic characteristics of the LAB strains. P. acidilactici FO-L10 predominantly produced lactic acid (5.50 ± 0.29 g/L), with only a minor accumulation of acetic acid (0.09 ± 0.04 g/L), consistent with its predominantly homofermentative metabolism. In contrast, W. confusa FO-L5 produced both lactic acid (5.82 ± 0.15 g/L) and acetic acid (1.32 ± 0.11 g/L), in line with the heterofermentative characteristics of Weissella species (Fusco et al., 2015). Leu. citreum FO-L9 also produced both acids, reaching 4.89 ± 0.46 g/L lactic acid and 2.02 ± 0.13 g/L acetic acid. Notably, FO-MIX yielded the highest concentrations of both lactic acid (6.14 ± 0.18 g/L) and acetic acid (2.41 ± 0.14 g/L), together with the lowest final pH and highest TA. This coordinated acid-production profile was accompanied by a more pronounced overall fermentation response in FO-MIX than in either single-strain treatment. Mixed LAB starter cultures comprising metabolically distinct strains may influence fermentation performance through complementary differences in substrate utilization and organic-acid production (Okoye et al., 2023; Smid and Lacroix, 2013). However, because strain-specific interactions have not been directly investigated, the superior fermentation profile of FO-MIX should be regarded as evidence of enhanced co-culture performance rather than definitive evidence of synergistic interactions.
Viable LAB counts increased markedly across all inoculated groups, rising from approximately 7.0 log CFU/g at inoculation to 8.48-9.23 log CFU/g after 72 h. FO-MIX reached the highest final viable count (9.23 ± 0.19 log CFU/g), representing an increase of approximately 2.25 log units. This pronounced proliferation is consistent with the substantial LAB growth previously reported during sugar-kelp fermentation (Bruhn et al., 2019). Brown seaweeds contain fermentable carbohydrates, including mannitol- and laminarin-derived oligosaccharides, which may provide suitable substrates for LAB growth (Allahgholi et al., 2023).
Reducing sugar concentrations declined markedly in the LAB-fermented groups, with FO-MIX exhibiting the greatest reduction, from 16.59 to 7.92 mg/mL (52.3%). The pronounced depletion of reducing sugars, together with high viable LAB counts and organic-acid accumulation, is consistent with active carbohydrate utilization during fermentation. In contrast, only minor changes were observed in the Control and Visco groups. Viscozyme L pretreatment increased the initial reducing-sugar concentration from 15.27 to 16.90 mg/mL, consistent with the enzymatic hydrolysis of carbohydrate-rich components within the seaweed matrix and the consequent increase in substrate accessibility (Park and Park, 2020).
Taken together, the decrease in pH, increase in TA, changes in LAB populations, decrease in reducing sugar concentration, and accumulation of organic acids between 0 and 72 h collectively demonstrate the active fermentation of L. japonica by the onion jangajji-derived LAB strains. FO-MIX showed the most pronounced fermentation profile. Coordinated changes in these fermentation-related parameters may have altered the physicochemical properties and accessibility of the seaweed matrix, potentially facilitating the release or transformation of functional constituents observed in subsequent analyses.
LAB fermentation significantly increased TPC and phlorotannin content across all inoculated groups (p < 0.05). FO-MIX exhibited the highest TPC (25.61 ± 1.10 mg GAE/g DW), corresponding to a 2.43-fold increase relative to the Control (10.54 ± 0.45 mg GAE/g DW). Its phlorotannin content (12.06 ± 0.85 mg PGE/g DW) was likewise 3.04-fold higher than that of the Control (3.97 ± 0.25 mg PGE/g DW) (Table 2). The Visco group also showed moderate increases in TPC and phlorotannin content, indicating that the enzymatic pretreatment was associated with a partial enhancement in the recovery of phenolic constituents.
Enzyme-assisted processing may facilitate the disruption of complex polysaccharide-rich seaweed matrices, thereby increasing the accessibility and recovery of intracellular and matrix-associated compounds (Rodrigues et al., 2015; Wijesinghe and Jeon, 2012a). Brown algal cell walls comprise cellulose, alginates, and fucose-containing sulfated polysaccharides, whereas phlorotannins may be distributed between soluble and cell-wall-associated fractions (Deniaud-Bouët et al., 2017; Koivikko et al., 2005). In this context, the increased TPC and phlorotannin content following LAB fermentation may be partly attributed to the enhanced accessibility and extractability of the phenolic fractions resulting from fermentation-associated alterations in the algal matrix.
The distinct treatment rankings observed for TPC and phlorotannin content among the single-strain treatments further highlighted the strain-dependent differences in phenolic recovery. FO-L9 had the highest TPC, whereas FO-L10 had the highest phlorotannin content. Such differences in ranking may reflect the distinct chemical scope of the two assays; TPC provides a broad estimate of total phenolic content, whereas the phlorotannin assay specifically estimates phloroglucinol-equivalent phenolic fractions (Khan et al., 2022; Phang et al., 2023). Accordingly, these two parameters were not expected to exhibit identical response patterns. Identification and characterization of individual phenolic constituents are necessary to elucidate the chemical basis underlying these strain-dependent differences.
FO-MIX exhibited the most pronounced increase in TPC and phlorotannin content, together with the highest levels of organic-acid production, reducing-sugar utilization, and hydrolytic enzyme activities. The concordant changes across these fermentation-associated parameters suggest that the more pronounced fermentation profile of FO-MIX may favor the enhanced recovery of phenolic constituents. However, in the absence of direct characterization of individual phenolic compounds and structural alterations within the algal matrix, these increases should be interpreted primarily in terms of enhanced extractability and/or fermentation-associated transformation, rather than as evidence for the direct cleavage of specific phlorotannin linkages (Rodrigues et al., 2015; Wijesinghe and Jeon, 2012a).
All Viscozyme-pretreated and LAB-fermented groups exhibited significantly higher AE-FCP content than the non-fermented Control (p < 0.05). FO-MIX showed the highest AE-FCP (28.92 ± 1.13 mg L-FucE/g DW), representing a 1.71-fold increase relative to the Control (16.94 ± 0.88 mg L-FucE/g DW). The significant increase observed in the Visco group indicated that enzymatic pretreatment was associated with enhanced recovery of acid-extractable fucose-containing polysaccharide fractions. The phenol-sulfuric acid assay employed in this study provides a colorimetric estimate expressed as L-fucose equivalents and does not specifically quantify chemically purified fucoidans. Therefore, the measured values were reported as AE-FCP and should be interpreted as L-fucose-equivalent estimates rather than absolute fucoidan concentrations. This distinction is important because fucoidans represent a structurally heterogeneous class of fucose-containing sulfated polysaccharides, with their composition and extractability varying according to seaweed species and extraction conditions (Ale et al., 2011; Deniaud-Bouët et al., 2017; Fitton et al., 2015).
Further increases in AE-FCP after LAB fermentation may reflect the enhanced accessibility of fucose-containing polysaccharide fractions as a consequence of acidification, carbohydrate utilization, and fermentation-associated hydrolytic activity. FO-MIX showed the highest AE-FCP content, along with the greatest reduction in sugar depletion, organic-acid production, and enzyme activity. However, because the molecular weight distribution, sulfate content, monosaccharide composition, and structural characteristics were not determined, the present results do not demonstrate the depolymerization or structural modification of fucoidan itself.
All antioxidant assays (DPPH, ABTS, and FRAP) revealed significantly greater antioxidant activity in the LAB-fermented groups than in the Control and Visco groups (p < 0.05; Table 3). FO-MIX exhibited the highest antioxidant capacity, with DPPH, ABTS, and FRAP values of 80.5 ± 5.4%, 72.7 ± 3.6%, and 1.86 ± 0.15 mM Fe2+ equivalents, respectively, corresponding to 2.04-, 2.39-, and 2.48-fold increases relative to the Control. Although enzymatic pretreatment alone was associated with a moderate enhancement in antioxidant activity, the greater increases observed following LAB fermentation suggest that fermentation-associated compositional changes may have further contributed to the antioxidant capacity.
The enhanced antioxidant activity coincided with a marked increase in the phlorotannin content. Multiple phenolic hydroxyl groups of phlorotannins participate in hydrogen and electron-transfer reactions and stabilize reactive radicals, thereby contributing to their radical-scavenging and reducing capacities (Khan et al., 2022; Phang et al., 2023). Notably, FO-L5 exhibited a lower antioxidant activity than FO-L9 and FO-L10, concomitant with a lower phlorotannin content. This concordant pattern supports an association between phlorotannin recovery and antioxidant capacity but does not exclude contributions from other fermentation-derived compounds.
AE-FCP may also contribute to antioxidant activity. Fucose-containing sulfated polysaccharides from brown seaweeds exhibit structure-dependent antioxidant properties that are influenced by their molecular weight, sulfate content, monosaccharide composition, and structural organization (Ale et al., 2011; Wijesinghe and Jeon, 2012b). As the phlorotannin and AE-FCP contents increased concurrently, their individual contributions could not be distinguished from the present data without fractionation or compound-specific characterization. FO-MIX showed the highest antioxidant activity, phlorotannin and AE-FCP content, and enzyme activity. These coordinated changes suggest that a more pronounced fermentation profile is associated with a greater recovery or transformation of antioxidant-active components. Nevertheless, the present findings indicate associations among specific compounds, enzyme activities, and antioxidant responses rather than establishing direct causal relationships among these factors.
All three measured hydrolytic enzyme activities—β-glucosidase, tannase, and protease—were significantly elevated in the LAB-fermented groups compared with the Control and Visco groups (p < 0.05) (Table 4). FO-MIX exhibited the highest activities across all three enzymes, reaching 0.84 ± 0.03 U/mL for β-glucosidase, 0.35 ± 0.02 U/mL for tannase, and 0.60 ± 0.03 U/mL for protease. The distinct enzyme activity patterns among the single-strain treatments further demonstrated the strain-dependent differences in hydrolytic activity.
1) One unit (U) of β-glucosidase and tannase activity represents liberation of 1 μmol of p-nitrophenol or gallic acid, respectively, per minute.
β-Glucosidase activity was highest in FO-L9 among the single-strain treatments. LAB glycoside hydrolases have been implicated in the conversion of β-glycosylated compounds, including glycosylated phenolics, during food fermentation (Acin-Albiac et al., 2021; Gaur and Gänzle, 2023). The observed association between β-glucosidase activity and generally higher TPC and phlorotannin content was consistent with the potential contribution of glycoside hydrolysis to phenolic release or transformation. Nevertheless, FO-L10 exhibited a higher phlorotannin content than FO-L9 despite its lower β-glucosidase activity, suggesting that phlorotannin recovery likely involves multiple fermentation-associated processes rather than β-glucosidase activity alone.
Tannase activity was detected exclusively in the LAB-fermented groups, with FO-L10 exhibiting the highest activity among the single-strain treatments. Tannase catalyzes the hydrolysis of ester and depside bonds in hydrolyzable tannins and related substrates, and its activity varies substantially among LAB strains (García Méndez et al., 2021). Because phlorotannins are structurally distinct from hydrolyzable tannins, the detected tannase activity does not establish the direct hydrolysis of phlorotannins. Instead, the concomitant increase in phenolic recovery may indicate a broader role of fermentation-associated enzymatic and physicochemical changes in facilitating phenolic transformation or release.
Protease activity was significantly enhanced following LAB fermentation, with the highest activity observed in FO-MIX. The LAB proteolytic system comprises cell-envelope proteinases, peptide transport systems, and intracellular peptidases, which function cooperatively to facilitate protein degradation during fermentation (Savijoki et al., 2006). In seaweed matrices, the enzymatic modification of structural components may increase the accessibility and recovery of bioactive constituents (Wijesinghe and Jeon, 2012a). Therefore, the elevated protease activity observed in the fermentation treatments may have contributed to the enhanced recovery of functional compounds. Nevertheless, because structural alterations in the L. japonica cell wall have not been directly evaluated, the observed association should not be interpreted as evidence of a direct protease-mediated mechanism of compound release.
Taken together, the coordinated increases in β-glucosidase, tannase, and protease activities indicate that LAB fermentation was accompanied by multiple hydrolytic processes that may have facilitated the recovery of functional compounds. FO-MIX exhibited the highest activity among the three enzymes, which is in line with its more pronounced overall fermentation profile. However, these enzyme assays reflect phenotypic catalytic activity and do not establish specific enzyme-substrate interactions. Therefore, further structural and molecular analyses are required to identify the relevant substrates and clarify the mechanisms underlying the enhanced recovery of functional compounds.
All treatment groups maintained cell viability above 90% at 200 μg/mL, suggesting that the observed suppression of inflammatory mediators was not primarily attributable to cytotoxic effects (Supplementary Table S1). Compared to both the LPS control and non-fermented Control extract, LAB-fermented extracts significantly reduced LPS-induced NO production (p < 0.05). FO-MIX showed the most pronounced inhibitory effect (55.4 ± 2.8%), followed by FO-L5 (45.4 ± 3.2%), FO-L9 (36.3 ± 2.3%), and FO-L10 (30.9 ± 1.8%). Consistent with the NO results, LAB fermentation significantly attenuated LPS-induced IL-6 and TNF-α production. FO-MIX produced the greatest reduction, lowering IL-6 and TNF-α levels to 221.2 ± 10.5 and 140.2 ± 9.4 pg/mL, respectively, corresponding to decreases of 49.0% and 57.7%, respectively, relative to the LPS control (Table 5).
1) Cell viability at 200 μg/mL exceeded 90% for all treatment groups (Supplementary Table S1).
The coordinated suppression of NO, IL-6, and TNF-α is consistent with an attenuated inflammatory response in LPS-stimulated macrophages. In RAW 264.7 cells, LPS recognition initiates interconnected signaling cascades involving TLR4, NF-κB, and MAPK, ultimately regulating inflammatory mediators such as iNOS, IL-6, and TNF-α (Ye et al., 2020). Previous studies have shown that phlorotannins derived from brown algae can attenuate LPS-induced inflammatory responses in macrophage models, with modulation of NF-κB and MAPK signaling proposed as a potential mechanism (Phang et al., 2023; Phasanasophon and Kim, 2019; Wijesinghe et al., 2013). Nevertheless, as NF-κB and MAPK activation were not directly assessed in the present study, these pathways should be regarded as plausible mechanistic candidates rather than as mediators of the observed anti-inflammatory effects.
The anti-inflammatory responses to the single-strain treatments did not consistently correspond to the total phlorotannin content. FO-L5 produced greater NO inhibition than FO-L9 and FO-L10 despite its lower phlorotannin content, whereas FO-L10 exhibited the highest phlorotannin content among the single-strain treatments but the weakest NO inhibition. This lack of concordance suggests that the anti-inflammatory activity was not determined solely by total phlorotannin abundance but may have reflected the combined contributions of multiple fermentation-derived constituents and their distinct compositional or structural characteristics. The concomitant increase in the AE-FCP may have contributed to these responses. Fucoidan isolated from Saccharina japonica has been reported to attenuate LPS-induced inflammatory responses in macrophages through modulation of NF-κB, MAPK, and JAK-STAT signaling pathways and suppression of inflammatory mediators (Ye et al., 2020). However, because the AE-FCP in the present study represented a fucoidan-equivalent estimate rather than a measurement of structurally purified fucoidan, the observed anti-inflammatory effects could not be specifically assigned to fucoidan or any individual sulfated polysaccharide fraction.
FO-MIX exhibited the most pronounced inhibition of NO, IL-6, and TNF-α production and the highest levels of hydrolytic enzyme activities, TPC, phlorotannin, and AE-FCP. The coordinated changes in these compositional and functional parameters suggest that the enhanced anti-inflammatory response is associated with a broader fermentation-induced transformation of the seaweed matrix. However, because the specific bioactive constituents and underlying signaling pathways have not been directly characterized, further fractionation, comprehensive metabolite profiling, and direct investigation of the inflammatory signaling pathways are warranted to elucidate the mechanisms responsible for these effects.
Pearson’s correlation analysis revealed strong associations between enzyme activities, functional compound-related parameters, antioxidant capacity, and anti-inflammatory responses across 18 biological replicates (Table 6; Fig. 1). β-Glucosidase activity showed strong positive correlations with TPC, phlorotannin, AE-FCP, and antioxidant activities (p < 0.001), consistent with the established involvement of LAB glycoside hydrolases in the transformation of glycosylated phenolic compounds during fermentation (Gaur and Gänzle, 2023). Nevertheless, as the specific phenolic substrates and bond-cleavage reactions in L. japonica were not directly characterized, these correlations cannot be taken as evidence of specific β-glucosidase-mediated reactions. Tannase activity also showed strong positive correlations with phlorotannin content, TPC, and antioxidant activity (p < 0.001). However, given the structural distinction between phlorotannins and hydrolyzable tannins, these relationships should not be interpreted as evidence of direct tannase-mediated phlorotannin hydrolysis. Instead, the observed correlations may reflect a concomitant variation in tannase activity with broader fermentation-associated changes in phenolic composition and extractability. Protease activity was strongly correlated with antioxidant activity, anti-inflammatory responses, and AE-FCP content (p < 0.001), indicating that proteolytic activity covaried with the recovery of functional constituents and their associated biological activities. However, these correlations do not establish a direct role for proteases in polysaccharide release or formation of specific bioactive compounds.
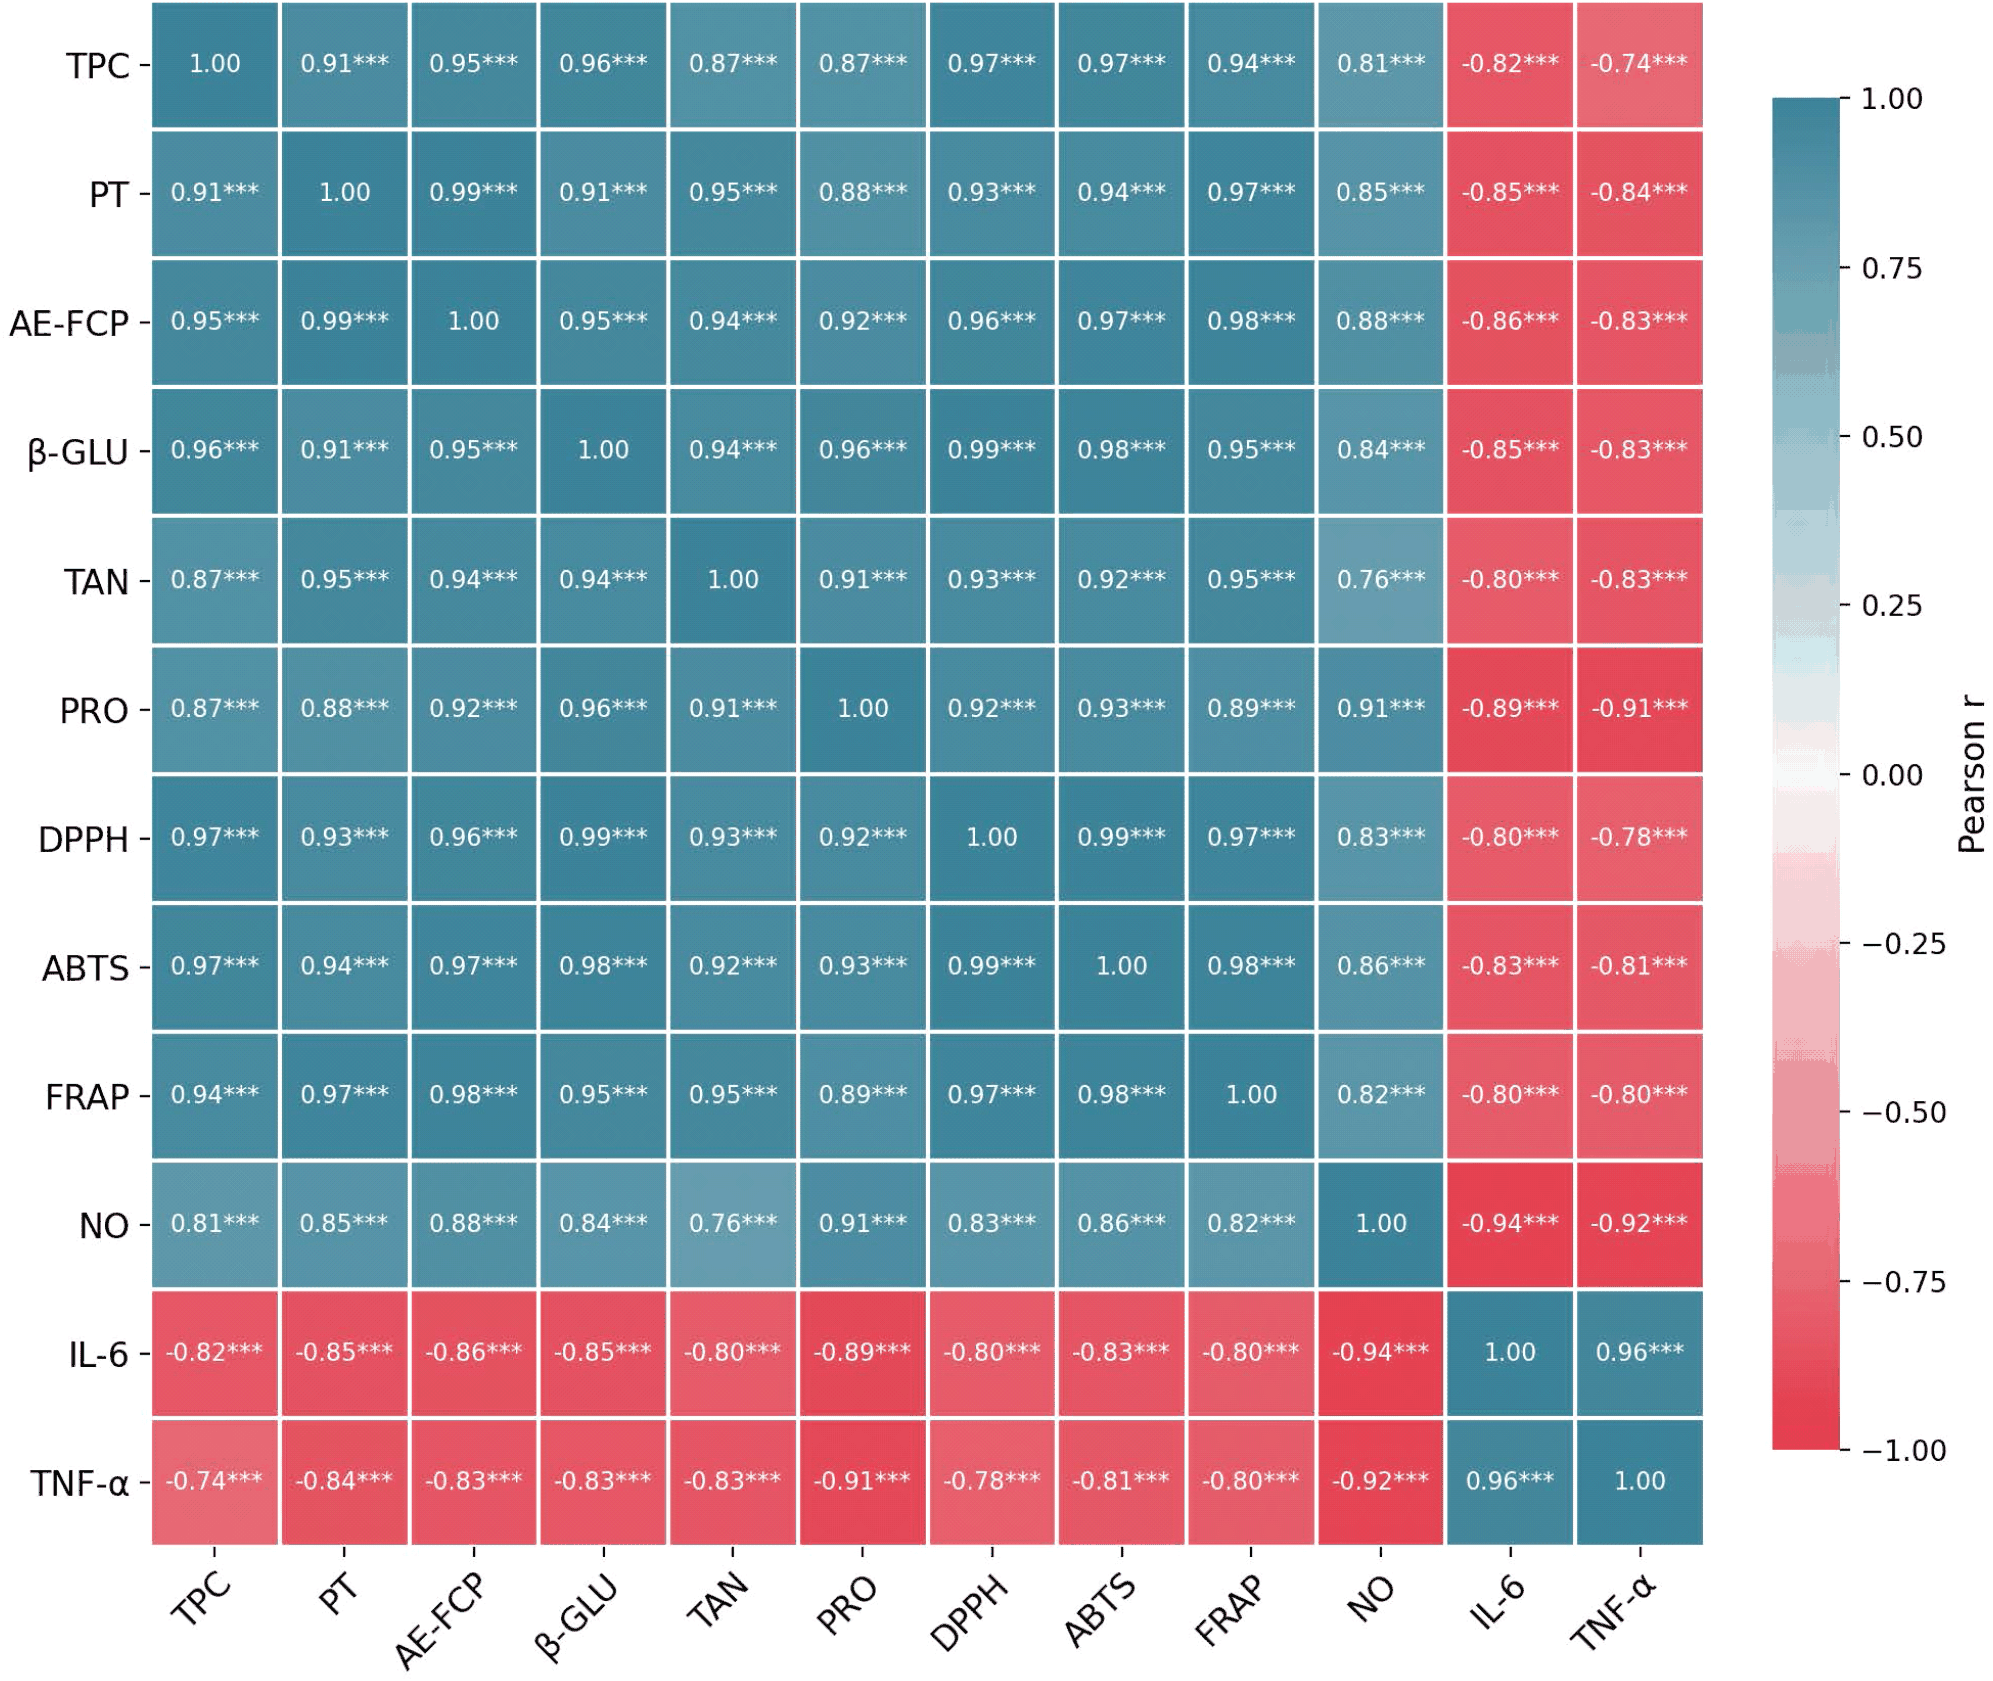
Phlorotannin content was strongly positively correlated with DPPH, ABTS, and FRAP activities (r = 0.928, 0.936, and 0.971, respectively) and strongly negatively correlated with IL-6 and TNF-α levels (r = −0.850 and −0.838; p < 0.001). NO inhibition also showed a strong positive correlation with the phlorotannin content (r = 0.849). These relationships are consistent with previously reported antioxidant and anti-inflammatory properties of brown algal phlorotannins (Phang et al., 2023; Wijesinghe et al., 2013). AE-FCP content likewise exhibited strong positive correlations with FRAP, DPPH, and ABTS activities (r = 0.981, 0.963, and 0.971, respectively) and strong negative correlations with IL-6 and TNF-α levels (r = −0.855 and −0.832; p < 0.001), consistent with the reported biological activities of fucoidan and related fucose-containing sulfated polysaccharides. However, because AE-FCP was quantified as a fucose-equivalent estimate rather than as a structurally purified fucoidan, these relationships are better interpreted as indicating the potential contribution of fucose-containing sulfated polysaccharide fractions rather than a fucoidan-specific effect. Collectively, the correlation matrix revealed coordinated variations among enzyme activities, functional compound-related parameters, antioxidant capacity, and anti-inflammatory responses across the treatment-associated observations (Table 6; Fig. 1). Importantly, because the correlations were calculated from replicate observations distributed across distinct treatment groups, they should be regarded as exploratory associations rather than as evidence of direct causal or mechanistic relationships.
PCA of the 12 standardized variables using the complete replicate-level dataset (n = 18) identified a dominant PC1 with an eigenvalue of 10.87, accounting for 90.6% of the total variance, whereas PC2 had an eigenvalue of 0.61 and explained only 5.1% of the variance. According to the Kaiser criterion, PC1 was therefore retained as the major component. All 12 variables exhibited strong loadings on PC1, with absolute values ranging from 0.89 to 0.98. Positive loadings were observed for TPC, phlorotannin, AE-FCP, β-glucosidase, tannase, protease, DPPH, ABTS, FRAP, and NO inhibition, while IL-6 and TNF-α exhibited negative loadings (Supplementary Table S2). This loading pattern indicates that higher PC1 scores correspond to a coordinated profile characterized by greater enzyme activity, higher levels of functional compound-related parameters and antioxidant activities, stronger NO inhibition, and lower cytokine levels. Accordingly, PC1 can be descriptively viewed as an overall gradient of fermentation-associated functional changes, rather than as evidence of a specific causal mechanism.
Treatment-level mean PC1 scores positioned FO-MIX at the positive extreme (4.936), followed by FO-L9 (1.700), FO-L10 (1.289), and FO-L5 (0.362), while Visco (−3.372) and Control (−4.915) occupied the negative end of the axis (Supplementary Table S3; Fig. 2). The corresponding PC2 scores were 0.209 for the control, 0.131 for Visco, 1.492 for FO-L5, 0.656 for FO-L9, 0.586 for FO-L10, and 0.091 for FO-MIX, defining the treatment centroids shown in the PCA biplot (Fig. 2). The pronounced positive positioning of FO-MIX along PC1 was consistent with its overall higher enzyme activities, phlorotannin and AE-FCP content, antioxidant capacity, and anti-inflammatory responses. Given that only PC1 satisfied the Kaiser criterion, the observed treatment separation was best interpreted as variation in a dominant multivariate gradient of coordinated functional responses rather than as evidence for distinct secondary biological processes. PC2 was retained for graphical visualization only and was not assigned a formal biological interpretation in accordance with the PCA loading structure (Supplementary Table S2).
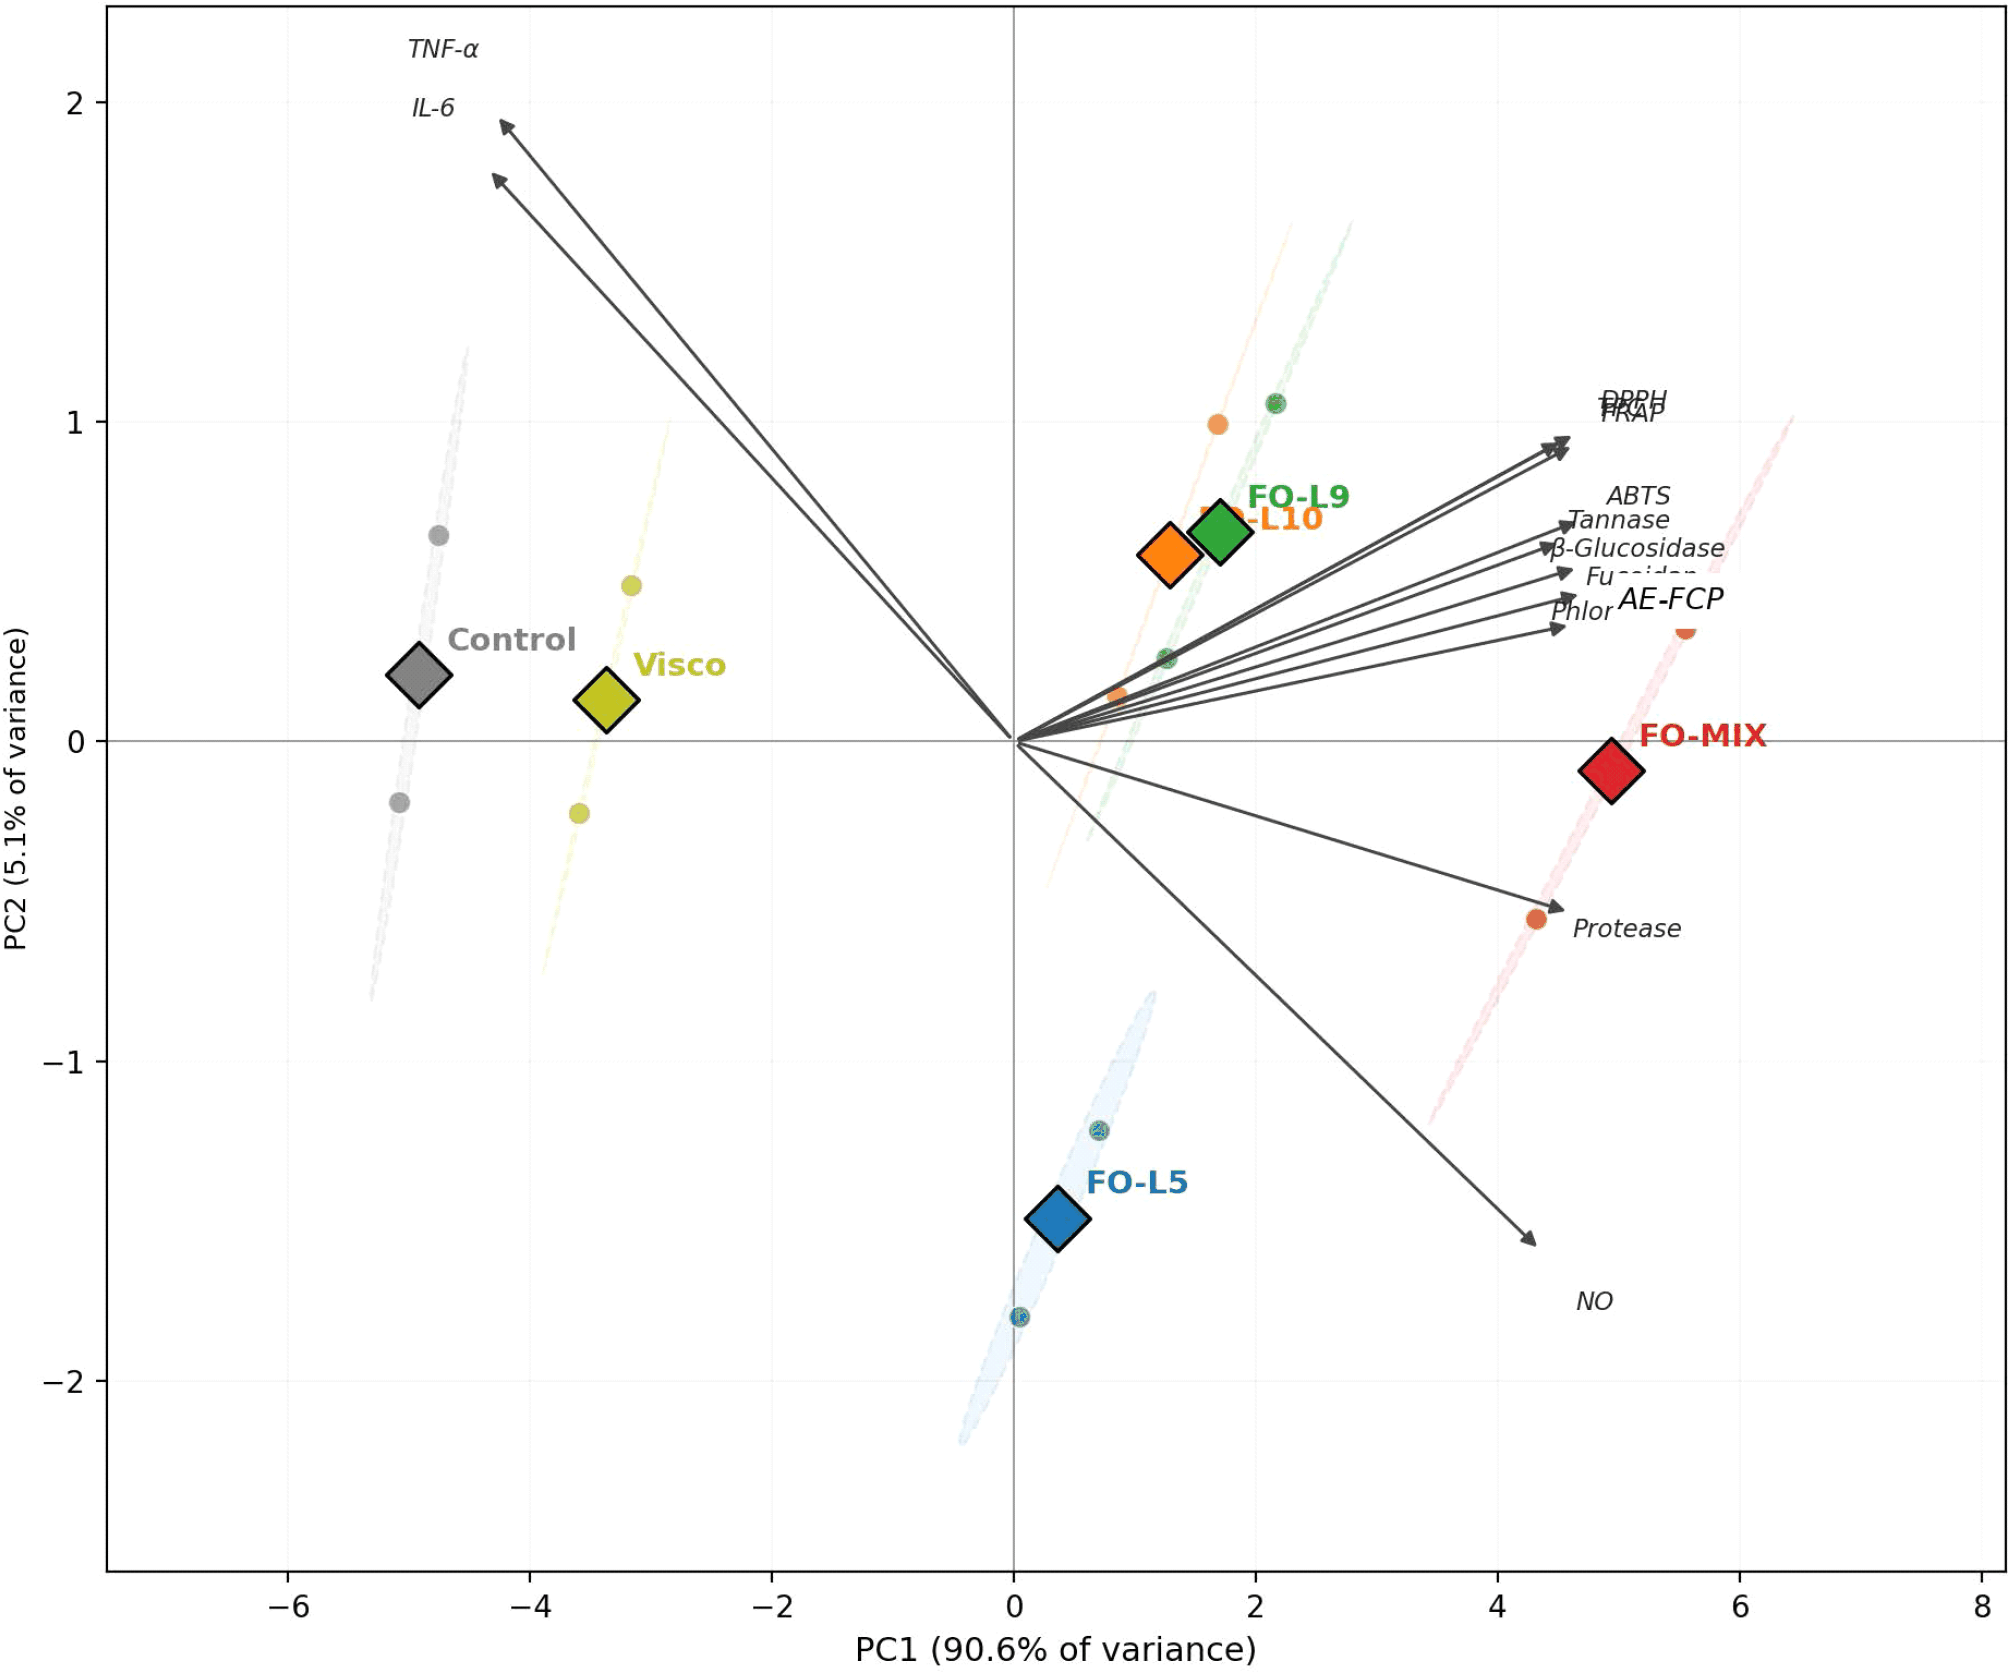
Taken together, Pearson correlation analysis and PCA provided complementary multivariate evidence of coordinated variation among enzyme activities, bioactive compound-related parameters, antioxidant capacity, and anti-inflammatory responses across the experimental treatments (Table 6; Figs. 1 and 2; Supplementary Tables S2 and S3). The concordant patterns observed in these analyses support coordinated treatment-associated changes across the measured functional parameters while emphasizing that the observed relationships remain associative rather than mechanistic.
4. Conclusions
LAB fermentation of L. japonica, particularly using the FO-MIX consortium comprising W. confusa FO-L5 and P. acidilactici FO-L10, was associated with pronounced improvements in fermentation characteristics and functional properties compared to the non-fermented Control and Viscozyme L-pretreated groups. FO-MIX exhibited the most pronounced overall fermentation profile, characterized by the lowest final pH, highest titratable acidity and viable LAB count, the greatest depletion of reducing sugars, and the highest production of lactic and acetic acids. These changes coincided with the highest TPC, phlorotannin, and AE-FCP contents, as well as the greatest β-glucosidase, tannase, and protease activities and the strongest antioxidant and anti-inflammatory responses.
The coordinated increases in hydrolytic enzyme activity, bioactive compound-related parameters, antioxidant capacity, and anti-inflammatory activity suggest that multiple fermentation-associated physicochemical and enzymatic changes may have contributed to the enhanced functional properties of L. japonica. Pearson correlation analysis and PCA further revealed strong treatment-associated covariation across these parameters, with FO-MIX exhibiting the most favorable overall multivariate profile. However, the observed associations did not establish direct enzyme-substrate relationships or formal synergistic interactions between the strains. Furthermore, AE-FCP represents an L-fucose-equivalent estimate rather than a structurally confirmed fucoidan concentration, and the specific signaling mechanisms underlying the observed anti-inflammatory effects were not directly evaluated.
Overall, LAB fermentation, particularly coculture fermentation using metabolically complementary strains, represents a promising mild bioprocessing strategy for improving the functional properties of L. japonica. Further structural characterization of the phenolic and polysaccharide fractions, targeted metabolomic profiling, direct assessment of strain interactions, validation of inflammatory signaling pathways, and in vivo studies will be valuable to elucidate the mechanisms underlying these effects and establish the functional potential of fermented L. japonica.


