


1. Introduction
Cholesterol is a sterol found naturally in foods of animal origin and performs essential physiological functions as a structural component of cell membranes and a precursor of bile acids, steroid hormones, and vitamin D3 (Albuquerque et al., 2016; Andersen, 2018; Chen et al., 2015; Li et al., 2019). Despite these roles, excessive dietary cholesterol intake has been associated with elevated serum cholesterol concentrations and an increased risk of cardiovascular diseases such as hyperlipidemia and atherosclerosis (Duan et al., 2019; Kim et al., 2011; López-Puebla et al., 2025; Ndhlala et al., 2023). Accordingly, the Dietary Reference Intakes for Koreans recommend that adults aged 19 years and older limit cholesterol intake to less than 300 mg/day (MOHW, 2025). Reliable data on the cholesterol content of commonly consumed foods are therefore essential for dietary assessment, nutrition labeling, and public health research.
In Korea, the consumption of processed foods has risen steadily with changing dietary patterns, increasing the dietary contribution of processed animal-derived products and their constituent ingredients (Jung et al., 2022). Many such products, including processed seafood, meat products, sauces, and spices, are widely consumed but remain poorly characterized for cholesterol content in current food composition databases. Because cholesterol is one of the nutrients required to be declared on processed food labels in Korea (Jung et al., 2022), the lack of validated analytical values for these product categories creates a practical gap in regulatory compliance and consumer information. Cholesterol content varies widely among processed foods depending on food source, species, ingredients, tissue composition, and processing conditions. Previous studies have reported values of 6.50-78.40 mg/100 g in raw marine fish (Ozogul et al., 2015), 131.08 mg/100 g in shrimp pancake, and 247.92 mg/100 g in seasoned pollock roe (Ahn and Shin, 2023). In meat products, cholesterol contents of 30-34 mg/100 g in Iberian dry-cured ham (Petrón et al., 2003) and 44.34-52.66 mg/100 g in raw and cooked pork loin (Min et al., 2016) have been reported. In contrast, cholesterol data for commercially available sauces and seasonings remain limited, highlighting the need for systematic analysis of these food categories using a validated method.
Several analytical techniques have been used to determine cholesterol in foods, principally gas chromatography (GC) (Albuquerque et al., 2016; Chen et al., 2015; Duan et al., 2019; Kim et al., 2011) and high-performance liquid chromatography (HPLC) (Azrina et al., 2015; Daneshfar et al., 2009; Domínguez et al., 2018; Kolarič and Šimko, 2020). Among these, direct saponification followed by trimethylsilyl (TMS) derivatization and GC analysis is widely regarded as the reference procedure (Chen et al., 2015; Dinh et al., 2012), and AOAC Official Method 994.10 remains the only officially validated method specifically developed for cholesterol determination in foods by GC with flame ionization detection (FID) (AOAC, 2000; Domínguez et al., 2018). However, the accurate quantification of cholesterol in compositionally diverse processed foods, particularly plant-based sauces and spices in which cholesterol occurs only at trace levels within complex matrices, remains analytically demanding and requires a method with demonstrated performance across such matrices.
The Korean Ministry of Food and Drug Safety (MFDS) has maintained the Korean Food Composition Database (FCDB) since 2009, providing a comprehensive source of nutritional information for dietary assessment, nutrition policy, and food labeling (Ahn and Shin, 2023; Sharmin et al., 2017); however, cholesterol values remain unavailable for many processed foods commonly consumed in Korea. Accordingly, this study aimed to determine the cholesterol content of 43 commonly consumed processed foods, including seafood, meat, and sauce and spice products, using gas chromatography with flame ionization detection (GC-FID) validated in accordance with AOAC single-laboratory validation guidelines and to provide reliable analytical data for the FCDB. Additionally, gas chromatography-mass spectrometry (GC-MS) was used to confirm the identity of trace cholesterol detected in selected spice products, thereby verifying the applicability of the analytical approach to complex food matrices.
2. Materials and methods
Reagent-grade ethanol, n-hexane, and ethyl acetate for cholesterol extraction were purchased from Samchun Chemicals Co., Ltd. (Seoul, Korea). Potassium hydroxide (KOH, 93.0% purity), pyrogallol (99.0% purity), and butylated hydroxytoluene (BHT, 99.5% purity) were purchased from Daejung Chemicals & Metals Co. (Siheung, Korea), and sodium chloride (NaCl) was purchased from Showa Chemical Co. (Shanghai, China). Hexamethyldisilazane (HMDS, ≥ 99.0% purity), chlorotrimethylsilane (TMS, ≥ 99.0% purity), and high-purity cholesterol and 5α-cholestane standards were purchased from Sigma-Aldrich Co. (St. Louis, MO, USA), and N,N-dimethylformamide (DMF, 99.5% purity) was purchased from Tokyo Chemical Industry Co. (Tokyo, Japan). Standard reference material (SRM 1546a) was purchased from the National Institute of Standards and Technology (NIST, Gaithersburg, MD, USA).
Forty-three processed food products, including seafood products (n = 22), meat products (n = 5), and sauces and spices (n = 16), were provided by the Rural Development Administration (RDA, Jeonju, Korea). According to RDA sampling records, the products were collected or purchased in 2023-2024. All samples except onion powder were homogenized and analyzed without additional drying. The onion powder sample subjected to GC-MS analysis was confirmed by the product label to contain 100% dehydrated onion, with no other declared ingredients. The samples were stored at −27°C until analysis. Before analysis, the freeze-dried samples were equilibrated to room temperature for at least 20 min, thoroughly homogenized to ensure uniformity, and then subjected to cholesterol extraction.
Samples and the standard reference material were prepared for cholesterol analysis using direct saponification and solvent extraction as described by Ahn and Shin (2023). Approximately 2-3 g of the well-homogenized sample was accurately weighed into an extraction tube, followed by 3 mL of distilled water and 10 mL of 6% pyrogallol in ethanol. The mixture was vortexed for 2 min, flushed with nitrogen for 1 min, and sonicated at 25°C for 10 min. Then, 8 mL of 60% KOH solution was added to the mixture. The mixture was vortexed for 1 min, followed by nitrogen flushing for 1 min. Saponification was performed in a shaking water bath at 75°C and 100 rpm for 1 h. After saponification, the mixture was cooled to room temperature. Then, 20 mL of 2% NaCl solution (in distilled water) and 10 mL of extraction solvent (hexane/ethyl acetate, 85:15, v/v, containing 0.01% BHT) were added, and the mixture was vortexed vigorously for 2 min. The upper unsaponified layer was passed through an anhydrous sodium sulfate (Na2SO4) column into a 50 mL volumetric flask. The extraction was repeated four times, and the combined extracts were brought to volume with the extraction solvent. A 12 mL aliquot was evaporated to dryness under a stream of nitrogen, redissolved in 3 mL of acetone, and evaporated again under nitrogen.
The dried residue was dissolved in 3 mL of DMF for derivatization. A 1 mL aliquot of each solution was derivatized with 0.2 mL of HMDS and 0.1 mL of TMS, vortexed for 30 s, and left at room temperature for 15 min. Then, 1 mL of internal standard solution (5α-cholestane, 0.1 mg/mL in n-heptane) and 10 mL of distilled water were added to terminate the reaction. The mixture was vortexed for 1 min, and the heptane layer was transferred through an anhydrous Na2SO4 column into a GC vial.
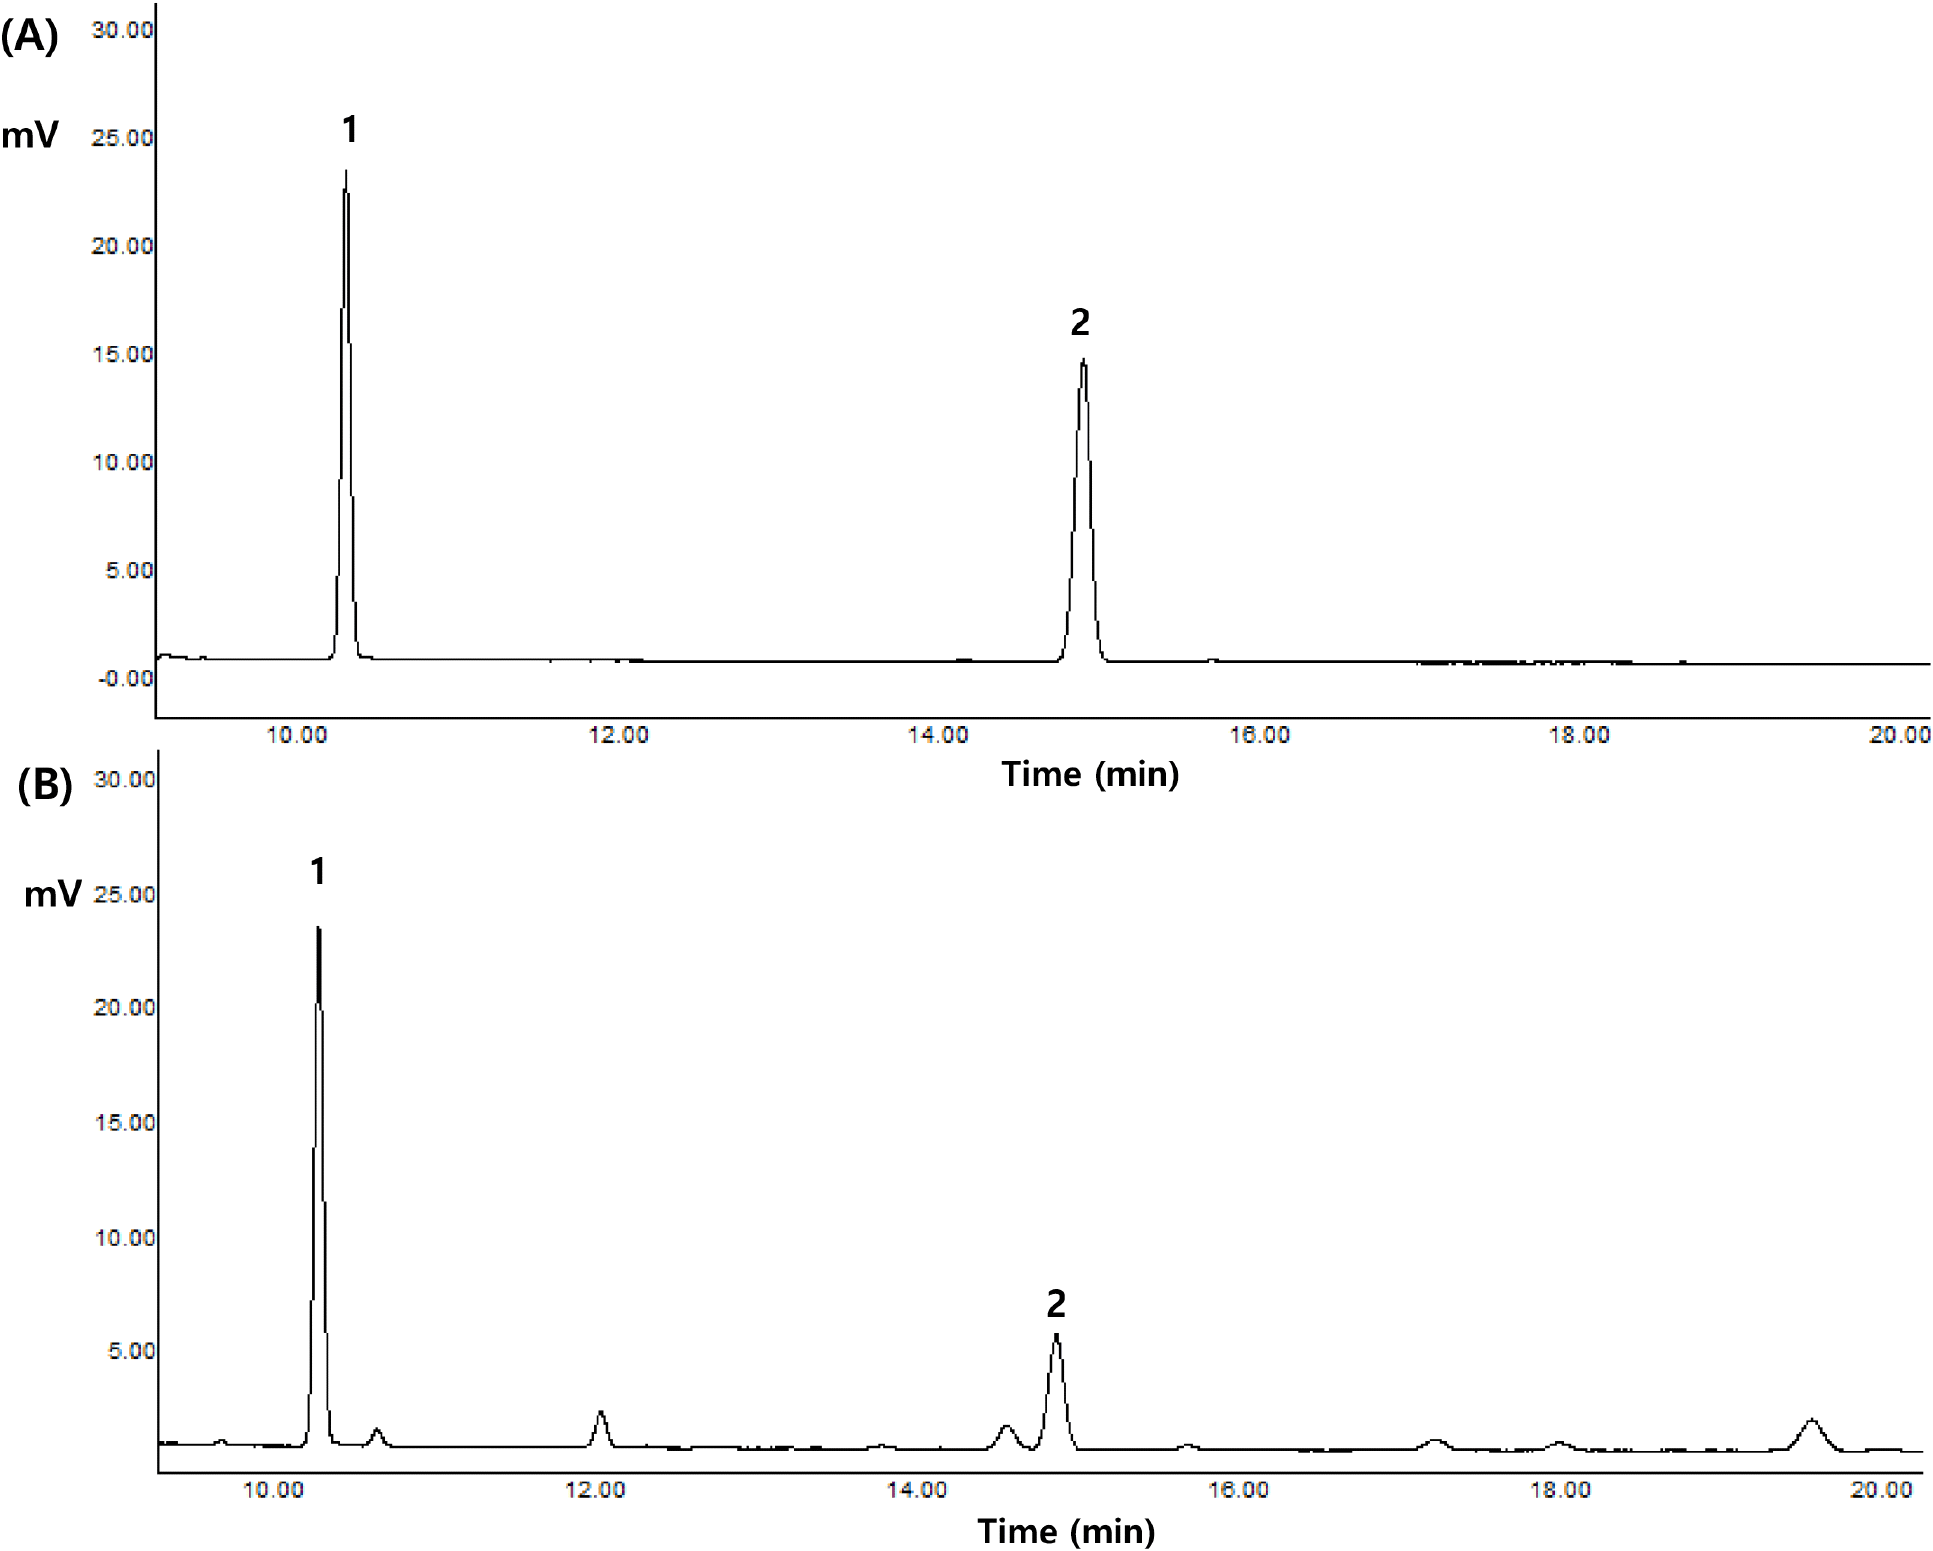
Cholesterol was identified and quantified using a YL 6500 GC system (6500GC, Young In Chromass, Anyang, Korea) equipped with an FID. Separation was achieved on an Agilent J&W Ultra 2 (5%-phenyl)-methylpolysiloxane column (25 m × 0.2 mm, 0.3 μm). The oven was held at 250°C for 5 min, then increased to 285°C at 10°C/min and held for 20 min. Nitrogen was used as the carrier gas at 1 mL/min; a 2 μL aliquot was injected with a split ratio of 20:1. The injector and detector temperatures were 280°C and 300°C, respectively. The retention times of the derivatized cholesterol standard and internal standard (5α-cholestane) were 14.64 min and 10.15 min, respectively. Cholesterol was quantified against the internal standard using the calibration curve. Representative GC chromatograms of the standards and a quality control sample (infant formula) are shown in Fig. 1.
GC-MS analysis was performed on an Agilent 7890A gas chromatograph (Agilent Technologies, Santa Clara, CA, USA) coupled to an Agilent 5977 mass selective detector (MSD). Separation was achieved on an Agilent J&W HP-5 ms Ultra Inert (5%-phenyl)-methylpolysiloxane column (30 m × 0.25 mm, 0.25 μm). Helium was used as the carrier gas at a constant flow rate of 0.8 mL/min. The oven was held at 250°C for 5 min, then increased to 285°C at 10°C/min and held for 25 min (total run time, 33.5 min). A 2 μL aliquot of the derivatized extract was injected via autosampler at a split ratio of 5:1. The transfer line interface (thermal aux 1) and MSD transfer line (thermal aux 2) temperatures were 115°C and 280°C, respectively. The mass spectrometer was operated in electron ionization (EI) mode, with the ion source and quadrupole at 230°C and 150°C, respectively. Mass spectra were acquired in full-scan mode over an m/z range of 50-550. 5α-Cholestane was used as the internal standard. Because 5α-cholestane lacks a hydroxyl group, it does not form a trimethylsilyl (TMS) derivative and was detected as the underivatized compound. It was identified by its molecular ion at m/z 372 and by the characteristic ions at m/z 217 (base peak) and m/z 357 ([M-15]⁺). Cholesterol was analyzed as its TMS ether derivative (molecular weight 458). Its identity was confirmed based on three criteria: (i) the retention time matched that of the cholesterol standard; (ii) the characteristic ions at m/z 458 (molecular ion, [M]⁺), 368 ([M-90]⁺, loss of trimethylsilanol), 329 ([M-129]⁺), and 129 (the diagnostic ion of Δ⁵-3β-trimethylsilyloxy sterols) were observed together; and (iii) the relative intensities of these ions were consistent with those of the standard. The molecular ion at m/z 458 was used to distinguish cholesterol from co-eluting plant sterols (e.g., campesterol, stigmasterol, and β-sitosterol), whose TMS derivatives have different molecular ions.
The method was validated in accordance with the AOAC single-laboratory validation guidelines to confirm that the GC-FID method provided reliable and reproducible cholesterol measurements (AOAC, 2002; Domínguez et al., 2018). Accuracy, precision, limit of detection (LOD), limit of quantification (LOQ), and linearity were evaluated. Accuracy and precision were assessed using SRM 1546a (NIST), using the certified value as the reference, and were expressed as recovery (%) and z-score:
where Cn is the analyzed cholesterol content (mg/100 g), Cm is the assigned (certified) value (mg/100 g), and SD is the standard deviation of the assigned value. According to AOAC (2002), recoveries of 80-115% with |z| ≤ 2 (at an analyte level of ~1 mg/100 g) are considered acceptable. LOD and LOQ were calculated from the calibration curve obtained in the linearity assessment:
where SD is the standard deviation of the response (y-intercept) and S is the slope of the calibration curve. The resulting concentrations were converted to mg/100 g.
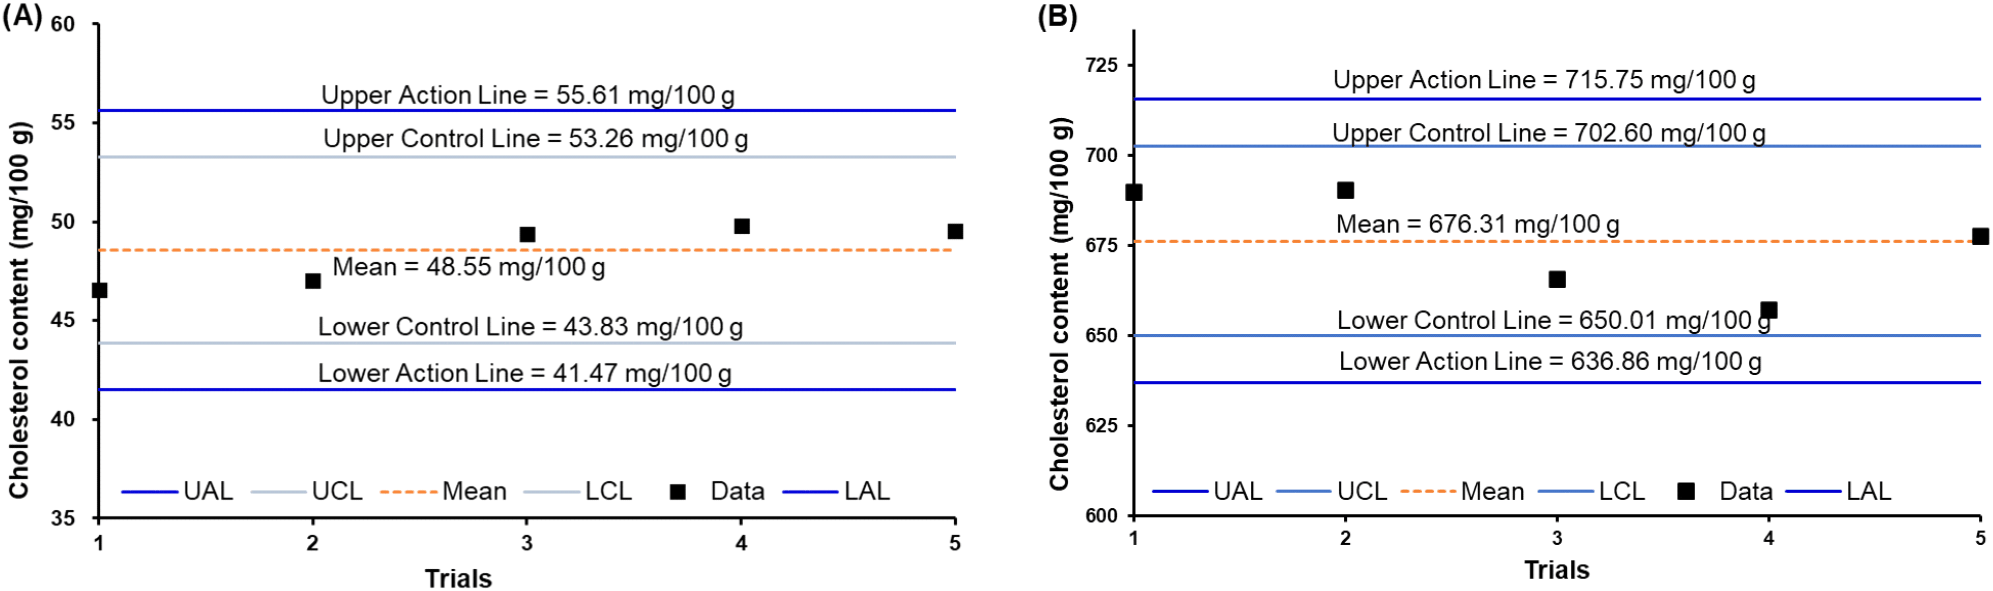
To ensure the quality of cholesterol measurements in food samples, in-house quality control (IHQC) samples consisting of infant formula and beef liver were analyzed with each batch of food samples and used to construct quality control (QC) charts (Fig. 2). Variations in analytical conditions, including instrument performance and sample preparation, can influence the measured cholesterol content over time. Therefore, QC charts were used to monitor analytical performance and to confirm that the method remained under statistical control throughout the analytical period. The QC charts were constructed using the mean and SD of the analytical results and included the upper and lower control lines (UCL and LCL) as well as the upper and lower action lines (UAL and LAL) (AOAC, 2002):
Analytical measurements of food samples were performed in duplicate, and SRM 1546a was analyzed in triplicate. Data are presented as the mean ± SD. Statistical analysis was performed using IBM SPSS Statistics for Windows (Version 22.0; IBM Corp., Armonk, NY, USA). Differences among samples were assessed by one-way analysis of variance (ANOVA) followed by Tukey’s multiple comparison test; p < 0.05 was considered statistically significant.
3. Results and discussion
The accuracy and precision of the method were evaluated using the recovery of SRM 1546a relative to its certified reference value, as shown in Table 1. According to the AOAC (2002) guidelines, at a concentration of 1 mg/100 g, a recovery within 80-115%, an RSD within 6%, and an absolute z-score of ≤ 2 are considered acceptable. The measured cholesterol content of SRM 1546a was 72.68 mg/100 g, corresponding to a recovery of 101.38%, an RSD of 4.00%, and a z-score of 0.45. These values fell within the AOAC acceptance ranges, indicating that the validated method provided accurate and reliable cholesterol measurements in processed food samples. As shown in Table 1, the calibration curve exhibited excellent linearity over the concentration range of 0.0015-0.2000 mg/mL, with the regression equation y = 10.033x + 0.0169 and a coefficient of determination (R2) of 0.9994. The LOD and LOQ of the method were 0.09 and 0.43 mg/100 g, respectively (Table 1). The LOQ was comparable to that reported by Islam and Chun (2024) and lower than that reported by Dinh et al. (2012) (LOD, 1.24 mg/100 g; LOQ, 3.76 mg/100 g) using GC-FID, indicating good analytical sensitivity. The analytical QC results are presented in Fig. 2. The mean cholesterol content in the infant formula was 48.55 mg/100 g, with upper and lower action lines (UAL and LAL) of 55.61 and 41.47 mg/100 g and upper and lower control lines (UCL and LCL) of 53.26 and 43.83 mg/100 g, respectively. For the beef liver, the mean cholesterol content was 676.31 mg/100 g, with UAL and LAL of 715.75 and 636.86 mg/100 g and UCL and LCL of 702.60 and 650.01 mg/100 g, respectively. Throughout the analytical period, the measured cholesterol contents of both IHQC samples remained within the established action lines, indicating that the analytical process remained under statistical control and supporting the reliability of the analytical results.
The cholesterol contents of 22 processed seafood products (squid, flying fish roe, semi-dried pollock, pollock pancake, shrimp cutlet, fish cutlet, cockle, freshwater snail, sea mustard, mackerel, spanish mackerel, fermented oyster, fermented cutlass fish, and fermented anchovy) are presented in Table 2. In this study, RI (%) was calculated using the recommended daily cholesterol limit of 300 mg/day for adults (≥ 19 years) established in the Dietary Reference Intakes for Koreans (MOHW, 2025) as the reference value. The cholesterol content of the processed seafood products ranged from 7.64 ± 0.35 to 339.22 ± 16.72 mg/100 g, corresponding to RI values of 2.55-113.07%, with significant differences among samples (p < 0.05). The cholesterol content of seafood is influenced by various intrinsic and extrinsic factors, including diet, habitat, season, maturity, thermal conditions, and preservation methods (Jung et al., 2022; Ozogul et al., 2015; Shirai et al., 2006). Smoked squid exhibited the highest cholesterol content among all products tested (339.22 ± 16.72 mg/100 g, 113.07% RI), more than four times the value in oil-fried squid from the same species (79.07 ± 0.65 mg/100 g). Among the products examined, fish cutlet showed the greatest cooking-related increase in cholesterol content per 100 g, with increases of 65.55% after air-frying and 34.97% after oil-frying (Fig. 3). Shrimp cutlet also showed a moderate increase in cholesterol content per 100 g of sample, with increases of 29.08% after air-frying and 16.34% after oil-frying. Smaller increases were observed in flying fish roe, semi-dried pollock, and pollock pancake, although the magnitude of the change varied with the food matrix and cooking method. The higher cholesterol content per 100 g after cooking was likely attributable to moisture loss during thermal processing, which raises the relative cholesterol concentration on a weight basis (Lee et al., 2015). The cholesterol content of raw flying fish roe in the present study was 172.18 ± 8.24 mg/100 g and increased slightly to 178.76 ± 1.36 mg/100 g after steaming; both were considerably lower than the 430 mg/100 g reported for salted flying fish roe (tobiko) by Shirai et al. (2006). For semi-dried pollock, boiling significantly increased the cholesterol content on a 100 g basis from 85.87 ± 3.03 to 107.73 ± 0.97 mg/100 g, corresponding to a 25.51% increase. In contrast, pollock pancake showed no significant difference in cholesterol content between the frozen (143.85 ± 4.91 mg/100 g) and oil-fried (144.50 ± 1.87 mg/100 g) samples, indicating that oil-frying did not significantly affect the cholesterol level of this product. These values were also close to the 136.73 mg/100 g reported for raw pollock pancake in the Ministry of Food and Drug Safety database (MFDS, 2022a), likely reflecting consistent raw-material sourcing and standardized processing. In fish cutlet, the cholesterol content increased from 21.68 ± 0.29 mg/100 g in the raw sample to 29.26 ± 0.97 mg/100 g after oil-frying and 35.88 ± 1.52 mg/100 g after air-frying, corresponding to increases of 34.97% and 65.55%, respectively, when expressed per 100 g of sample. In shrimp cutlet, oil-frying and air-frying increased the cholesterol content by 16.34% and 29.08%, respectively, compared with the uncooked product. The cholesterol content of raw spanish mackerel (82.47 ± 1.92 mg/100 g) was higher than the values reported by Osman et al. (2001) and the USDA (2019) (41.1 and 76 mg/100 g, respectively), but lower than that reported by Azrina et al. (2015) (99.34 mg/100 g). Fermented oyster had a higher cholesterol content (48.59 ± 0.99 mg/100 g) than raw oyster, consistent with the raw-oyster value of 27.13 mg/100 g reported by Azrina et al. (2015). Cooking-induced changes in cholesterol content and the corresponding percentage variation (PV, %) for the seafood products are summarized in Fig. 3A. Differences among the raw and cooked samples of each product were evaluated by one-way ANOVA followed by Tukey’s test (p < 0.05), and the resulting significance groupings are indicated by different lowercase letters in both Table 2 and Fig. 3A. The increase in cholesterol content after cooking may be attributed mainly to moisture loss, which reduces sample weight while cholesterol is retained in the tissue, thereby increasing its content on a 100 g basis. In addition, heat-induced disruption of cellular membranes and tissue structures may facilitate the release and extraction of cholesterol from the food matrix, contributing to higher measured values in cooked samples (Lee et al., 2015; Ozogul et al., 2015).
1) RI (%) was calculated as the cholesterol content per 100 g of sample divided by the reference intake of 300 mg/day, multiplied by 100.
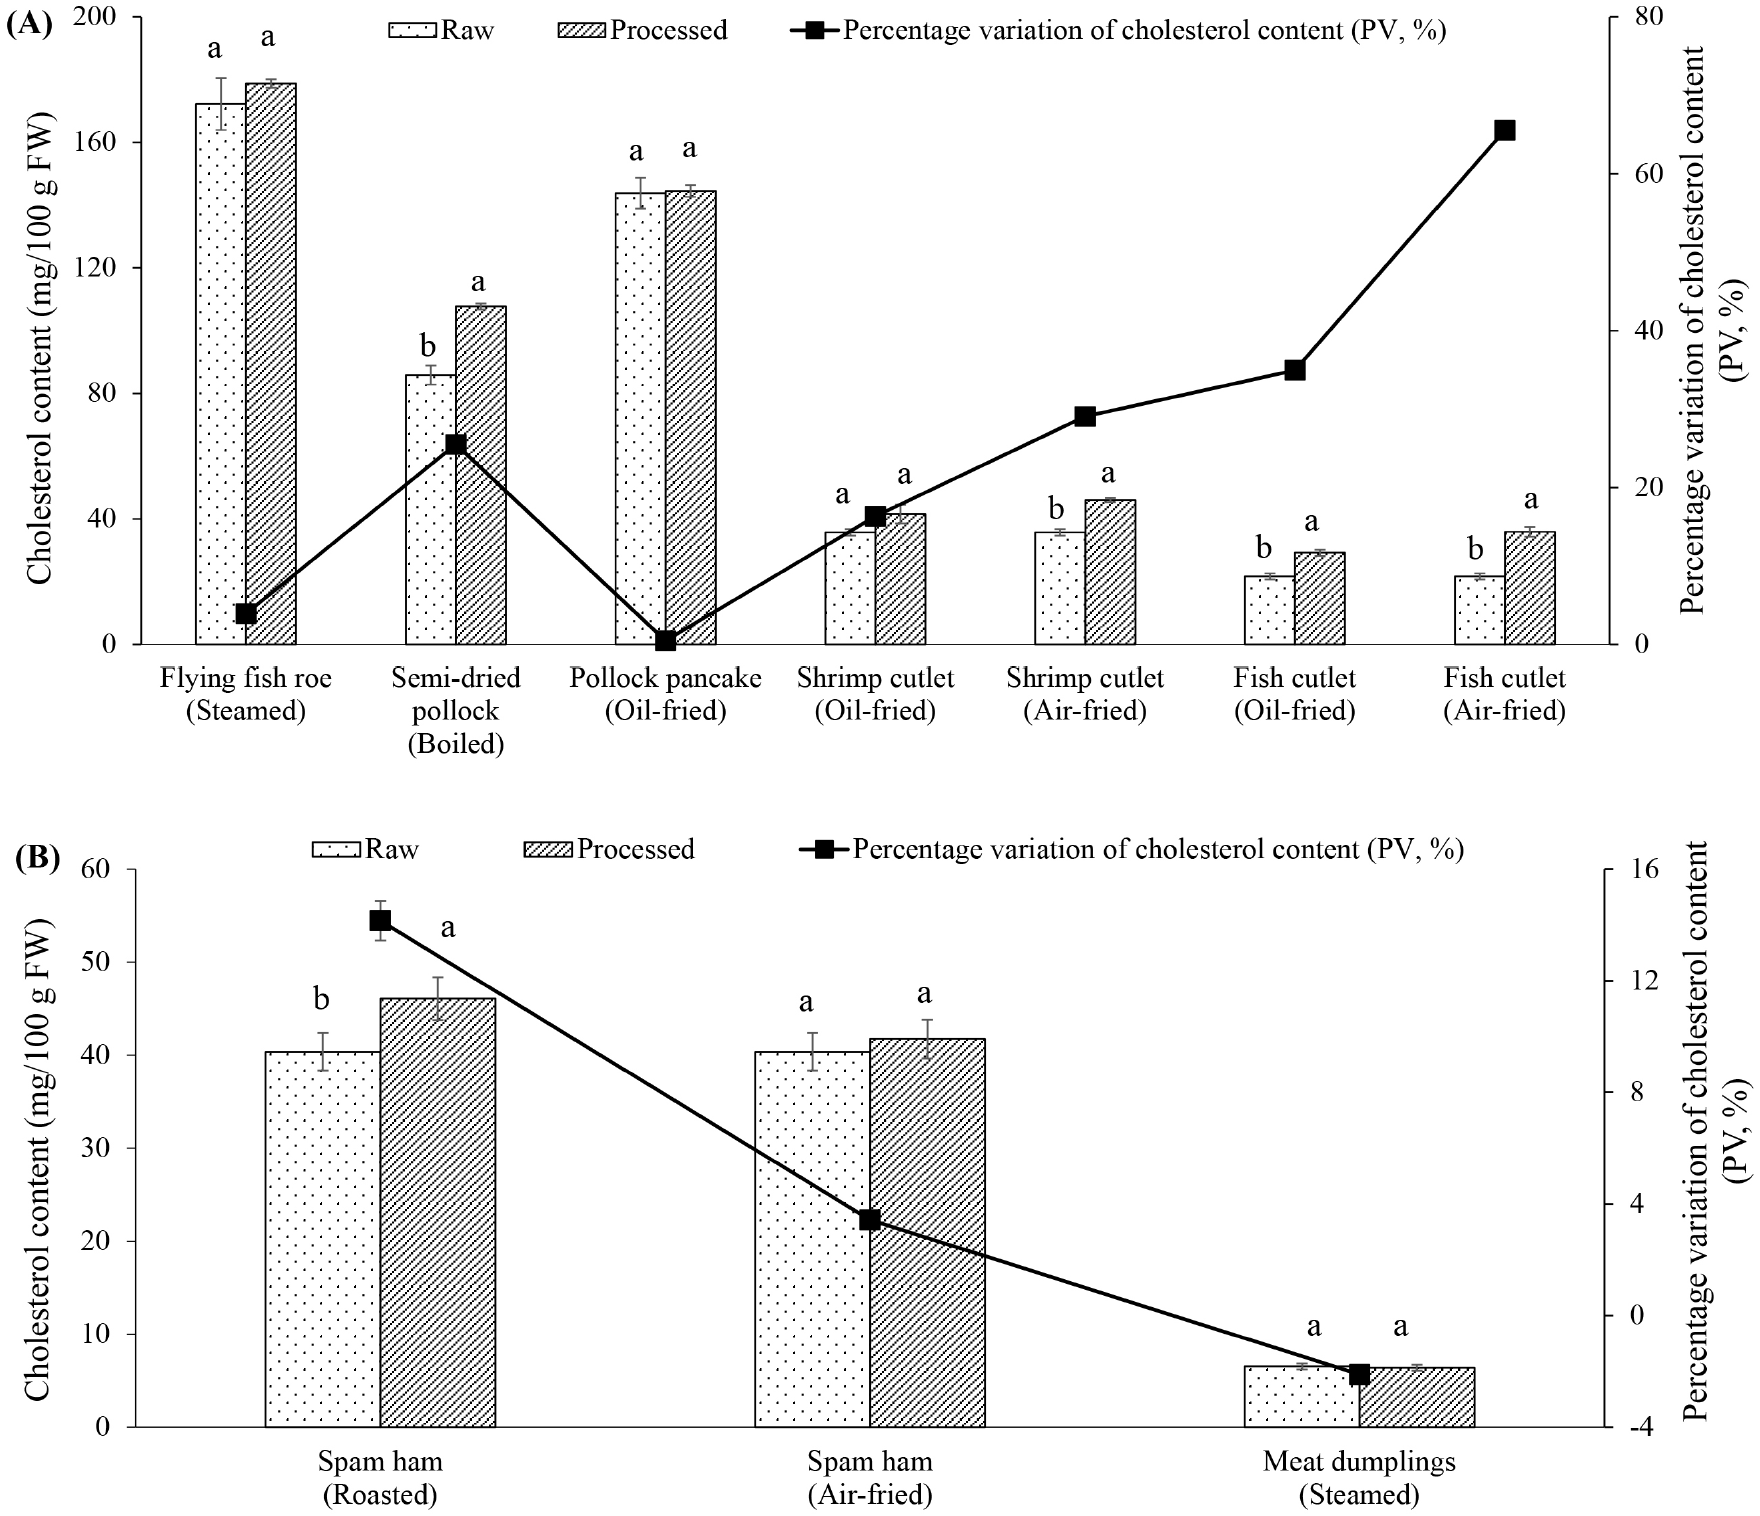
Table 3 summarizes the cholesterol content of the processed meat products (spam ham and meat dumplings), which ranged from 6.39 ± 0.10 to 46.07 ± 0.47 mg/100 g. Among the analyzed products, roasted spam ham had the highest cholesterol content (46.07 ± 0.47 mg/100 g), whereas steamed meat dumplings had the lowest (6.39 ± 0.10 mg/100 g). The corresponding RI values ranged from 2.13 to 15.36%, based on the recommended daily cholesterol limit of 300 mg/day. Compared with raw spam ham, the cholesterol content per 100 g increased by 14.15% after roasting and by 3.43% after air-frying. The observed values were comparable to those reported for cooked ham by Souza and Silva (2006) (33.33-46.53 mg/100 g), but higher than those for dry-cured ham (30-34 mg/100 g) reported by Petrón et al. (2003). Similar cooking-related increases in cholesterol content have been reported in meat products. Lee et al. (2015) observed higher cholesterol contents in chicken meat after roasting, frying, and steaming and attributed these changes mainly to moisture loss and thermal disruption of cellular membranes. Bragagnolo and Rodriguez-Amaya (2003) also reported higher cholesterol contents in grilled Longissimus dorsi beef (67-70 mg/100 g) than in raw samples (40-43 mg/100 g), primarily as a result of moisture loss during grilling. Likewise, Min et al. (2016) reported an increase in cholesterol content in pan-roasted pork loin from 48.85 to 52.66 mg/100 g. In meat dumplings, the difference in cholesterol content per 100 g of sample between the raw and steamed samples was minimal. The changes in cholesterol content and PV (%) for the meat products after cooking are presented in Fig. 3B. Cholesterol content increased from 40.37 to 46.07 mg/100 g after roasting and to 41.73 mg/100 g after air-frying (Table 3). Within-product comparisons showed that the increase was significant only after roasting (p < 0.05), whereas no significant differences were observed between raw and air-fried ham or between raw and steamed meat dumplings (p > 0.05; Fig. 3B).
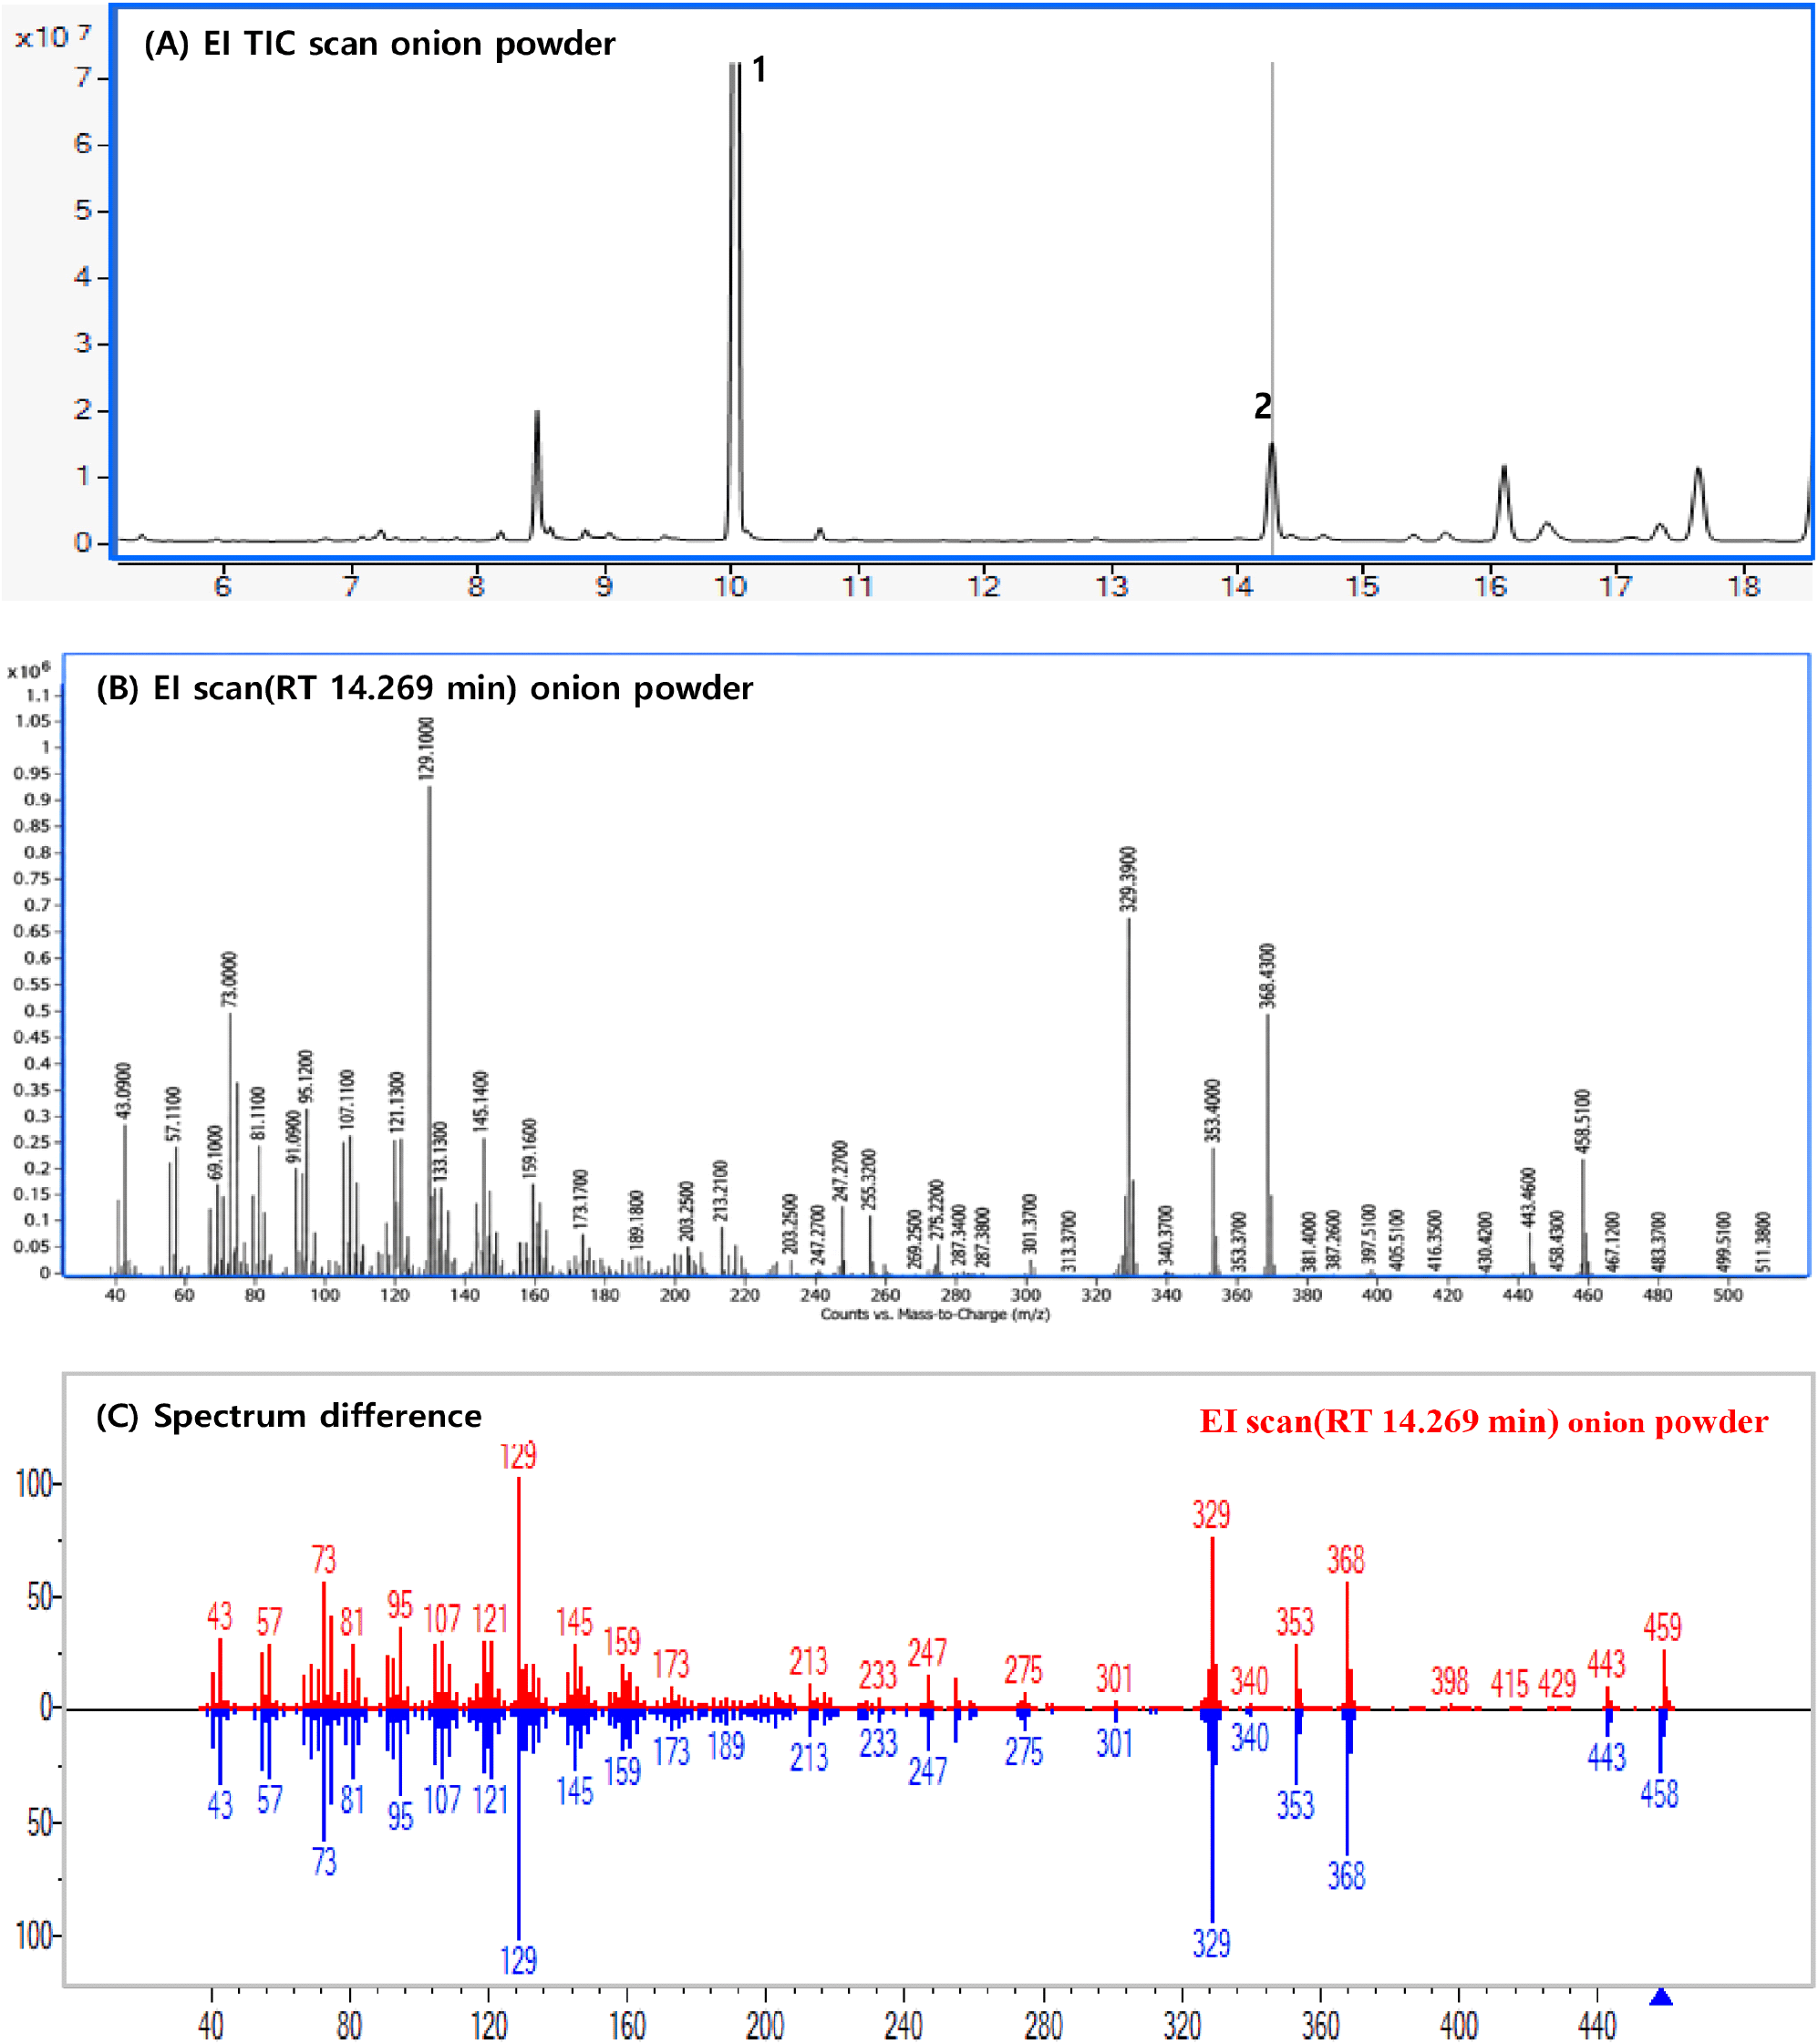
Cholesterol contents were determined in 16 sauce and spice products (tangsuyuk sauce, whole-grain mustard, clam flavor seasoning powder, onion-flavored seasoning, cheese-flavored seasoning, onion powder, oriental dressing, doubanjiang sauce, mala sauce, sriracha sauce, Pad Thai sauce, fish sauce, anchovy sauce, custard powder, cooked custard, and custard cream) and are summarized in Table 4. Among the analyzed products, cheese-flavored seasoning had the highest cholesterol content (34.77 ± 0.07 mg/100 g), followed by onion-flavored seasoning (25.88 ± 0.17 mg/100 g) and anchovy sauce (19.51 ± 1.47 mg/100 g). In contrast, cholesterol was not detected in tangsuyuk sauce, whole-grain mustard, doubanjiang sauce, mala sauce, sriracha sauce, Pad Thai sauce, fish sauce, custard powder, cooked custard, or custard cream (Table 4). These results are consistent with previous reports of no detectable cholesterol in doubanjiang (RDA, 2023), sriracha sauce (MFDS, 2022b), custard powder (USDA, 2017), and whole-grain mustard (USDA, 2019). The onion powder analyzed in this study consisted solely of dehydrated onion, with no other declared ingredients. Therefore, the cholesterol detected at 10.11 ± 0.35 mg/100 g was not attributable to added animal-derived ingredients or cholesterol-containing additives. This finding is consistent with recent evidence reported by Prayitno et al. (2025) of cholesterol occurrence in the genus Allium, although the concentration observed in the present study was lower than the 23.4 mg/100 g dry weight reported for dehydrated onion by LC-APCI-MS/MS. The identity of the trace cholesterol peak in onion powder was further confirmed by GC-MS. In the total ion chromatogram, a minor peak was observed at a retention time of 14.269 min (Fig. 4A), and its EI mass spectrum (Fig. 4B) showed the characteristic ions of the cholesterol TMS derivative, including the molecular ion at m/z 458 and the fragment ions at m/z 368, 329, and 129. A head-to-tail comparison with the reference spectrum of the cholesterol TMS derivative (Fig. 4C) showed close agreement in the m/z values and relative intensities of these ions, confirming that the peak corresponded to cholesterol.
1) RI (%) was calculated as the cholesterol content per 100 g of sample divided by the reference intake of 300 mg/day, multiplied by 100. For onion powder, RI (%) is based on 100 g dry weight.
4. Conclusions
In this study, cholesterol content was determined in 43 processed foods commonly consumed in Korea using a validated GC-FID method. The validated method showed a coefficient of determination (R2) of 0.9994, a recovery of 101.38%, an RSD of 4.00%, and LOD and LOQ values of 0.09 and 0.43 mg/100 g, respectively. Cholesterol content ranged from 7.64 to 339.22 mg/100 g in seafood products and from 6.39 to 46.07 mg/100 g in meat products, and the highest value among sauces and spices was 34.77 mg/100 g in cheese-flavored seasoning. Smoked squid had the highest cholesterol content among all analyzed samples. Cooking altered cholesterol content per 100 g in several products, with fish cutlet showing increases of 34.97% after oil-frying and 65.55% after air-frying relative to the uncooked sample. Cholesterol was also detected at a low concentration in onion powder, consistent with recent reports of cholesterol occurrence in selected Allium species. These results provide validated cholesterol composition data for processed foods and indicate that cholesterol content varies according to food category and cooking method. The data may be useful for updating the Korean Food Composition Database and for dietary intake assessment and nutrition labeling.


