1. Introduction
Ogi is a popular staple that is from the fermentation of either maize (Zea mays), sorghum (Sorghum bicolor) or millet (Pennisetum americum). It contains predominantly carbohydrate (in starch form) and less quantifiable proteins and fat. It is one of the staples in Nigeria and Africa. It has different nomenclatures depending on the country of production, the fluid nature of the material, and the cereal from which it is produced. More than 45 million Nigerians eat it weekly, with or without accompaniment, as convalescent, weaning, breakfast, and dinner meals (Odunlade et al., 2019a).
Despite its high consumption rate, ogi is deficient in essential nutrients such as minerals, proteins, and polyphenols (Odunlade et al., 2016). These deficiencies can cause poor nutrition, which leads to ill health among those who rely excessively on it. These are notably in infants, nursing mothers, and young children who bear the effects of the inception of malnutrition and suffer the greatest risk of disability and death that are often concomitant with it. According to a 2018 Global Food Policy Report, malnutrition remains alarming in Africa and Asia (International Food Policy Research Institute, 2018). Given its widespread consumption, fortifying ogi with nutrient-rich extracts can serve as an effective strategy to address its nutritional limitations. Amaranthus viridis (A. viridis) is a widely cultivated leafy vegetable, known for its high yield and rich nutrient content. It contains vitamins, minerals, fiber, and some protein, while being low in carbohydrates and fat (Fasuyi, 2006). It plays a crucial role in nutritional health, especially in diets lacking diversity or richness in essential nutrients (Mohammed and Sharif, 2011). Its polyphenol content provides antioxidant benefits, which help combat oxidative stress and chronic degenerative diseases (Oboh et al., 2016). A. viridis has been identified as a potential fortificant. It has therapeutic properties (Carminate et al., 2012; Iqbal et al., 2012; Saravanan et al., 2011), but has not been practically applied in ogi or similar staple foods. This study, therefore, presents the first systematic optimization of a polyphenol-rich liquid extract from A. viridis leaves and its incorporation in maize ogi. This is because integrating A. viridis into ogi offers a cost-effective strategy to enhance its nutritional value and combat malnutrition in vulnerable populations. This study also evaluates the resultant products’ nutritional, functional, and sensory properties.
2. Materials and methods
White maize (ART/98/SW05-OB-W) was obtained from the Institute of Agricultural Research and Training, Ibadan, Nigeria. A. viridis plants were obtained from the Research Farms of the Obafemi Awolowo University, Nigeria. Analytical grade chemicals were purchased from Sigma-Aldrich (St. Louis, MO, USA).
The A. viridis leaf extracts were produced following the revised technique of Vuong et al. (2013). Freshly harvested A. viridis leaves were destalked and washed under running water. The destalked leaves were blended at varying concentrations (1:1 to 1:5 (w/v)) with water at 50°C in an electric blender (SAISHO magic blender S-742, China) set at the highest speed for 5-25 min. The resultant mix was filtered through a double-layered cloth filter to obtain A. viridis leaf extract.
The total phenolic content of the extracts at varying times and concentrations was determined using the technique described by Singleton et al. (1999). The extract with the highest total phenolic content based on the variables (leaf-to-water ratio and blending time) was used to fortify maize ogi.
Maize ogi cake was prepared by steeping (maize to water ratio 1:2 (w/v)) sorted and washed maize grains in distilled water in a container and covered for 48 h at 28±2°C. The steeping water was decanted after 48 h. Thereafter, the steeped grains were wet-milled and sieved with a thin cloth filter. The residue was discarded while the filtrate was allowed to undergo natural sedimentation under gravity for 5 h. The sediment was poured into a cloth filter, tied, and pressed lightly under a hydraulic press for 2 h to form maize ogi cake.
The liquid extract of A. viridis leaves (20, 40, 60, 80, and 100 mL) was added proportionately to 100 g dewatered maize ogi through a binary mixture design before hot-air drying in a laboratory oven at 60°C for 8 h. The resultant dried fortified maize ogi was milled into fine powder and packed in an airtight Ziploc® bag and then stored in a refrigerated storage before further analyses.
The proximate and mineral (magnesium, calcium, potassium, iron, and zinc) compositions of the fortified samples were assayed using AOAC (2015) methods.
Amylose contents of the samples were determined using the method of Nwokocha and Ogunmola (2014).
Swelling capacity was evaluated using a modified version of the Adebooye and Singh (2008) method.
The paste clarity was assessed using a modified Nand et al. (2008) approach that involved measuring light transmittance (%). In screwcap centrifuge tubes, the samples were suspended in distilled water to obtain a 1 percent (w/v) aqueous suspension. For 30 minutes, the tubes were heated in a boiling water bath. Using an SP-UV-752S UV-Visible spectrophotometer (Ningbo Biocotek Scientific Instrument Co., Ningbo, China), the percentage transmittance (%T) at 650 nm was measured against water as a blank after cooling to ambient temperature.
The samples’ syneresis was assayed using the method provided by Singh et al. (2004). Suspension (10% (w/v)) was heated at 85°C for 30 min in a water bath and cooled in an ice-water bath until 25°C. The samples were further kept at 4°C for 24, 48, 72, 96, and 120 h. After freezing, the samples were thawed and equilibrated in a 40°C water bath for 1.5 h. The proportion of water released after centrifuging at 1,500 ×g for 30 minutes was used to determine syneresis.
The pasting characteristics of the samples were determined using a Rapid Visco-Analyzer (RVA) (Newport Scientific Pty Ltd., Narrabeen, Australia) according to the technique reported by Odunlade et al. (2019b). For all parameters except pasting temperature (°C) and pasting time (min), the findings were represented as Rapid Visco Unit (RVU).
The health research ethics approval was obtained from the Obafemi Awolowo University (IPHOAU/12/840) for the conduct of the organoleptic assessment of the samples. Fifty grams of each maize ogi flour sample was made into a suspension in 80 mL of cold water, and about 500 mL of boiling water was added thereafter until a viscous porridge was formed. The resulting porridge was served hot to twenty sensory panellists who are accustomed to maize ogi. Panelists rated the samples based on their preference for some quality attributes on a 9-point hedonic scale.
Significant differences were determined using a one-way Analysis of Variance procedure, where post-hoc tests using Duncan’s multiple range test were used for separating the differences in the treatment means at a 95% confidence level (Gbadegesin et al., 2017).
3. Results and discussion
The results for the total phenolic content of the liquid extract of A. viridis leaf are presented in Table 1. The amount of the total phenolic content (TPC) of the leaf extracts obtained with varying leaf-to-water ratios and blending time was used as a means of determining the optimal concentration and time variables for subsequent extract production. The liquid extracts obtained from a leaf-to-water ratio of 1:2 (w/v) recorded the highest TPC of 221.72, 244.30, 244.58, 244.82, and 245.66 mg GAE/mL at blending times of 5, 10, 15, 20, and 25 min, respectively. It was observed that the TPCs of all the samples at each blending time were statistically significantly different (p<0.05) from one another.
The TPCs of the liquid extracts obtained from a leaf-to-water ratio of 1:3 to 1:5 w/v reduced significantly with an increase in volume of the extracting solution. The phenolics from the leaves may have reached a leaching peak at a concentration of 1:2 (w/v). This decrease is traceable to the higher dilution factor used at these levels (1:3 to 1:5 (w/v)). An increase in extractant liquid would also cause a reduction in the strength of the total phenolic content. An increase in blending times from 5 to 25 min significantly increased (p<0.05) the TPCs of the liquid extracts. However, there were marginal and non-economic increases for the TPCs recorded for blending times of 15, 20, and 25 min in terms of energy and labor requirements. For example, the percentage increases for the TPCs for leaf-to-water ratio of 1:1 (w/v) to 1:2 (w/v) from 10 to 25 min were merely 0.72 and 0.55%, respectively, thus making the extra time for blending expensive from an energy and labor point of view. Therefore, the blending time of 10 min was the optimal condition.
Among the leaf-to-water ratios, the TPCs of leaf-to-water at 1:2 (w/v) were the highest. Thus, the optimal mix for A. viridis extract production is 1:2 (w/v) for 10 min. The presented results in this study for TPC of A. viridis liquid extracts are comparable with the studies of Salvamani et al. (2016) and Kumari et al. (2018), who reported high TPC for A. viridis extract. The results were also comparable to 292.65, 287.73, and 216.96 mg GAE/g reported for extracts of the edible leaves of Alternanthera sessilis, Cassia tora, and Portulaca oleracea, respectively (Aryal et al., 2019).
The protein contents of the fortified maize ogi samples produced by drying the mix of 100 g maize ogi cake and 20, 40, 60, 80, and 100 mL of A. viridis liquid extract (8.15 to 10.64%) increased and differed significantly (p <0.05) with the incorporation of A. viridis liquid extract (Table 2). Inclusion of A. viridis liquid extracts increased the protein contents of the samples by an increase threshold as high as 30%. This is because the drying of the mix of ogi cake and the liquid extract would have increased the solid content, thus increasing the protein content. Okoye and Egbujie (2018), Ukeyima et al. (2019), and Ukom et al. (2019) similarly observed the increase in proteins for several maize-based complementary foods. The fortified samples are fair sources of proteins and relate well to the protein content of 11% for white oats (Chepulis et al., 2017).
1) Control, 100% maize ogi flour; 20 mL E, 20 mL A. viridis extract fortified maize ogi flour; 40 mL E, 40 mL A. viridis extract fortified maize ogi flour; 60 mL E, 60 mL A. viridis extract fortified maize ogi flour; 80 mL E, 80 mL A. viridis extract fortified maize ogi flour; 100 mL E, 100 mL A. viridis extract fortified maize ogi flour.
Fat contents of the samples ranged between 1.82 and 2.23% with percentage decreases of 0.45 to 22.53%. Samples fortified with extracts recorded lower fat than the control samples. This fat reduction would probably promote shelf life because the product will last longer by not oxidizing easily. Low fat in the fortified samples suggests that the liquid extract had little fat content, so as the liquid extract volume increased, the total solid content of the fat became more diffused, hence the reduced values. Ogori et al. (2020) similarly reported a trend observed for fat in Acha-Tamba-based maize ogi samples.
Ash contents ranged from 1.73 to 3.15%. The ash contents increased significantly (p<0.05) with the inclusion of A. viridis liquid extract. Observed increase can be linked to the higher concentration of ash in A. viridis leaves because vegetables are significant sources of minerals (Odunlade et al., 2017; Peter and Gandhi, 2017; Sharma et al., 2012). The ash contents reported in this study compare well with the reported ash contents (1.67 to 3.10%) by Abioye and Aka (2015) and Inyang et al. (2019) for fortified maize ogi samples. The fiber contents showed a statistically significant (p<0.05) increase with the addition of A. viridis liquid extract. The filtration process during the production of A. viridis leaf extract might have brought a significant reduction in the quantity of the fiber because A. viridis, like other leafy vegetables, is a considerable source of fibre (Sarker and Oba, 2019), thereby reducing the contributory effect of the extract in terms of fiber. Abioye and Aka (2015), Odunlade et al. (2019b), and Ukeyima et al. (2019) also documented an increase in fiber for fortified ogi samples.
Carbohydrate contents of the samples ranged from 75.09 to 78.81%. The values significantly reduced with the incorporation of A. viridis leaf liquid extract into maize ogi. This could be because of the entirely watery nature of the liquid extracts before drying the mixture to powder with no significant carbohydrate content. Fresh leafy vegetables are not substantial sources of carbohydrate because of their relatively high moisture content (Sarker and Oba, 2019).
The moisture contents of the samples ranged between 8.13 and 8.28%. The values obtained for the samples have low moisture contents and are far less than the recommended cap of 10% moisture (Makinde and Ladipo, 2012; Odunlade et al., 2019b) for food powders for enhancement of shelf stability.
Table 3 shows the mineral compositions of the samples. The magnesium contents of the samples varied between 97.90 and 143.43 mg/100 g. Noticeable differences (p<0.05) existed among the samples. The incorporation of A. viridis liquid extract led to an increase in the magnesium contents of the fortified samples. The presence of magnesium in the A. viridis leaves, most especially the green pigments of the leaves with characteristic magnesium in the centre of the structure of chlorophylls, might be responsible for the increase. A. viridis leaves and leafy vegetables are abundant in mineral elements. The increase in the magnesium content because of the inclusion of A. viridis extract ranged between 2.30 and 46.51% for 20 to 100 mL dried mix of A. viridis leaf extract fortified maize ogi samples. This suggests that the fortified samples would readily supply the recommended dietary allowance of 350 mg/d (Institute of Medicine, 1997) at 300 g.
1) Control, 100% maize ogi flour; 20 mL E, 20 mL A. viridis extract fortified maize ogi flour; 40 mL E, 40 mL A. viridis extract fortified maize ogi flour; 60 mL E, 60 mL A. viridis extract fortified maize ogi flour; 80 mL E, 80 mL A. viridis extract fortified maize ogi flour; 100 mL E, 100 mL A. viridis extract fortified maize ogi flour.
Calcium of the samples varied between 12.39 and 58.85 mg/100 g. This depicted an increase of about 48 to 375% for maize ogi fortified with 20 and 100 mL A. viridis leaf extracts. All the fortified samples can serve as complementary sources of calcium for infants, young children, and adults (CODEX, 1991). The zinc significantly varied (p<0.05) between 0.71 and 1.76 mg/100 g. This depicted an increase of about 4.23 to 147.89%. All the fortified samples exhibited considerable differences for zinc and thus complementary sources of zinc in the diets. Zinc is one of the essential micronutrients that assists in protein formation, wound healing, and boosting of human immune system (Odunlade et al., 2019b).
Iron of the samples ranged between 29.37 and 70.65 mg/100 g. Significant differences (p<0.05) exist among the samples with respect to fortification, which depicted increases of about 24 to 141% for samples fortified with 20 mL and 100 mL A. viridis leaf extracts, respectively. The observed increase can be linked to the richness of A. viridis leaves in mineral elements. All the fortified samples can adequately meet the recommended dietary allowance of 27 mg for pregnant mothers (CODEX, 1991) if just 100 g of any of the samples is taken. Iron is largely essential for preventing abnormal cognitive and neuro-psychomotor development. It is essential for the synthesis of erythrocytes (Odunlade et al., 2019b).
Potassium of the maize ogi samples varied between 59.33 and 108.42 mg/100 g. Notable differences (p<0.05) existed between the samples. The addition of A. viridis leaf extract increased the quantity of potassium in the fortified samples. An increase in the evaluated mineral elements was also noted by Abioye and Aka (2015), Oladeji et al. (2017), Okafor et al. (2018), Inyang et al. (2019), and Ukom et al. (2019) for fortified maize ogi samples.
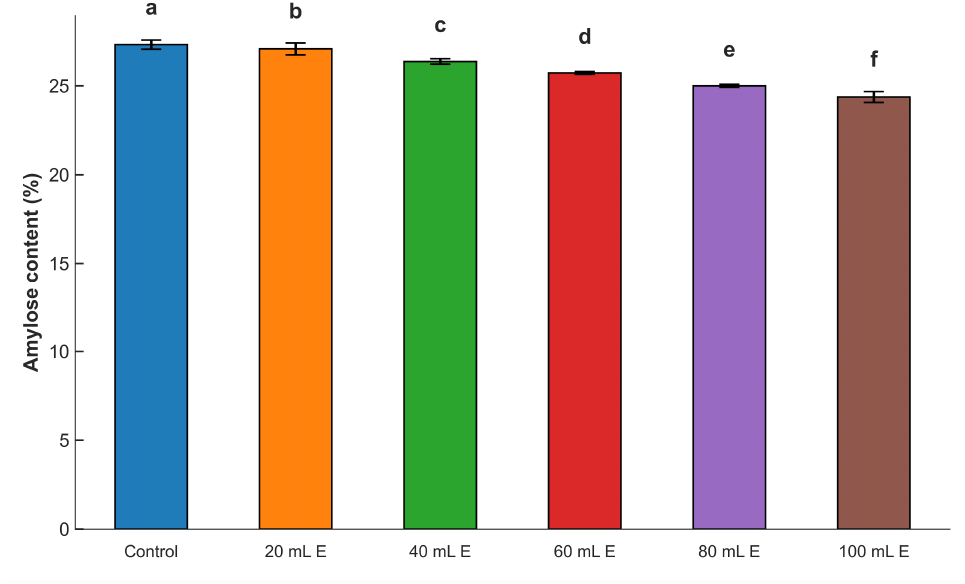
The percent amylose contents (Fig. 1) of the maize ogi samples fortified with A. viridis leaf extract varied between 24.40 and 27.31%. The control samples had the highest amylose content, while the samples fortified with 100 mL A. viridis leaf extract had the lowest. The amylose content of the samples was reduced with the inclusion of the A. viridis leaf extract. This could be because of varying amylose contents, which are largely a component of starch (carbohydrate) in the two base materials. Maize ogi is typically a carbohydrate-based food, whereas A. viridis extract is low in carbohydrates, as shown in Table 2. The amylose contents of the fortified samples were comparable to 26.34 to 27.45% reported for rice ogi by Akintayo et al. (2020). The amylose contents reported in this work are within the 21.20 to 30.20 range established for a named cereal-sorghum by Abah et al. (2020). Contrastively, it was lower than the 29 to 34% reported by Osungbaro (1990) for maize varieties. The slight differences in the values of the amylose contents may be associated with differences in variety, type of cereals, soaking period, sample moisture, and overall processing methods (Akintayo et al., 2020).
The swelling indices of the samples decreased (Fig. 2) with an increase in the levels of A. viridis liquid extract added. This implies that the hydrophilic tendencies of the starch (Aviara et al., 2010) decreased with an increase in fortification level, as shown by the reduction in carbohydrates of the fortified samples. In addition, a proportionate increase in proteins in some of the samples could probably interfere with the swelling behavior of the fortified samples. Hartati et al. (2020) reported that changes in other food macromolecules could influence the swelling properties of the food samples. The dominant food macromolecule in food powders is probably tends to be largely responsible for the swelling behavior of such food powders. The swelling indices of all the samples increased with an increase in temperature from 30 to 90°C. The swelling index of the control sample was the highest among the samples across all the evaluated temperatures. Swelling of all the samples was not pronounced at temperatures between 30 and 60°C, but a rapid increase in swelling of all the samples occurred at higher temperatures (>60°C). This is an indication that more starch granules swelled because of the impact of temperature and water molecules on the glucan chain of the starch granules, leading to a probable relaxation of starch crystalline structure (Hartati et al., 2020). The results showed that gelatinization for the samples took place at greater than 60°C.
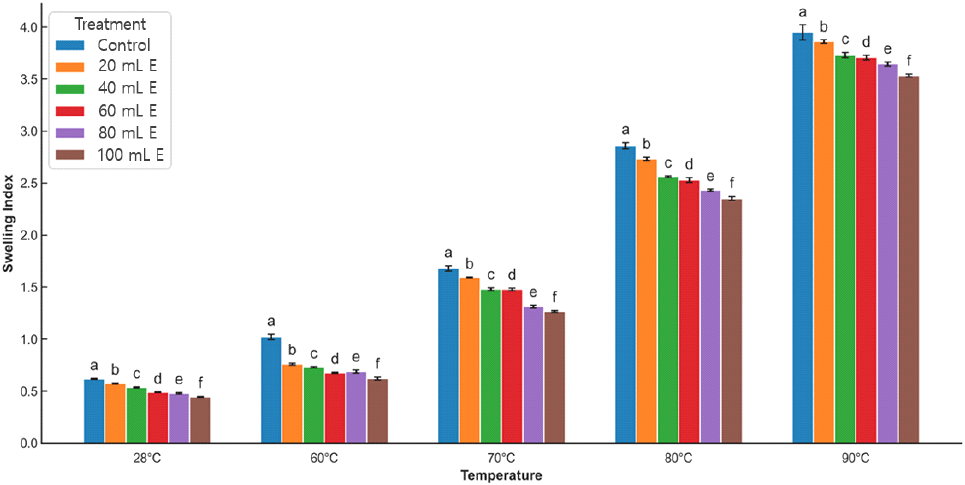
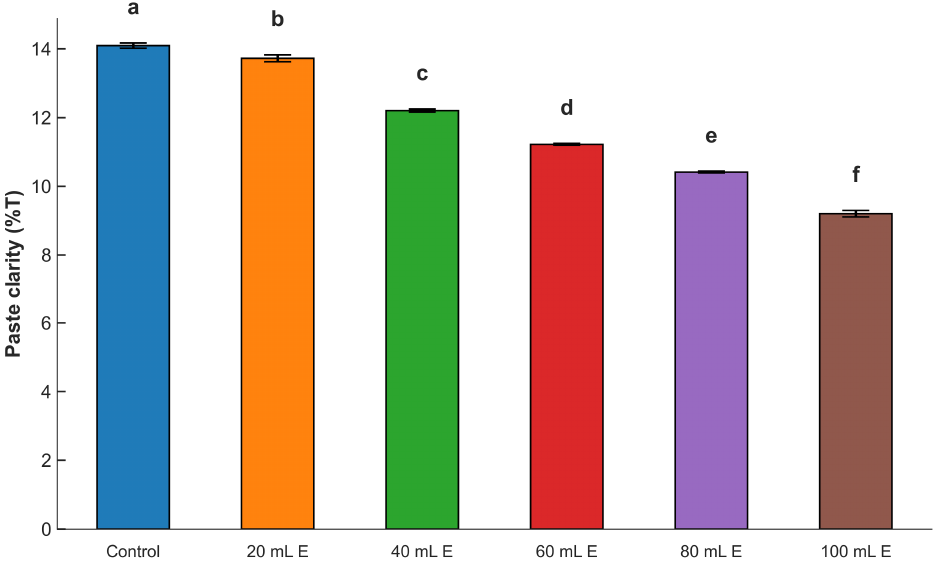
Fig. 3 shows the paste clarity of the dried mix of maize ogi cake fortified with A. viridis leaf extract. The values varied between 9.23 and 14.11%. From the results, the clarity of the samples was reduced with the inclusion of A. viridis leaf extract. The inclusion of the colloidal leaf extract in the maize ogi samples must have interfered with the clarity of the resultant fortified maize ogi because suspended solids and color from the A. viridis leaf extract must have affected the degree of clarity of the paste. The clarity reduction may also be associated with the variation in the amylose contents and non-carbohydrate substances of the fortified products. The presence of non-carbohydrate substances leading to structural reorganization of the molecules because of probable complexes formed, as well as the swelling behavior, might also be responsible. These factors were also reported by Ulbrich et al. (2020), Almeida et al. (2020), Oyeyinka et al. (2020), and Mehfooz et al. (2020) for the paste clarity of starches of corn, prata banana, cassava, and hydroxypropylated-distarch phosphate barley, respectively.
The syneresis of all the samples increased as the time of storage increased (Fig. 4). The inclusion of A. viridis leaf extract caused a reduction in the syneresis of the samples. The increase in syneresis over the storage period is due to probable reactions between amylose and amylopectin with the potential for the establishment of active functional sites (Ali et al., 2016). Also, when starch gel is stored, either frozen or refrigerated, there is a gradual increase in rigidity as crystallites begin to form, leading to phase separation between starch polymers and water (Karim et al., 2000). In addition, the presence of non-starch components can also be a source of significant influence on syneresis (Alcázar-Alay and Meireles, 2015).
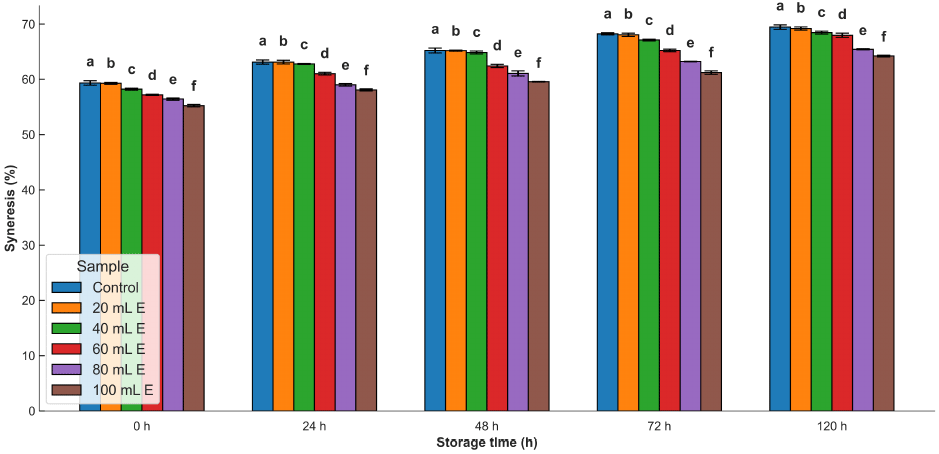
Table 4 shows the pasting properties of maize ogi samples. All the pasting viscosities decreased with an increase in the added A. viridis leaf extract. The reduction could be associated with the purity levels of the starch content, gelling properties, presence, and interaction of nutritional components of the fortified maize ogi samples. It is probable that the sample matrix of the fortified samples altered because of the incorporation of the A. viridis extract, which added suspended solids. Odunlade et al. (2019b) and Ezeocha et al. (2020) observed a reduction in pasting viscosities with fortification of ogi samples.
1) Control, 100% maize ogi flour; 20 mL E, 20 mL A. viridis extract fortified maize ogi flour; 40 mL E, 40 mL A. viridis extract fortified maize ogi flour; 60 mL E, 60 mL A. viridis extract fortified maize ogi flour; 80 mL E, 80 mL A. viridis extract fortified maize ogi flour; 100 mL E, 100 mL A. viridis extract fortified maize ogi flour.
The peak times of the samples also varied between 4.55 and 5.11 min with fortification. The measure of the cooking time of the paste decreased with the inclusion of the A. viridis extract. The pasting temperatures, however, increased from 72.60 to 78.87°C with the inclusion of A. viridis extract. The increase in pasting temperatures could affect the peak times of the samples because processing times are often affected by processing temperatures.
Table 5 shows the mean sensory scores of the samples. All the sensory quality attributes (taste, color, flavor, mouthfeel, appearance, and acceptance) were reduced with fortification. The taste became less sour owing to the inclusion of the extracts. Based on overall acceptability, the fortified maize ogi samples were preferred up to 80 mL inclusion of A. viridis leaf extract.
1) Control, 100% maize ogi flour; 20 mL E, 20 mL A. viridis extract fortified maize ogi flour; 40 mL E, 40 mL A. viridis extract fortified maize ogi flour; 60 mL E, 60 mL A. viridis extract fortified maize ogi flour; 80 mL E, 80 mL A. viridis extract fortified maize ogi flour; 100 mL E, 100 mL A. viridis extract fortified maize ogi flour.
4. Conclusions
The optimal condition for the production of A. viridis leaf extract for high phenolic content is a leaf-to-water ratio of 1:2 (w/v) and a blending time of 10 min at 50°C. The amylose, paste clarity, pasting viscosities, syneresis, and swelling of the samples were reduced with fortification. The fortified samples were preferred up to an 80 mL addition of leaf extract to maize ogi by panelists. The protein, ash, and mineral elements improved with fortification. A limitation of this study is the absence of microbial stability data and long-term consumer testing. Further studies should therefore investigate the bioavailability of the enhanced nutrients post-processing, as well as scale-up trials for industrial application.