


1. Introduction
Hemp (Cannabis sativa L.), an annual herbaceous plant, has long been valued in various industries, including food, fiber, and pharmaceuticals (Schluttenhofer and Yuan, 2017). Hemp protein isolate (HPI), derived from hemp seeds, is gaining recognition for its high nutritional quality and its potential as a plant-based protein source for a wide range of food applications (Schluttenhofer and Yuan, 2017). With the increasing popularity of plant-based diets and growing awareness of the environmental benefits associated with reducing animal-based protein consumption, the demand for alternative proteins is on the rise. Despite its nutritional advantages, HPI faces functional challenges in food applications, particularly due to its low solubility. These limitations are largely attributed to the molecular structure of hemp protein, which contains hydrophobic regions and disulfide bonds that promote aggregation in aqueous environments (Eckhardt et al., 2024). Therefore, improving the functional properties of HPI is crucial to enhance its potential use in the food industry.
One promising approach for enhancing the functionality of plant-based proteins is enzymatic hydrolysis. This process involves the use of specific enzymes to break down protein chains, resulting in shorter peptides and amino acids that modify the protein’s structural and functional properties. Enzymatic hydrolysis has been widely used to improve solubility, reduce allergenicity, and enhance the bioavailability of plant-based proteins (Korkmaz and Tokur, 2022). By altering the protein’s molecular structure, this process can significantly increase solubility, thereby enabling its use in various functional food formulations (Cui et al., 2021). Alcalase, an endopeptidase, is particularly effective in protein hydrolysis, selectively cleaving internal peptide bonds to induce a broad range of protein degradation (Tacias-Pascacio et al., 2020). Due to its high substrate specificity and efficiency, Alcalase is well-suited for rapidly altering protein structures to improve solubility. However, the effects of enzymatic hydrolysis are complex, as they depend on multiple factors, including enzyme type, hydrolysis time, pH, and temperature (Opazo-Navarrete et al., 2022). The successful enhancement of functional properties through enzymatic hydrolysis depends on the careful optimization of several variables. Response surface methodology (RSM) offers a statistically robust approach for optimizing complex processes that can be employed to systematically evaluate and optimize these factors, maximizing the benefits of hydrolysis while preserving protein integrity and nutritional quality.
RSM is a mathematical and statistical tool used to model and analyze the effects of multiple variables and their interactions on a given response (Korkmaz and Tokur, 2022). Additionally, RSM allows for a reduction in the number of experimental trials needed to achieve optimal results, which is particularly advantageous in food research, where resource constraints and time efficiency are often critical considerations. In this context, RSM enables a systematic investigation of how factors such as enzyme concentration, reaction time, and pH influence the solubility and functional properties of protein. Through RSM, it is possible to identify the optimal conditions for hydrolysis, thus maximizing the solubility of HPI and enhancing its utility in food formulations.
Previous studies have shown that enzymatic hydrolysis improves the solubility of hemp seed protein; however, there is a lack of research focusing on the optimization of this process. This study aims to investigate the effects of enzymatic hydrolysis parameters on the solubility of HPI using RSM to evaluate parameter interactions systematically. The optimized hydrolysis conditions determined through RSM will be applied to assess the degree of hydrolysis, antioxidant activity, and structural modifications via FTIR spectroscopy. Additionally, the optimized hydrolysate will be incorporated into a functional beverage to evaluate its appearance and color stability. The outcomes of this study are expected to enhance the functional properties of HPI, facilitating its application in nutritionally fortified, plant-based food products. This research contributes to the diversification of sustainable protein sources in the food industry while supporting the development of functional food ingredients with improved solubility and bioactivity.
2. Materials and Methods
Hempseed protein isolate (HPI, 85% purity) was obtained from Braham & Murray Good Hemp Co. (Barnstaple, England). Alcalase 2.4L FG and other chemical reagents were obtained from Novozymes (Basvaerd, Denmark) and Sigma-Aldrich Co. (St Louis, MO, USA), respectively.
To establish the preliminary range of enzyme processing variables, the impact of varying a single factor on the solubility of enzyme-modified HPI was investigated. The enzyme hydrolysis of HPI with Alcalase was carried out following the method described by Tang et al. (2009). Experiments were conducted with different hydrolysis times (60-300 min), enzyme concentrations (0.5-4.5 mg/mL), pH levels (7.0-9.0), and substrate concentrations (0.01-0.09 g/mL) as shown in Table S1. The initial treatment conditions for each variable are as follows Enzyme concentration: 2.5 mg/mL, pH: 8.5, substrate concentration: 0.05 g/mL. The level that yielded the highest solubility obtained in each experiment was fixed as the optimal value and proceeded to the next experiment. A solution of HPI was prepared with distilled water, and alcalase 2.4 L FG was added to the solution. The pH of the protein-enzyme mixture was maintained throughout the hydrolysis process. After the incubation time, the enzyme was inactivated by heating the mixture at 90°C for 10 min, and the reaction was halted by rapid cooling. The pH of the cooled enzyme digest was adjusted to 7.0. The mixture was centrifuged at 6,000 rpm for 20 min to remove undissolved residues. The resulting supernatant was freeze-dried to obtain the hydrolysate.
The determination of protein solubility was conducted following the method outlined by Han et al. (2024) with minor modifications. HPIs were dissolved in distilled water at a concentration of 1% (w/v) and mixed for 30 min to ensure complete hydration. The solution was then centrifuged at 4,000 ×g for 10 min to separate the supernatant. The concentration of protein in the supernatant was quantified using the Lowry (1951) method. Each condition was tested in triplicate to ensure reliability of the results.
The optimization of HPI’s enzymatic treatment modification conditions was designed using a RSM using a central composite design (CCD) that included three dependent variables (time, enzyme concentration, and pH) across five levels. The CCD matrix consisted of 8 factorial points, 3 central points, and 6 axis points, leading to a total of 17 experimental runs. The response variables were hydrolysis time (120-240 min), enzyme concentration (0.5-2.5 mg/mL), and pH (7.0-9.0 min), all encoded using five levels (Table S2). Statistical Analysis System (SAS) software (version 9.2, SAS Institute, Cary, NC, USA) was utilized to derive the following empirical second-order polynomial formula
where Y represents the dependent variable, and β0, βi, βii, and βij denote regression coefficients for intercept, linear, quadratic, and interaction terms, respectively. The suitability of the polynomial model formula was assessed using analysis of variance (ANOVA) to examine the lack of fit and the coefficient of determination (R2). Four-dimensional graphs were plotted with Statistical Analysis System (SAS) software (version 9.2, SAS Institute Inc., Cary, NC, USA).
The degree of hydrolysis (DH) was calculated by the o-phthaldialdehyde (OPA) method as explained by Lu et al. (2021). A sample solution was prepared by mixing 400 μL of the HPI solution with 3 mL of OPA reagent in distilled water and allowing the mixture to react for 2 min. The optical density (OD) of the resulting solution was measured at 340 nm using UV spectrophotometer (UV-2550, Shimadzu, Kyoto, Japan), with distilled water serving as the blank. The extent of hydrolysis was calculated using the following formula:
where serine-NH2 represents the mass equivalent (meqv) of serine NH2 per gram of protein, ODsample and ODstandard are the absorbances of the sample and the serine standard, respectively. The variable c denotes the protein content (g/L), and d is the dilution factor of the sample solution.
h indicates the number of hydrolyzed peptide bonds, while, ht represents the total number of peptide bonds in the protein substrate (meqv/g protein).
The sample solution was prepared by diluting HPI with 70 % ethanol at a concentration of 0.1 g/mL. The sample solutions were shaken in a shaking incubator (SI-600R, JeioTech, Daejeon, Korea) at 25°C, 200 rpm, for 20 h to extract the bioactive compounds. The supernatant was separated using centrifuge at 4,000 ×g for 10 min to prepare the extract. ABTS free radical scavenging activity was investigated according to the method described by Re et al. (1999) with slight modification. The 950 μL of ABTS solution (7 mM ABTS) and 50 μL of extract solution were mixed and incubated at room temperature on the dark for 30 min. The absorbance of the sample was measured at 734 nm using UV spectrophotometer (UV-2550, Shimadzu, Kyoto, Japan), with ethanol as the blank. The ABTS (%) was calculated as follows:
Where Ablank and Asample are the absorbance values of the blank and sample, respectively.
FT-IR was used to investigate the chemical structure of HPI. The modified HPIs were combined and ground with potassium bromide (KBr) in a 1:200 ratio, then applied to an attenuated total reflectance (ATR) accessory. Infrared spectra were obtained using FT-IR spectrophotometer (Frontier, PerkinElmer, Shelton, WA, USA) with a resolution of 4 cm−1 over a frequency range of 4,000 to 400 cm−1 (Said et al., 2023).
HPI beverages were formulated as detailed in Table S3. The beverage was prepared by mixing 9.5 g of HPI, and 3.5 g of sugar with 100 mL of almond milk for 5 min.
The color of the beverages was evaluated over time using a chroma meter (CR 300, Minolta, Osaka, Japan) as described in You et al. (2018). Prior to each measurement, the colorimeter was calibrated with a standard plate (CR-300) having values of L*=93.80, a*=0.3130, and b*=0.3191. The measurements were expressed as Hunter values: L* (lightness), a* (redness), and b* (yellowness). Samples were collected by decanting the supernatant of the beverage, and measurements were taken at 30-min intervals over a 3-h period. Each measurement was performed five times to ensure accuracy and consistency. The color change (ΔE) was determined as the difference in color immediately after manufacture and over time, and was calculated from the values of L*, a*, and b* using the following formula:
where L0, a0 and b0 represent the color average values immediately after the beverage is prepared, and Lt, at and bt denote the color values of the beverage after t h.
All results are presented as the mean of at least three measurements, with error values expressed as the standard deviation of the mean. Duncan’s multiple range test (p<0.05) was performed using SPSS Software (v. 17.0, Chicago, IL, USA). Additionally, the SAS software (version 9.2, SAS Institute, Cary, NC, USA) was utilized to generate predictive models, calculate regression coefficients, and the resulting model equations were represented as three-dimensional graphs and two-dimensional contour plots using SigmaPlot software (v. 15.0, San Jose, CA, USA).
3. Results and discussion
To optimize solubility, a preliminary screening was conducted to evaluate the effects of individual factors, including treatment time, enzyme concentration, pH, and substrate concentration.
Fig. 1A illustrates the impact of hydrolysis time on HPI solubility, where enzymatic treatment was performed at 60, 120, 180, 240, and 300 min while maintaining an enzyme concentration of 2.5 mg/mL, pH 8.5, and a substrate concentration of 0.05 g/mL. Solubility increased steadily from 60 to 180 min due to peptide bond cleavage, which led to the exposure of hydrophilic groups and a reduction in molecular weight. The increased surface charge from hydrolysis weakened protein-protein interactions, reducing aggregation and enhancing water-binding capacity, thereby improving solubility (Cui et al., 2021; Lei et al., 2021). However, beyond 180 min, solubility declined, likely due to the formation of insoluble aggregates caused by extensive hydrolysis. The exposure of hydrophobic amino acids promoted hydrophobic interactions and secondary aggregation, which impeded solubility (Opazo-Navarrete et al., 2022). Furthermore, excessive hydrolysis may cause the polypeptides and amino acids produced during hydrolysis to aggregate through hydrophobic interactions, potentially leading to the formation of disulfide bonds and resulting in decreased solubility (Lyu et al., 2023). This observation is in agreement with the findings of Cingöz and Yildirim (2023), who reported that protein solubility initially increases and then decreases with hydrolysis. Consequently, a treatment time of 180 min was determined to be optimal for maximizing solubility.
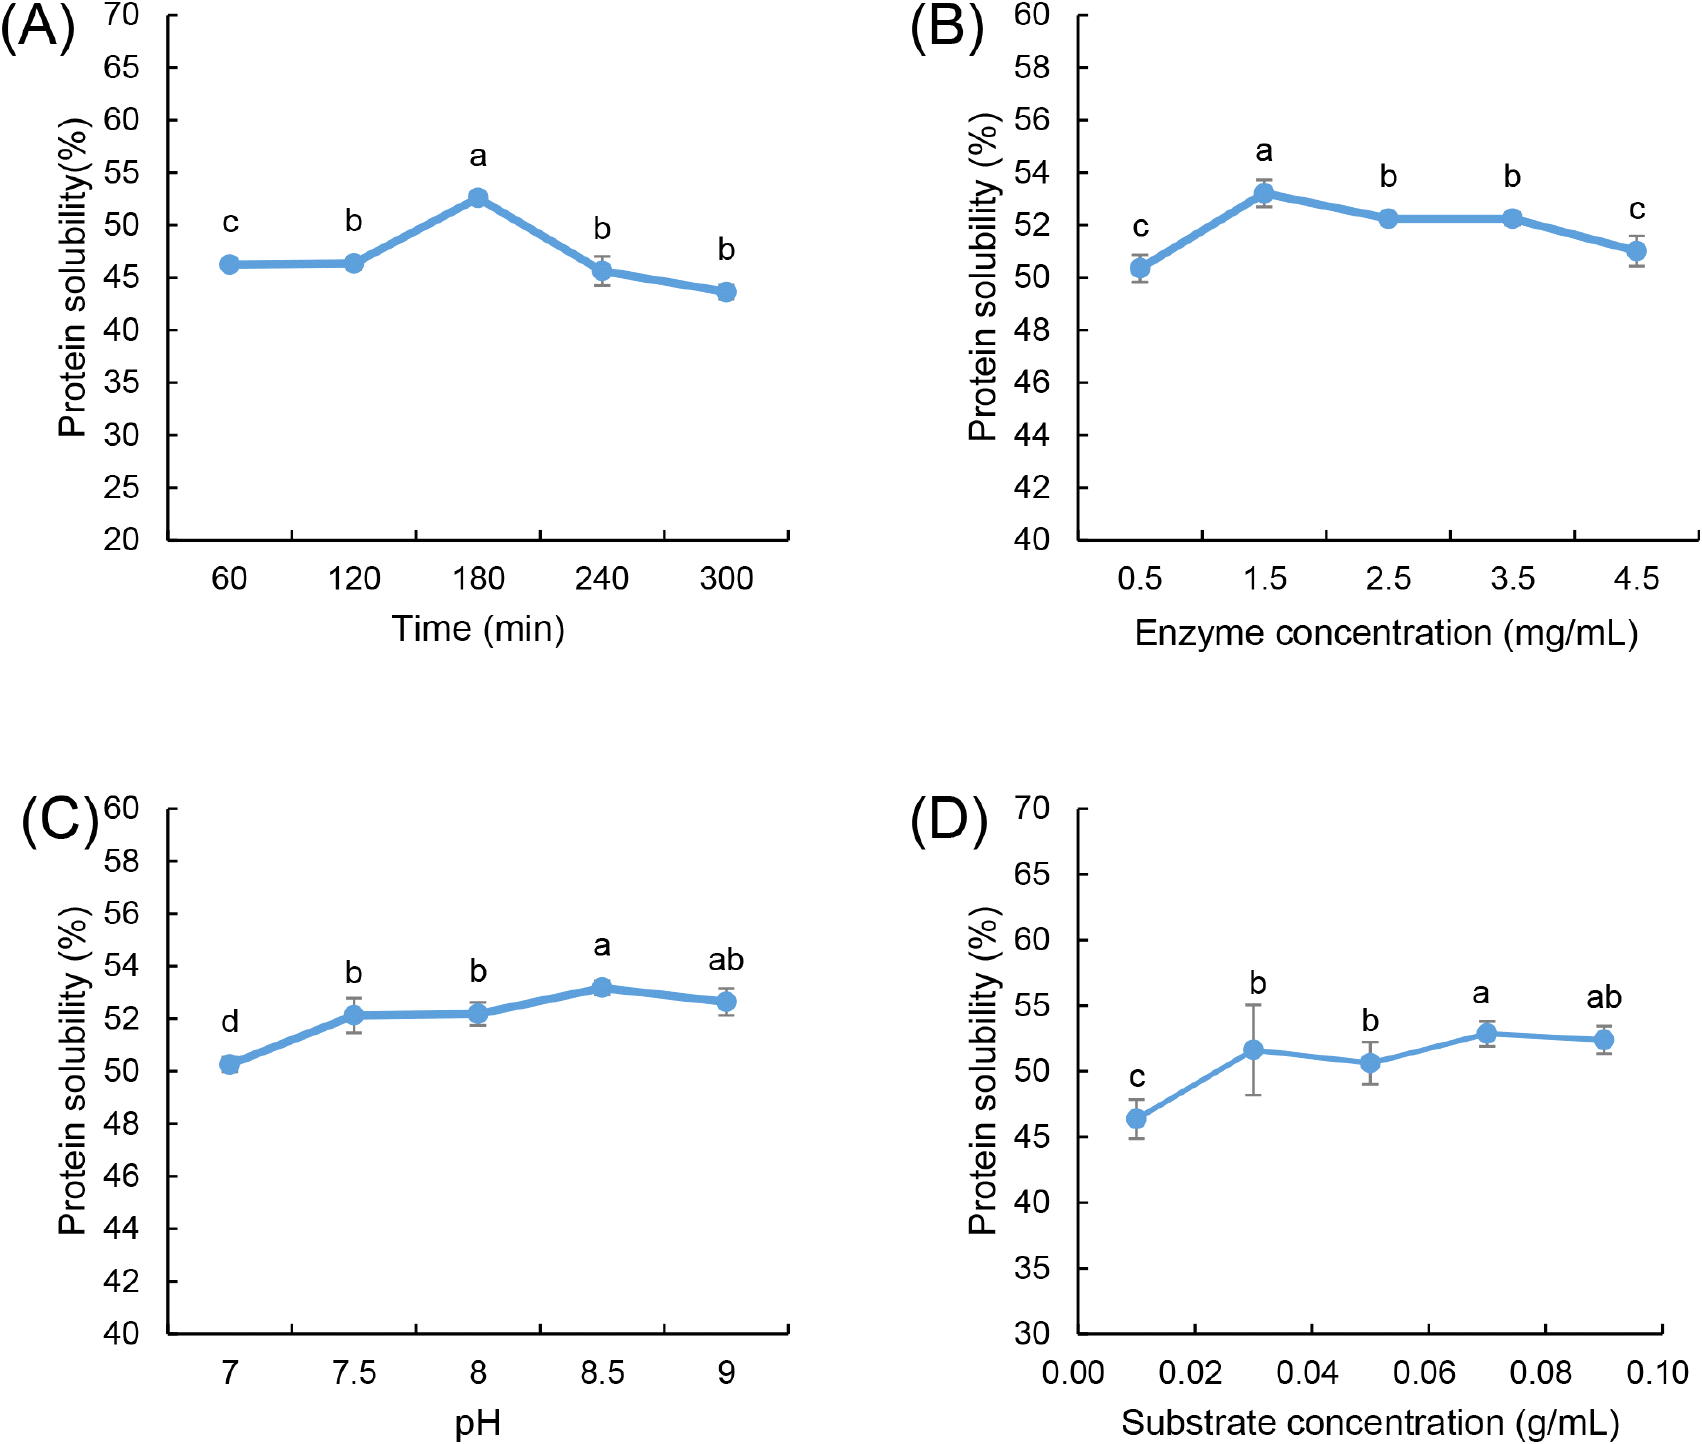
The effect of enzyme concentration on the solubility of HPI is illustrated in Fig. 1B. Hydrolysis was conducted at varying enzyme concentrations (0.5, 1.5, 2.5, 3.5, and 4.5 mg/mL) under controlled conditions of 180 min hydrolysis time, pH 8.5, and a substrate concentration of 0.05 g/mL. The solubility increased with enzyme concentration up to 1.5 mg/mL, as more active sites facilitated efficient peptide bond cleavage. However, beyond this concentration, solubility declined, likely due to substrate saturation, where excessive enzyme molecules had limited available substrate to hydrolyze. Furthermore, excess enzyme concentration can lead to enzyme self-aggregation, obstructing access to protein molecules and hindering effective hydrolysis. This is consistent with enzyme kinetics, where excessively high enzyme levels reduce the efficiency of hydrolysis due to molecular crowding and steric hindrance (Noman et al., 2018). Consequently, an enzyme concentration of 1.5 mg/mL was selected for subsequent experiments.
The pH-dependent hydrolysis study was performed within the range of 7.0 to 9.0 while maintaining a constant hydrolysis time of 180 min, enzyme concentration of 1.5 mg/mL, and substrate concentration of 0.05 g/mL. Alcalase is active within a pH range of 7.0 to 9.0, and the optimal pH is contingent upon the type of substrate used (Shu et al., 2016; Sierra-Lopera and Zapata-Montoya, 2021). The highest solubility was observed at pH 8.5 (Fig. 1C), indicating that this condition optimized electrostatic repulsion between hydrolyzed peptides, preventing aggregation and enhancing dispersion in solution. At lower pH values (<7.5), protonation of functional groups reduced enzyme catalytic efficiency, while at higher pH levels (>9.0), deprotonation destabilized the enzyme and protein structures, leading to partial denaturation and precipitation. The strong influence of pH on solubility aligns with previous findings where alcalase activity was maximized under slightly alkaline conditions, promoting efficient hydrolysis and peptide solubilization Noman et al. (2019). This indicates that the optimal pH for the interaction between alcalase and HPI is 8.5, as this pH level correlates with the highest degree of hydrolysis and, consequently, maximum solubility.
Additionally, Fig. 1D illustrates the effect of substrate concentration on the solubility of HPI, with hydrolysis time maintained at 180 min, enzyme concentration at 1.5 mg/mL, and pH at 8.5. At lower substrate concentrations, enzyme availability exceeded substrate presence, leading to inefficient hydrolysis, whereas at higher substrate concentrations, excessive protein molecules limited enzyme accessibility, aligning with the findings of Noman et al. (2018). Additionally, at high substrate levels, the formation of inactive enzyme-substrate complexes (E-S2) inhibited hydrolysis efficiency, resulting in a plateau or decline in solubility. The diffusion limitations associated with high substrate concentrations further restricted enzyme-substrate interactions, supporting the observed solubility trends (Qian et al., 2011).
Based on the results of these single-factor experiments, the parameters selected for the subsequent RSM study included hydrolysis times ranging from 120 to 240 min, enzyme concentrations between 0.5 and 2.5 mg/mL, reaction pH values from 7.0 to 9.0, and a substrate concentration of 0.07 g/mL. These parameter ranges were carefully chosen to optimize the enzymatic hydrolysis conditions aimed at enhancing HPI solubility in the next phase of the research.
The ranges and center points for the three independent variables in the RSM study were established based on the findings from the preceding single-factor experiments. Table 1 presents the regression coefficients and analysis of variance (ANOVA) results for protein solubility and Fig. 2 shows the effects of independent variables on the dependent ones and the response surface with the 3D plots, and 2D contour plots. The coefficient of determination (R2) was employed to assess the adequacy of the regression model in fitting the experimental data (Nagelkerke, 1991). For the solubility model, the R2 value was 0.9096, indicating that 90.96% of the variability in the response can be accounted for by the model. The model significance value of 0.0064 (p<0.05) confirms that the model is statistically significant. Additionally, the lack of fit p-value of 0.0873 (p>0.05) suggests no significant difference between the experimental and predicted values at the 95% confidence level (Dang et al., 2018). These results imply that the prediction model is reliable for all responses analyzed. The mathematical equation for the response surface model was derived using the actual values of the regression coefficients, represented as follows:
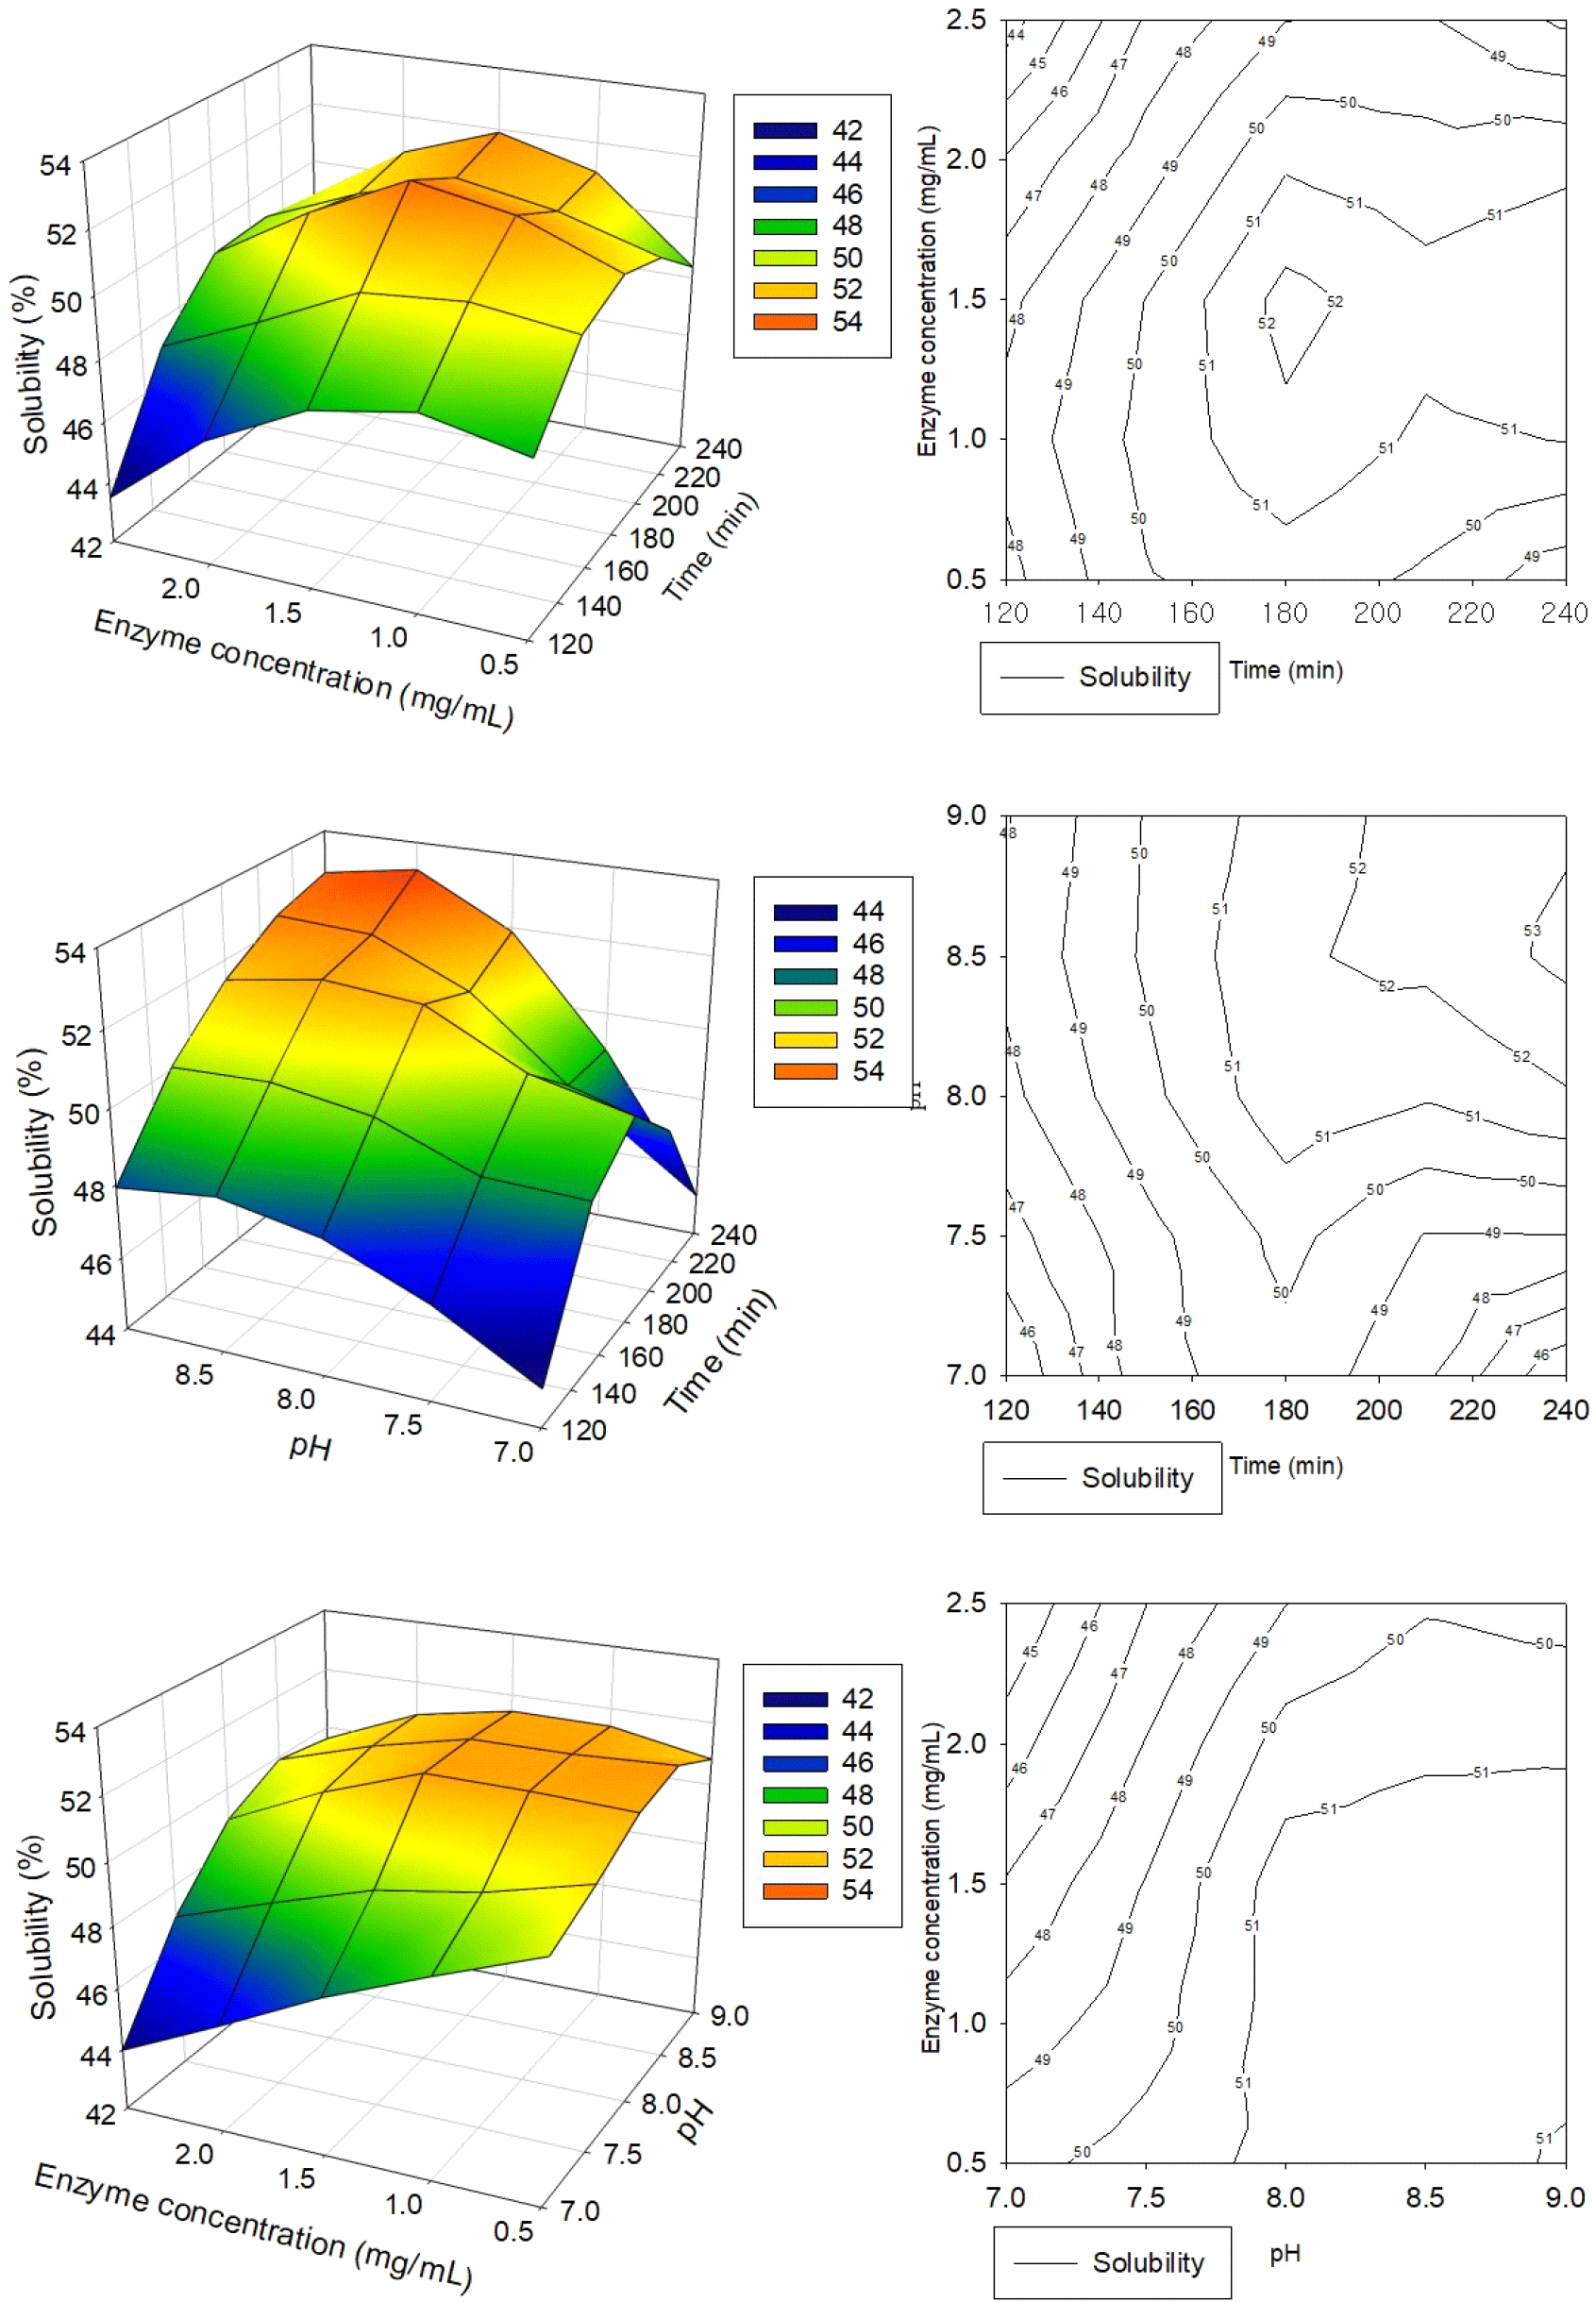
where Y is the solubility of HPI, whereas X1, X2 and X3 are coded variables for hydrolysis time, enzyme concentration and pH, respectively.
RSM study employed a centered composite design comprising 17 runs to optimize three process variables for HPI’s solubility: hydrolysis time, enzyme concentration, and pH. The results indicate that the prediction models developed are reliable for all responses, with the solubility of HPI ranging from 47.7% to 52.9% across the experimental conditions tested (Table 2). The highest experimental solubility of 52.9% was achieved under conditions of 180 min hydrolysis time, 1.5 mg/mL enzyme concentration, and pH 8.0. Further optimization through regression analysis predicted a maximum solubility of 53.20% under slightly modified conditions: 216 min hydrolysis time, 1.75 mg/mL enzyme concentration, and pH 8.7.
The regression model equation predicts the effects of hydrolysis time, enzyme concentration, and pH on HPI solubility, with their relationships visualized through 3D response surface plots and two-dimensional contour plots in Fig. 2, illustrating the response as a function of two factors while keeping one variable at its optimal value. Analysis of the response surface plots and regression coefficients (Table 1) reveals that pH (X3) showed a significant linear effect (p<0.05) on solubility with a large positive coefficient (+36.57) reflected in equation, indicating that increasing pH substantially enhances solubility, while hydrolysis time (X1) and enzyme concentration (X2) did not show significant linear effects and their negative coefficients suggest that excessive increases in these factors could potentially reduce solubility. The interaction between enzyme concentration and pH (X2X3) demonstrated a significant effect (p<0.05) with the largest positive coefficient (+2.2) among interactions, indicating a strong synergistic impact on solubility, whereas interactions between hydrolysis time and pH (X1X3) and between hydrolysis time and enzyme concentration (X1X2) had minimal effects. Higher solubility values were observed at higher enzyme concentrations combined with lower pH levels, as well as at higher enzyme-to-substrate ratios. The model’s reliability was validated through experimental confirmation, which yielded an HPI solubility of 53.23±0.05% (Table 2), closely aligning with the model’s predictions and demonstrating the accuracy and dependability of the developed regression model for optimizing HPI solubility under various processing conditions. Furthermore, the solubility of enzymatically treated HPI with optimized conditions (EH) was more than 14 times higher than that of untreated HPI (CON) (3.73%), suggesting that the enzymatic treatment had a significant impact on improving the food applicability of HPI. The results also suggest that RSM can be used to optimize enzymatic hydrolysis conditions, resulting in greater efficiency for culture and enzyme costs.
The degree of hydrolysis is an indicator of the degree of peptide bond cleavage and is shown in Fig. 3A. The hydrolysis degrees of CON and EH were calculated as 7.63% and 35.44%, respectively (p<0.05). During enzymatic hydrolysis, the enzyme cleaves proteins into smaller peptides and amino acids, which are more water-soluble than the original protein molecules (Tacias-Pascacio et al., 2020). This process exposes previously buried hydrophilic groups, increasing their interaction with water molecules. Additionally, hydrolysis decreases the molecular weight of proteins, reducing hydrophobic interactions and leading to fewer protein aggregates and improved solubility (Guo et al., 2022). The disruption of secondary and tertiary structures further exposes peptide bonds, making them more susceptible to cleavage and accelerating hydrolysis. As a result, the increased degree of hydrolysis enhances interactions between OH ions and water molecules, leading to higher solubility, which aligns with the solubility results. Furthermore, the study by Cui et al. (2021) supports these findings, observing that increased hydrolysis promotes molecular rearrangements, which enhance electrostatic repulsion and further improve solubility.
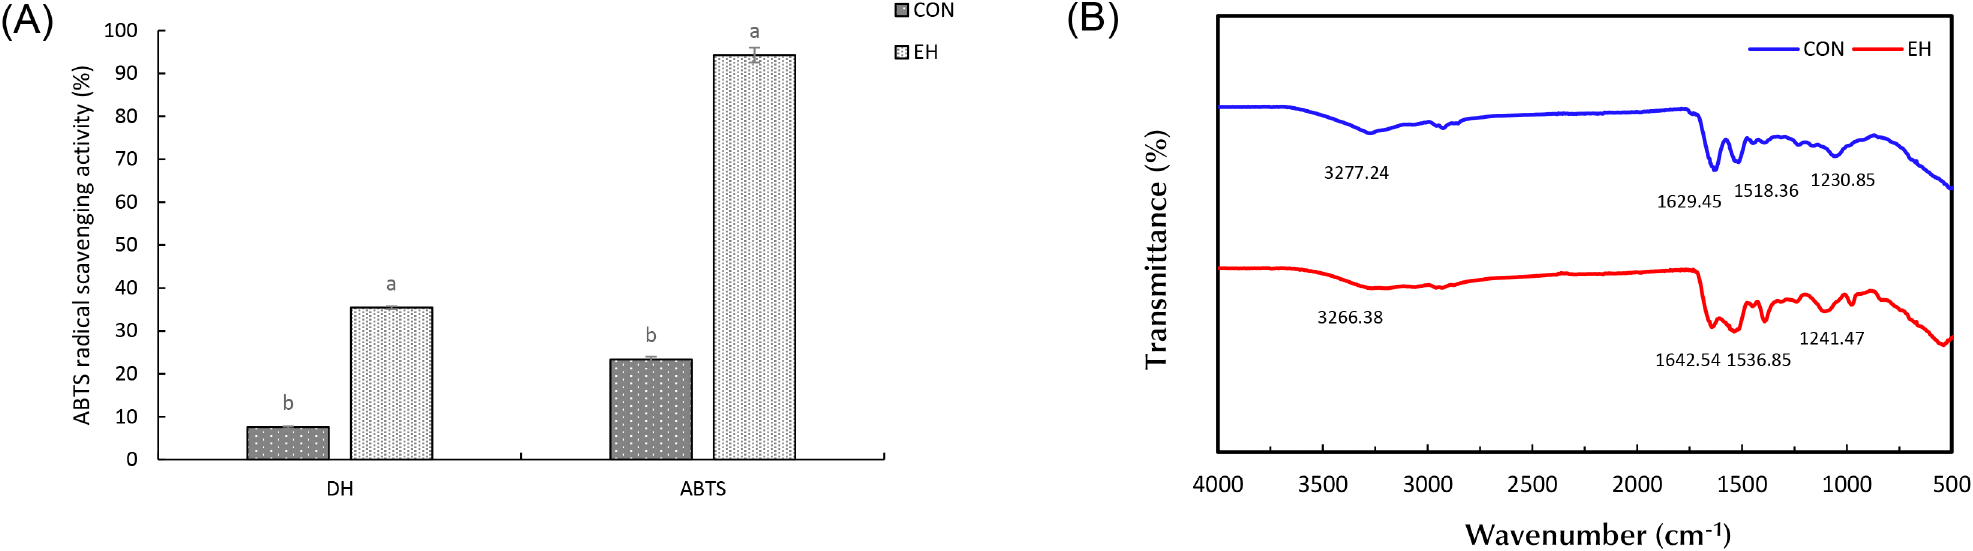
The ABTS radical scavenging activity test is a widely employed method for assessing antioxidant activity, based on the decolorization reaction that occurs when ABTS (2,2’-azino-bis (3-ethylbenzothiazoline-6-sulphonic acid)) interacts with potassium persulfate to generate a blue-green ABTS radical cation. This assay measures the ability of antioxidants to neutralize these radicals, resulting in a reduction of color intensity (Tran et al., 2024). As shown in Fig. 3A, the radical scavenging activity was 23.81% for CON and 94.28% for EH. Enzymatic hydrolysis induces significant structural changes in hempseed protein by breaking down larger protein molecules into smaller peptides and exposing previously hidden amino acids and peptide bonds. Hydrolysis disrupts the compact tertiary structure of hempseed protein, leading to increased peptide mobility and the exposure of electron-donating amino acids, such as tyrosine (Tyr), tryptophan (Trp), and cysteine (Cys), which actively scavenge free radicals by donating electrons. These amino acids contain phenolic hydroxyl (-OH) and thiol (-SH) groups, which serve as primary hydrogen donors, stabilizing reactive oxygen species (ROS) and other free radicals (Ozawa et al., 2022). Additionally, short-chain peptides generated during hydrolysis exhibit higher surface activity and molecular accessibility, allowing them to interact more efficiently with ABTS radicals and enhance radical neutralization. The increased solubility of hydrolysates further facilitates diffusion-controlled antioxidant reactions, ensuring faster interaction with radicals. The breakage of hydrophobic interactions and disulfide bonds during hydrolysis also leads to the exposure of internal hydrophilic groups, further improving solubility and reactivity (Pacheco et al., 2025). The improved radical scavenging capability of enzymatically hydrolyzed hempseed protein is further supported by the observation that low-molecular-weight peptides (typically <3 kDa) contribute significantly to antioxidant activity. Their smaller size, higher diffusion rate, and greater surface area enhance their capacity to bind, reduce, and neutralize radicals compared to larger peptides or intact proteins. This trend aligns with studies demonstrating that hydrolysis-generated bioactive peptides exhibit stronger antioxidant properties due to the increased availability of reactive amino acid residues Lee and Byun (2019), consistent with findings from other studies (Islam et al., 2022; Park et al., 2010). Furthermore, as the degree of hydrolysis (DH) increases, the ABTS radical scavenging activity also shows a corresponding increase. This trend can be attributed to the greater generation of low-molecular-weight peptides and free amino acids, which enhance radical neutralization due to their improved accessibility and reactivity. For instance, a study on soybean protein hydrolysates reported an ABTS activity rate of 70.21% for Alcalase-hydrolyzed proteins with a high DH, demonstrating that increased hydrolysis correlates with enhanced antioxidant properties (Islam et al., 2022). In conclusion, the results of antioxidant activity of EH suggest that hydrolysis resulted in increased antioxidant activity and that optimizing hydrolysis conditions can further enhance the presence of bioactive peptides.
FT-IR analysis provides insight into the molecular modifications that occur in proteins, which can indicate changes in secondary structure or the presence of different functional groups (Kamani et al., 2021). The FT-IR spectra of HPI provide molecular insights into the structural modifications induced by enzymatic hydrolysis (Fig. 3B). The amide I band (1,700-1,600 cm−1), primarily associated with C=O stretching and N-H bending, and the amide II band (1,600-1,500 cm−1), attributed to C-N stretching and N-H bending, exhibited significant changes upon hydrolysis (Bhetwal et al., 2024). Compared to the CON, EH showed broadening of both amide bands, likely due to the formation of secondary amines and peptide fragmentation during enzymatic hydrolysis (Nisar et al., 2023; Poulsen et al., 2016). Additionally, blue shifts in the amide I, II, and III bands (1,642.54, 1,536.85, and 1,241.47 cm−1) suggest alterations in protein secondary structure, particularly a reduction in ordered β-sheet structures and an increase in random coil content, indicating protein unfolding and hydrolysis (Zhao et al., 2019). The broad peaks observed at 3,200-3,400 cm−1, corresponding to N-H and O-H stretching, exhibited increased intensities in EH, signifying the presence of free amino acids and small peptide fragments (Dai et al., 2023). This suggests enhanced hydrogen bonding interactions due to increased exposure of polar functional groups, improving protein solubility. These spectral changes align with previous findings, confirming that enzymatic hydrolysis disrupts protein structures, reduces molecular size, and increases peptide flexibility, enhancing functional properties (Ashraf et al., 2024; Zhang et al., 2024).
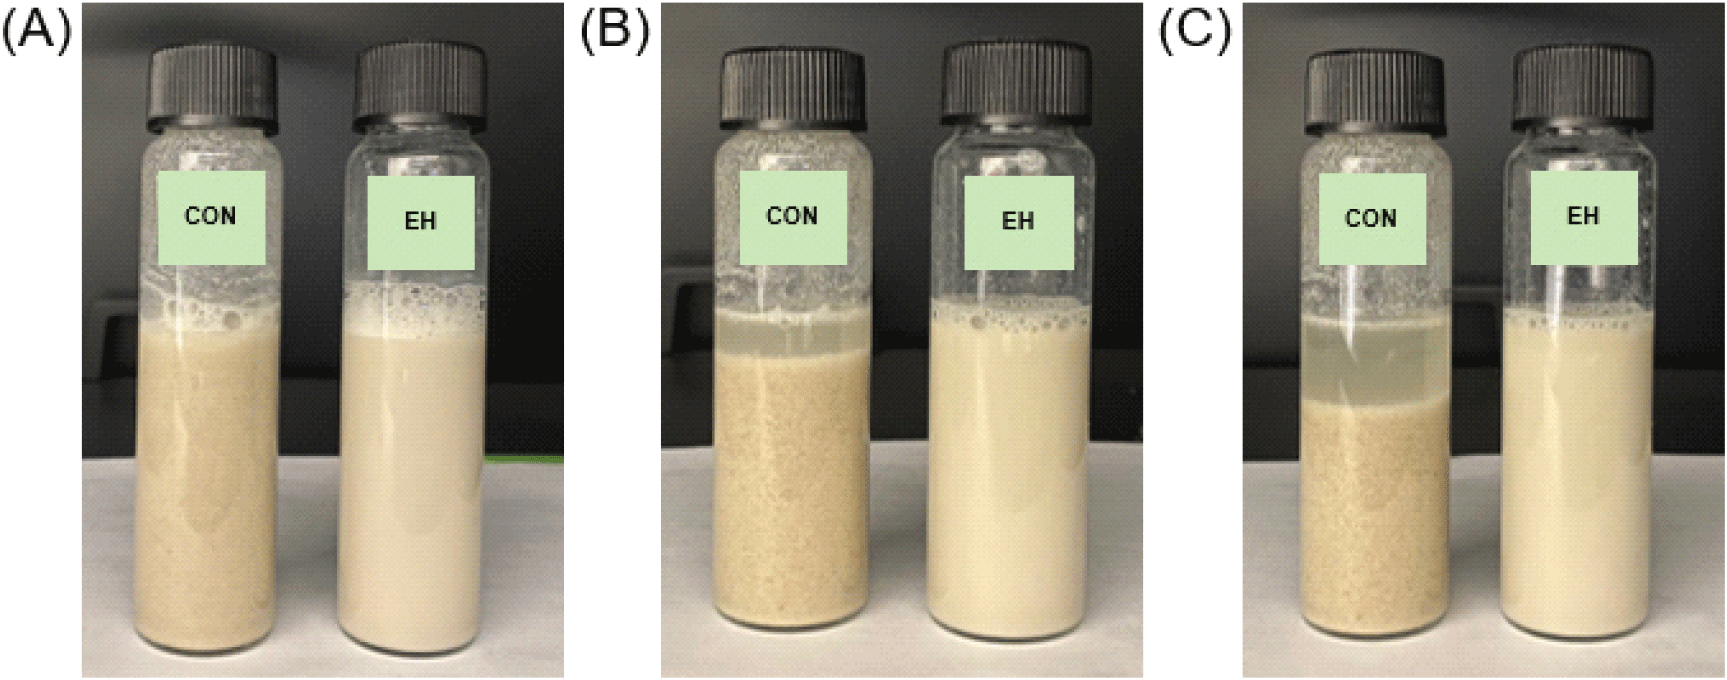
Fig. S1 shows the changes in appearance of the beverages over time, with observations recorded over a three-hour period, reflecting the typical consumption patterns of protein powder supplements, which are generally consumed quickly (Heather-Jacques, 2023). After preparation, the CON beverage was like a cereal drink, while the EH beverage had an appearance like almond milk. Notably, no visible changes were observed in the EH beverage over time, which can be attributed to its improved solubility and dispersibility. In contrast, the CON beverage displayed progressive phase separation, where protein precipitated at the bottom, and a clear liquid layer formed at the top, suggesting emulsion instability. This phase separation may result from insufficient solubility of CON, which disrupts the oil-in-water emulsion stability of almond milk, a system containing natural almond fat. Dhankhar and Kundu (2021) reported similar emulsion destabilization when insoluble particles interfere with the emulsification balance of non-dairy substitutes. Additionally Mun (2020) highlighted the positive correlation between protein solubility and emulsifying ability, indicating that the poor solubility of CON likely contributed to water separation and sedimentation.
The color stability analysis (Table 3) revealed that over time, brightness (L*) and redness (a*) increased, while yellowness (b*) decreased in all samples. The total color difference (ΔE), which quantifies color stability, was significantly lower in EH (ΔE: 0.71 to 4.60) compared to CON (ΔE: 1.50 to 15.17), indicating greater stability. The higher ΔE in CON was likely due to protein precipitation and phase separation, altering the optical properties of the beverage. Furthermore, enzymatic hydrolysis contributes to color differences by breaking down protein aggregates into smaller peptides, increasing light scattering and enhancing color uniformity (Pihlanto et al., 2021).
1) CON, untreated hempseed protein control; EH, hempseed protein enzymatically hydrolyzed with optimal condition.
4. Conclusions
This study successfully enhanced the solubility of HPI through enzymatic hydrolysis and optimized hydrolysis conditions for improved functionality in food applications, particularly in beverage formulations. Single-factor experiments identified 180 min hydrolysis time, 1.5 mg/mL enzyme concentration, pH 8.5, and 0.07 g/mL substrate concentration as initial optimal conditions, achieving 52.59-53.21% solubility. Further optimization using RSM refined these conditions to 215 min, 1.75 mg/mL enzyme concentration, and pH 8.7, resulting in a solubility of 53.23±0.05%, closely matching the predicted 53.20%. Under these optimized conditions, the enzymatic hydrolysis process significantly altered protein structure, increasing solubility by reducing molecular weight, improving charge distribution, and disrupting hydrophobic interactions. In addition, antioxidant activity was significantly increased, and beverage stability tests showed that hydrolyzed HPI had superior dispersion and color stability compared to untreated HPI. This study confirms that enzymatic hydrolysis is an effective strategy to enhance hempseed protein solubility, addressing a major limitation for its application in plant-based food formulations.