Special Topic (Functional bioactive compounds in agro-foods and database development)

국내 소비용 육류 및 수산식품의 판토텐산 함량 분석

유지현1https://orcid.org/0009-0002-8529-2315, 이진아1https://orcid.org/0009-0005-0815-0649, 김윤정1https://orcid.org/0000-0002-1328-5354, 이진서1https://orcid.org/0009-0004-5888-6286, 박은지2https://orcid.org/0000-0001-8691-7546, 최용민2https://orcid.org/0000-0002-8633-4671, 김영화1,3,*https://orcid.org/0000-0003-4186-887X
Jihyeon Yu1https://orcid.org/0009-0002-8529-2315, Jina Lee1https://orcid.org/0009-0005-0815-0649, Yoonjeong Kim1https://orcid.org/0000-0002-1328-5354, Jinseo Lee1https://orcid.org/0009-0004-5888-6286, Eunji Park2https://orcid.org/0000-0001-8691-7546, Youngmin Choi2https://orcid.org/0000-0002-8633-4671, Younghwa Kim1,3,*https://orcid.org/0000-0003-4186-887X
Author Information & Copyright
1경성대학교 식품생명공학과 BB21plus 프로젝트 팀
2국립식량과학원 식생활영양과
3경성대학교 식품생명과학연구소
1Department of Food Science and Biotechnology, BB21plus Project Team, Kyungsung University, Busan 48434, Korea
2Food and Nutrition Division, National Institute of Crop Science, Wanju 55365, Korea
3Food and Life Science Research Institute, Kyungsung University, Busan 48434, Korea
*Corresponding author Younghwa Kim, Tel: +82-51-663-4652, E-mail: younghwakim@ks.ac.kr

Citation: Yu J, Lee JA, Kim YJ, Lee JS, Park E, Choi Y, Kim YH. Analysis of pantothenic acid contents in meats and seafood consumed in Korea. Food Sci. Preserv., 32(3), 398-407 (2025)

Copyright © The Korean Society of Food Preservation. This is an Open Access article distributed under the terms of the Creative Commons Attribution Non-Commercial License (http://creativecommons.org/licenses/by-nc/4.0) which permits unrestricted non-commercial use, distribution, and reproduction in any medium, provided the original work is properly cited.

Received: Mar 10, 2025; Revised: May 14, 2025; Accepted: May 17, 2025

Published Online: Jun 30, 2025

Abstract

In this study, the contents of pantothenic acid (vitamin B5) in meats and seafood consumed in Korea were quantified by high-performance liquid chromatography with a UV detector. All analyses were performed under the quality control of pantothenic acid contents. The highest content of vitamin B5 in meats was 3.5833±0.1550 mg/100 g in raw beef liver. The highest contents of vitamin B5 in seafood was found in Eorigul Jeot A (1.9581±0.0179 mg/100 g). The limits of detection and limits of quantification of pantothenic acid were 0.001 and 0.003 μg/mL, respectively, and the accuracy/recovery percentage was 100.5%. The accuracy and precision of the method used for pantothenic acid analysis were excellent, with high recoveries and low relative standard deviations, which satisfied AOAC guidelines. Taken together, these results provide reliable data on the pantothenic acid contents of consumed meats and seafood in Korea.

Keywords: high-performance liquid chromatography; pantothenic acid; meats; seafood

1. 서론

우리나라의 식품 소비 형태는 경제 성장이 양적 성장 단계를 지나 질적 성장 단계로 전환됨에 따라 기존의 탄수화물 중심 식단에서 단백질 비중이 높은 식단으로 식생활의 변화를 보이는 추세이다(Kim 등, 2021). 국립축산과학원에서 제공하는 자료에 따르면, 닭고기의 경우 일반 성인의 취식 빈도는 2020년 대비 8.2% 증가하였으며, 소고기와 돼지고기의 경우 ‘주 1회’ 취식하는 비율이 각각 49.9%, 78.0%로 높은 취식 빈도가 보고되어 있다(National Institute of Animal Science, 2023). 육류는 양질의 단백질과 지질 등이 풍부한 식품으로 알려져 있으며(Kim 등, 2001), 육류의 섭취는 영양 결핍의 감소와 인간의 건강을 증진시키는 것에 도움이 된다고 한다(Parlasca와 Qaim, 2022). 또한, 소의 부산물은 비타민, 미네랄, 필수 아미노산 등이 풍부하게 함유되어 있어 영양가 있는 음식으로 인식되고 있으며, 그 소비는 증가하고 있다고 알려져 있다(Sabbagh 등, 2023). 수산물은 고품질의 단백질, n-3 다중불포화지방산(PUFA) 및 미네랄, 비타민 등이 함유되어 있으며, 인간에게 필수적인 식품으로 평가받고 있다(Hosomi 등, 2012). 또한, 생선의 섭취는 인지 발달, 정신 건강, 면역 체계 강화, 빈혈 예방, 심혈관 질환 예방 및 치매 예방에 유익한 효과를 미칠 수 있다(Marinac Pupavac 등, 2022). 국민영양통계에 따르면, 2022년에 다빈도 식품에서 어패류는 고등어 구이, 미역국 등과 같이 조리하여 섭취하는 경우가 많았으며, 평균 섭취량은 46.04 g으로 20개의 식품군 중 높은 비중을 차지하고 있는 것으로 보고되어 있다(KHDI, 2022). 또한, 통계청에 따르면, 2023년 수산 식품의 생산량은 3,690,591톤이었으며, 2022년의 생산량에 비해 약 2.22%가 증가했다는 것을 알 수 있다(Statistics Korea, 2023).

비타민은 정상적인 생리 기능에 필수적인 유기 화합물의 그룹이며, 비타민은 필수적인 영양소로서 다양한 신체 내 여러 대사 과정에서 중요한 기능을 수행한다(Shon 등, 2000). 판토텐산(pantothenic acid)은 비타민 B군에 속하는 수용성 비타민으로서 비타민 B5라고도 불리며(Wojtczak과 Slyshenkov, 2003), 탄수화물, 지방, 단백질 대사에 관여하는 coenzyme A와 acyl 전달 단백질의 합성에 필수적인 전구체로 알려져 있다(Said, 2015). 또한, 판토텐산은 육류, 난류, 곡류 등과 같은 모든 식품에 존재하는 물질로서 체내에서의 결핍은 드물지만, 영양실조가 있는 사람에게는 결핍증이 나타날 수 있다고 알려져 있다(Sanvictores와 Chauhan, 2024). 동물실험 결과에 따르면 판토텐산 결핍 시, 부신피질호르몬기능저하, 빈혈, 저혈당, 빈호흡과 빈맥, 경련 등의 다양한 증상들이 나타나는 것으로 보고하였다(Youn, 2005). 육류 및 어패류는 판토텐산의 주요 공급원으로 알려져 있으며, 특히 참치, 대구의 난소에는 판토텐산 함유량이 높은 것으로 보고되어 있다(Sampedro 등, 2015). 이처럼 판토텐산은 인체 내에서 중요한 역할을 하는 것으로 알려져 있다. 또한, 식품에 함유된 수용성 비타민에 관한 연구는 현재까지 많이 이루어졌으나, 국민들이 소비하는 육류와 수산식품의 판토텐산 함량에 관한 정보는 매우 부족한 실정이다. 본 연구에서는 육류 및 수산식품에 함유된 판토텐산 함량을 연구하여 제11개정판 국가표준식품성분표 작성에 활용하고자 수행되었다. 따라서 본 연구는 국내에서 소비하는 육류 및 수산 식품에 함유된 판토텐산의 함량을 high-performance liquid chromatography(HPLC)를 사용하여 정량적으로 분석하고자 하였다. 이는 국민의 건강 증진 및 균형 있는 식생활의 형성을 위한 기초 자료가 될 수 있을 것으로 기대된다.

2. 재료 및 방법

2.1. 실험 재료 및 시약

본 연구에 사용된 시료는 제11개정판 국가표준식품성분표의 작성을 위해 선정된 시료로, 2024년 농촌진흥청에서 제공받아 -20°C의 조건에서 보관하여 분석에 사용하였다. 이동상에 필요한 acetonitrile은 Thermo Fisher Scientific사(Waltham, MA, USA)에서, 추출 용매와 이동상으로 사용된 potassium phosphate monobasic과 표준품인 calcium pantothenic acid는 Sigma-Aldrich사(St. Louis, Mo, USA)에서 구입하였다. 이동상의 pH를 맞추기 위해 사용된 o-phosphoric acid 85%(Cat. No. 34860)는 Merck사(Darmstadt, Germany)에서 구입하였으며, 판토텐산의 분석법 검증을 위해 사용된 표준참고물질(Standard Reference Material, SRM)인 SRM 3252(protein drink mix)는 미국 국립표준기술소(National Institute of Standards and Technology; NIST, Gaithersburg, MD, USA)에서 구입하여 분석에 사용하였다. 또한 내부 분석 품질관리를 위해 사용한 시료는 부산 대형마트에서 판매하는 분유(infant formula, Imperial dream XO, Namyang, Seoul, Korea)를 사용하였으며, 이 밖에 사용된 용매 및 시약은 모두 HPLC 등급 및 특급 시약을 사용하였다.

2.2. 추출 용액 및 이동상 제조

시료의 추출 용액은 potassium phosphate monobasic 2.7 g을 취해 3차 증류수 용해시키고, o-phosphorbic acid를 이용해 pH 2.1로 조정한 후 1 L로 정용하여 제조하였다. 또한 이동상(KH2PO4:ACN-95:5)은 potassium phosphate monobasic 6.7 g을 취해 3차 증류수에 용해시킨 후, 추출 용액과 동일한 방식을 이용하여 pH 3.5로 조정해 1 L로 정용하였다. 추출 용액과 이동상은 모두 감압 여과 후 분석에 사용하였다.

2.3. 판토텐산의 추출물 제조

균질화된 검체 약 0.5-5 g을 50 mL conical tube에 칭량하여, 추출 용매인 20 mM KH2PO4(pH 2.1) 용액 20 mL를 가한 후 20분간 40°C의 조건에서 초음파 추출을 진행하였다. 추출액은 2,862 ×g에서 10분간 원심분리하였으며, 상등액만 여과지(Whatman No.2, GE Healthcare, Amersham Place, UK)를 이용해 여과하였다. 이후, 남은 pellet에 추출 용매 20 mL를 가하여 20분간 동일한 조건에서 초음파 추출을 하였으며, 이를 10분간 2,862 ×g에서 원심분리한 후 Whatman No.2 여과지를 통해 상등액만 얻었다. 처음 추출한 상등액과 잘 섞어준 후, 0.2 μm syringe filter(Whatman Inc.,)로 여과하여 분석에 사용하였다.

2.4. 판토텐산의 함량 평가

판토텐산 함량을 정량적으로 분석하기 위해 HPLC(Chromaster 5000 series, Hitachi, Tokyo, Japan)를 사용하였으며, 자세한 분석조건은 Table 1에 나타내었다. 또한, 식품공전(MFDS, 2024)의 방법을 참고하여, 육류 및 어패류에 함유된 판토텐산 함량 평가를 진행하였다. 정량적인 함량 평가를 위해 5 μg/mL의 표준용액을 제조하였으며, 이를 연속 희석법을 통해 5, 2.5, 1.25, 0.625, 0.3125 μg/mL로 희석하여 표준검량선을 작성하였다. 분석 시료의 판토텐산 함량은 peak area를 표준검량식에 대입하여 시험용액의 농도를 산출한 후, 아래의 식에 대입하여 함량을 계산하였다.

Table 1. HPLC condition for pantothenic acid analysis
Column YMC-Pack ODS AM (250 mm × 4.6, 5 μm)
Detector UV detector 200 nm
Mobile phase 50 mM potassum phosphate monobasic (pH 3.5) : Acetonitrile = 95:5 (v/v) (Isocratic elution)
Flow rate 1.0 mL/min
Injection volume 20 μL
Column oven 33°C
Download Excel Table
 Pantothenic acid 함량  ( m g / 100 g ) = S × a × b  검체 채취량  ( g ) × 100 1000 × 219.23 238.27

S: 시험용액의 pantothenic acid 농도(μg/mL)

a: 시험용액의 전량

b: 시험용액의 희석배수

219.23: 판토텐산의 분자량

238.27: 판토텐산 칼슘의 분자량

2.5. 판토텐산의 분석법 검증

본 연구의 분석법 검증은 AOAC guideline에 따라 수행되었으며, 판토텐산 분석법을 검증하기 위해 직선성, 선택성, 분석 감도, 정확성, 반복성, 재현성을 검토하였다. 직선성은 표준용액을 농도별로 제조하여 얻은 area 값과 표준용액의 농도를 이용하여 검량선을 작성하였으며, 상관계수(R2) 값을 통해 확인하였다. 또한, 표준용액과 각 시료 추출물의 크로마토그램으로 HPLC 분석 결과의 peak 분리 양상을 확인함으써 선택성을 검토하였다. 분석 감도는 검출한계(limit of detection, LOD)와 정량한계(limit of quantification, LOQ)를 계산하였으며, LOD는 signal:noise비(s/n비)가 3이 될 때의 농도로 설정하였으며, LOQ는 s/n비가 10이 될 때의 농도로 설정하여 계산에 이용하였다. 정확성을 평가하기 위해 인증값이 제시된 표준 참고 물질 SRM 3252(protein drink mix)를 분석하여 비교했으며, 회수율을 검토하였다. 또한, 시판되는 영아용 분유를 사용하여 반복성과 재현성을 평가하였다. 독립적으로 5회 3반복씩 분석하여 반복성(repeatability, intra-day precision)을 계산하였으며, 5일간 하루에 1회씩 3반복으로 분석하여 재현성(reproducibility, inter-day precision)을 계산하였다.

2.6. 판토텐산의 내부 분석품질관리

판토텐산의 내부 분석품질관리(in-house quality control material)를 수행하기 위해서 시판되는 영아용 분유를 10회 이상 추출하여 분석하였으며, 분석된 값을 기준으로 각 성분의 평균값을 확립한 후, 평균±2×표준편차 값과 평균±3×표준편차 값을 각각 관리 상 ․ 하한선(upper and lower control line)과 조치 상 ․ 하한선(upper and lower action line)으로 설정하였다. 또한, 분석품질관리를 위해 매 분석 시 영아용 분유를 시료 분석과 함께 진행하여 본 분석의 반복성을 확립하고자 하였다.

2.7. 통계처리

각 시료에서 판토텐산의 함량분석은 3 반복으로 진행되었다. 또한, SAS ver. 9.4(Statistical Analysis System, SAS Institute Inc. Cary, NC, USA) 프로그램을 이용하여 각 시료군의 평균값에 대한 처리 평균 간 유의성 검정은 Duncan’s multiple range test를 이용하여 p<0.05의 수준에서 평가하였다.

3. 결과 및 고찰

3.1. 판토텐산의 분석법 검증 및 내부 분석품질관리

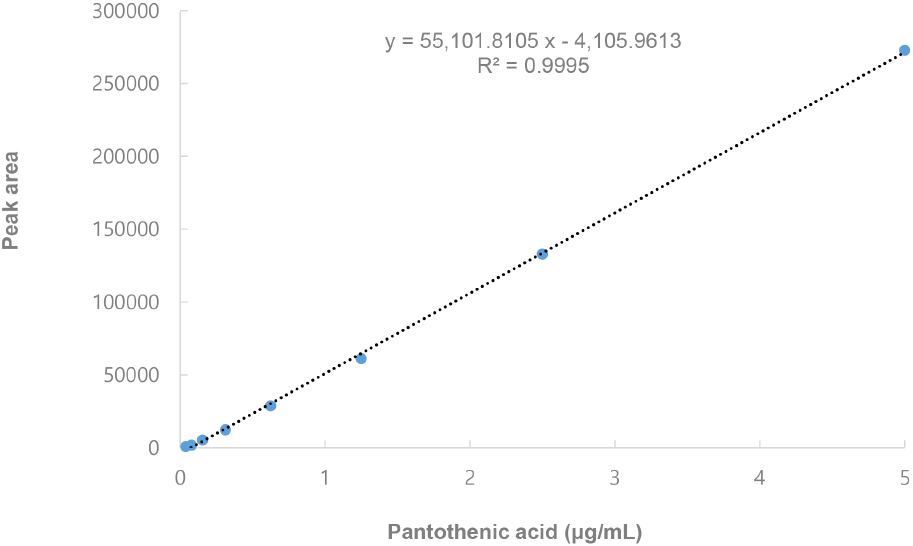
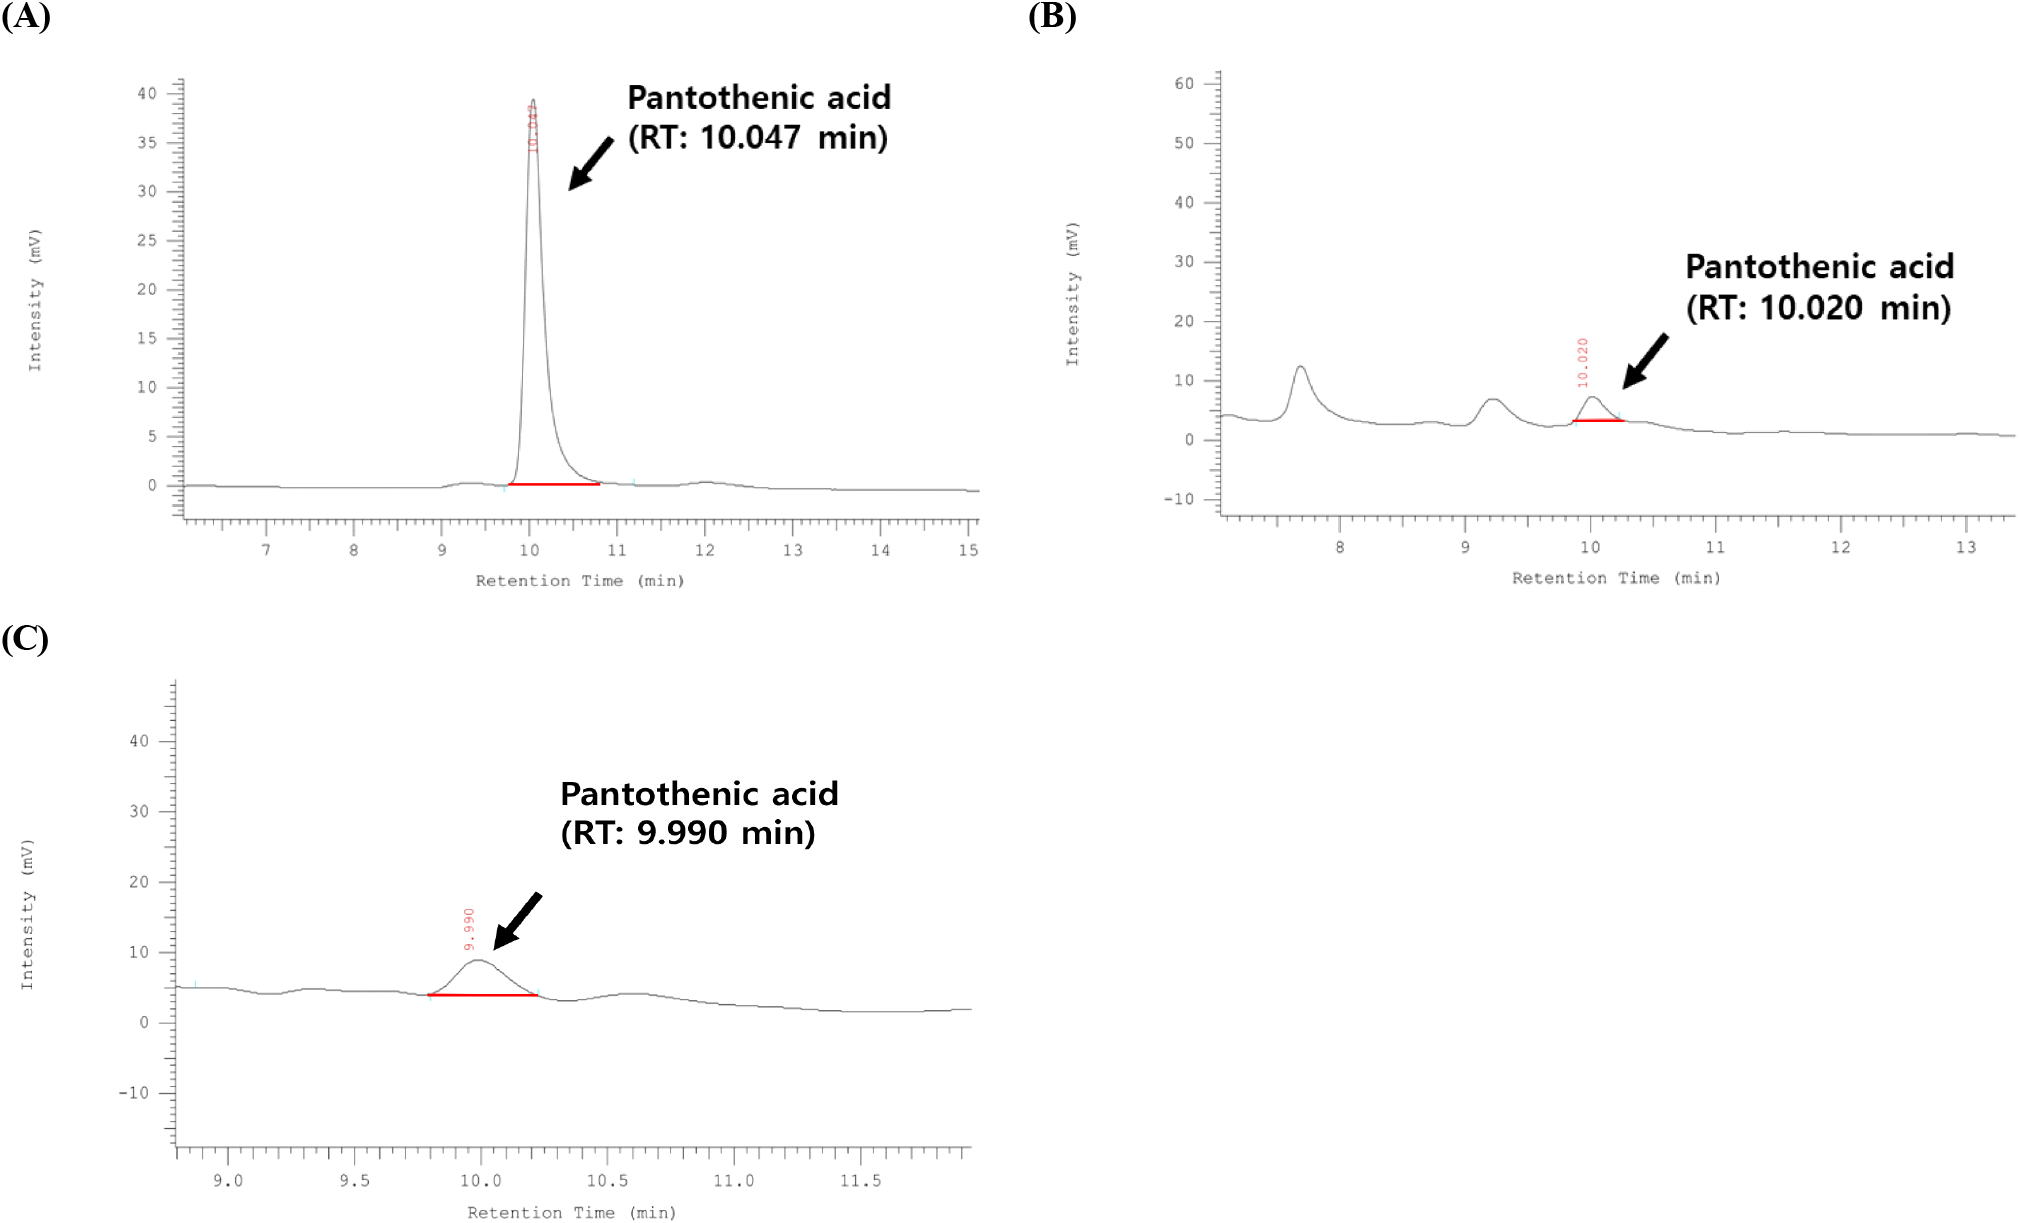
판토텐산 분석법의 직선성을 평가하여 Fig. 1에 나타내었다. HPLC를 통해 얻은 area 값과 표준용액의 농도를 이용하여 검량선을 작성한 결과, Y=55,101.8105X-4,105.9613이었으며, 상관계수(R2)는 0.999 이상으로 우수한 직선성을 나타냈다. 분석법의 선택성을 검토하기 위해 표준용액과 대표시료(SRM 3252)의 크로마토그램을 비교하였으며(Fig. 2), 판토텐산의 peak가 표준용액과 대표시료에서 우수하게 분리되는 것을 확인할 수 있었다. 또한, 분석법 검증 결과는 Table 2에 나타냈다. 분석감도를 평가하기 위해 진행한 검출한계와 정량한계의 결과는 각각 0.001 μg/mL, 0.003 μg/mL였다. Islam 등(2022)의 연구에 따르면, 판토텐산의 검출한계와 정량한계는 각각 0.0003 mg/100 g, 0.0008 mg/100 g이었다. 또한, Sadecka 등(2003)의 선행 연구에 따르면, 검출한계는 0.10-0.13 mg/L, 정량한계는 0.30-0.40 mg/L의 수준이었다. 이전 선행 연구에서의 검출한계, 정량한계 값들을 비교하였을 때 본 연구에서 사용한 분석법은 고감도 검출이 가능한 것으로 판단되며, 판토텐산 성분을 우수하게 검출할 수 있을 것으로 생각된다. 분석법에 대한 정확성을 평가하기 위해 SRM 3252를 분석을 진행하였다. 본 연구의 유효성을 검증하기 위하여 AOAC 시험법 검증 guideline(2016)에서 제시하는 방법을 참고하여 회수율을 구하였으며, 판토텐산의 표준인증값은 150±12 mg/kg, 실제 측정값은 150.75±0.95 mg/kg으로 100.5%의 우수한 회수율을 나타냈다. 반복성과 재현성의 결과는 각각의 상대표준 편차(relative standard deviation, RSD)가 1.242%, 1.993%로 나타났다. 이는 AOAC guideline(2002)에서 제시한 허용 가능한 상대표준 편차였으며, 본 연구의 반복성과 재현성은 우수하다는 것을 알 수 있었다.

kjfp-32-3-398-g1
Fig. 1. Standard curve of pantothenic acid.
Download Original Figure
kjfp-32-3-398-g2
Fig. 2. HPLC chromatograms of pantothenic acid standard (A), SRM 3252 (B), and quality control sample (C). SRM 3252, protein drink mix; quality control sample, infant formula.
Download Original Figure
Table 2. Validation of analytical method for pantothenic acid
Vitamin Sensitivity Precision Recovery and accuracy
LOD1) LOQ2) Repeatability3) Reproducibility4) Reference value6) Analysis value7) Recovery (%) RSD (%)
(μg/mL) RSD (%)5) RSD (%)
Pantothenic acid 0.001 0.003 4.831±0.0028 4.832±0.096 150±12 150.75±0.95 100.5 0.63

1) LOD, limit of detection; LOD=3×signal/noise.

2) LOQ, limit of quantification; LOQ=10×signal/noise.

3) Repeatability refers to the results of 5 independent determinations carried out for the same sample on the same day.

4) Reproducibility refers to the results of 5 independent determinations carried out on a sample by analyzing 3 replicates of the sample at each day for 5 days.

5) Relative standard deviation (%).

6) Reference value is the true value provided by NIST.

7) Analysis value is the experimental value obtained by HPLC assay for pantothenic acid.

Download Excel Table

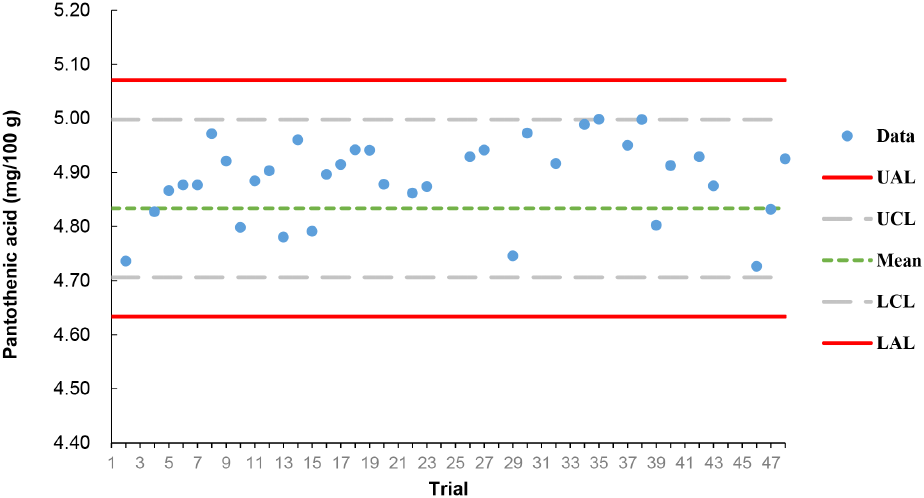
본 분석에서 판토텐산의 내부 분석품질관리를 위해 작성한 QC chart의 결과는 Fig. 3과 같다. 시판되는 영아용 분유를 시료로 설정하여 판토텐산을 10회 이상 반복 분석하였으며, 분석한 값을 기준으로 관리 상 ․ 하한선과 조치 상 ․ 하한선을 설정하였다. 관리 상 ․ 하한선은 4.998-4.706 mg/g, 조치 상 ․ 하한선은 5.071-4.633 mg/g을 나타내었다. 유아용 분유의 분석값은 관리 상 ․ 하한선을 초과하지 않는 것을 확인할 수 있었으며, 본 연구의 신뢰성을 확보하였다.

kjfp-32-3-398-g3
Fig. 3. Quality control chart for pantothenic acid in infant formula. UAL, upper action line; LAL, lower action line; UCL, upper control line; LCL, lower action line.
Download Original Figure
3.2. 육류의 판토텐산 함량

육류에서의 판토텐산 함량은 품종(소, 닭, 돼지)별로 나누어 Table 3에 나타내었다. 소의 부산물 중에서 생간은 3.5833 mg/g으로 가장 높은 판토텐산 함량이 검출되었으며, 구운 간에서는 3.0229 mg/g으로 생 것에 비해서는 감소하였으나 큰 함량 차이를 보이지는 않았다. 소의 부산물 중에서도 특히 간에는 비타민 A와 비타민 B 등이 풍부하게 함유되어 있다고 알려져 있다(Ahmad 등, 2018). 또한, Hopper 등(2018)의 연구에 따르면, 소고기를 굽는 경우보다 탈지한 간의 분말에서 약 11배 이상의 높은 판토텐산 함량이 검출된 것을 확인할 수 있다. 반면, 소의 부산물 중에 삶은 허파와 천엽에서 판토텐산의 함량이 나타나지 않았으며, 전반적으로 삶았을 경우 함량이 감소하거나 검출되지 않는 경향을 보였다. 이는 판토텐산이 수용성 비타민이라는 특성으로 인해 삶는 과정에서 조리수로 용출되었을 것이라고 판단된다. 또한, 부산물 중 간 외에도 혈액에는 1.2936 mg/g의 판토텐산이 검출되었다. 닭의 시료 중에서 껍질을 포함하고 있는 생 닭다리는 1.5170 mg/g의 높은 판토텐산 함량이 나타났으며, 껍질을 벗긴 생 닭다리의 경우 1.4618 mg/g으로 함량이 소폭 감소하는 것을 확인할 수 있었다. 닭의 껍질 유무는 판토텐산의 함량에 큰 영향을 미치지 않는다는 것을 알 수 있다. 돼지의 경우, 하몽은 3.2360 mg/g, 잠봉은 0.3670 mg/g으로 나타났다. 잠봉과 하몽은 발효육 제품으로서 뒷다리 또는 앞다리 부위를 소금이나 염지제를 이용해 염지 후, 숙성시킨 것을 의미한다(Yim 등, 2015). 하몽과 잠봉은 생산하는 공정은 비슷하나 하몽의 경우 일년 이상, 잠봉의 경우 6-12개월의 숙성을 거친 제품들로 원료 및 숙성 기간에 따라 구성 성분의 함량에 변화가 있을 것으로 생각된다. 보건복지부에서 발간한 한국인 영양소 섭취 기준에 따르면, 남자와 여자는 6-8세의 경우, 3 mg/일이며, 9-11세는 4 mg/일, 12-14세부터 성인까지는 5 mg/일로 보고되어 있다(MOHW와 KNS, 2020). 육류 시료 전체에서 소고기 생간과 구운 간, 하몽에 판토텐산은 3 mg/100 g 이상으로 함유되어 있으며, 이러한 시료의 섭취는 한국인 영양소 섭취 기준의 절반 이상을 충족시켜 줄 수 있을 것으로 생각된다.

Table 3. Contents of pantothenic acid in meats
Sample Pantothenic acid (mg/g wet weight)1)
Beef edible offal, blood, boiled 0.1848±0.0034c2)
Beef edible offal, blood, raw 1.2936±0.0051b,c
Beef edible offal, heart, boiled 0.3730±0.0110c
Beef edible offal, kidney, boiled 0.5647±0.0110c
Beef edible offal, liver, boiled 1.5815±0.1256a,b,c
Beef edible offal, liver, raw 3.5833±0.1550a
Beef edible offal, liver, roasted 3.0229±0.0479a,b
Beef edible offal, lung, boiled ND3)
Beef edible offal, omasum, boiled ND
Beef edible offal, omasum, raw 0.3710±0.0031c
Beef edible offal, stomach, boiled 0.1910±0.0012c
Beef edible offal, stomach, raw 0.2568±0.0039c
Beef edible offal, tail, boiled 0.1909±0.0047c
Beef edible offal, tail, boiled, broth 0.7171±0.0065c
Beef jerky ND
Chicken breast, canned 0.1618±0.0009a,b
Chicken breast, smoked 0.5194±0.0008a,b
Chicken breast, steak 0.8943±0.0039a,b
Chicken meat, broiler, boiled 0.2468±0.0032a,b
Chicken meat, fowl, boiled 0.6856±0.0093a,b
Chicken meat, fowl, boiled, broth ND
Chicken meat, leg, boiled, skinless 0.5919±0.0077a,b
Chicken meat, leg, boiled, with skin 0.6703±0.0195a,b
Chicken meat, leg, raw, skinless 0.5043±0.0002a,b
Chicken meat, leg, raw, with skin 0.5370±0.0162a,b
Chicken meat, leg, roasted, oven, skinless 1.1194±0.0275a,b
Chicken meat, leg, roasted, oven, with skin 1.0623±0.0241a,b
Chicken meat, leg, roasted, pan, skinless 1.4618±0.0250a,b
Chicken meat, leg, roasted, pan, with skin 1.5170±0.0201a
Chicken meat, neck, boiled 0.2911±0.0064a,b
Chicken meat, neck, raw 0.3727±0.0043a,b
Chicken meat, neck, roasted, oven 0.7128±0.0168a,b
Chicken meat, neck, roasted, pan 1.3368±0.0149a,b
Chicken meat, Ogolgye, boiled 0.4703±0.0093a,b
Chicken meat, tenderloin (Ansim), boiled 0.5403±0.0134a,b
Chicken meat, tenderloin (Ansim), fried, frozen, A 1.1169±0.0077a,b
Chicken meat, tenderloin (Ansim), fried, frozen, A, air-fried 0.9997±0.0038a,b
Chicken meat, tenderloin (Ansim), fried, frozen, B 0.7603±0.0053a,b
Chicken meat, tenderloin (Ansim), fried, frozen, B, air-fried 0.6268±0.0061a,b
Chicken meat, tenderloin (Ansim), fried, frozen, C 0.5542±0.0152a,b
Chicken meat, tenderloin (Ansim), fried, frozen, C, air-fried 0.9451±0.0005a,b
Chicken meat, tenderloin (Ansim), raw 0.6710±0.0040a,b
Chicken meat, tenderloin (Ansim), roasted, oven 1.4424±0.0202a,b
Chicken meat, tenderloin (Ansim), roasted, pan 1.1003±0.0093a,b
Chicken meat, tenderloin (Ansim), boiled 0.2405±0.0072a,b
Chicken skewers (Dak-Kkochi), raw 0.4978±0.0191a,b
Chicken skewers (Dak-Kkochi), roasted 0.9166±0.0097a,b
Chicken, fried, breast 0.6783±0.0128a,b
Chicken, fried, leg 0.4543±0.0025a,b
Chicken, fried, whole 0.4875±0.0080a,b
Chicken, fried, wing 0.2751±0.0040a,b
Chicken, roasted, breast 1.2018±0.0140a,b
Chicken, roasted, leg 0.903±0.01890a,b
Chicken, roasted, whole 1.1840±0.0324a,b
Chicken, roasted, wing 0.4825±0.0040a,b
Chicken, soy sauce, breast 1.5039±0.0065a
Chicken, soy sauce, leg 0.7353±0.0033a,b
Chicken, soy sauce, whole 0.7857±0.0169a,b
Chicken, soy sauce, wing 0.5500±0.0088a,b
Jambon, raw 0.3670±0.0030a
Jamon, raw 3.2360±0.0377a
Pork jerky ND

1) All values are mean±SD (n=3).

2) Means with different superscript letters (a-c) are significantly different by Duncan’s multiple range test at p<0.05.

3) ND, not detected.

Download Excel Table
3.3. 수산 식품의 판토텐산 함량

수산 식품의 판토텐산 함량은 Table 4에 나타냈다. 어리굴젓의 경우 상품마다 조금씩의 함량 차이를 보였으며, 상품 A는 1.9581 mg/g, 상품 B는 1.1825 mg/g, 상품 C의 경우에는 0.4319 mg/g이었다. 젓갈의 대부분은 원료의 수확 시기, 성상, 가염의 정도에 따라 제품이 불균일하게 생산되고 있으며, 발효기질인 원료의 종류와 상태, 숙성발효에 관여하는 미생물이나 작용 효소의 기작 등이 생산 과정에 영향 요인들로서 비타민의 함량차이에도 영향을 미쳤을 것으로 사료된다(Lee 등, 1999). 어리굴젓 외에도 갈치 젓갈, 멜젓 소스, 멸치 육젓을 상품별로 분석한 결과, 갈치 젓갈은 0.0426-0.1251 mg/g이었으며, 멜젓 소스는 0.6050-1.3201 mg/g, 멸치 젓갈은 0.0000-0.2478 mg/g을 나타냈다. 이는 상품의 공정 차이와 재료의 원사지에 따른 차이가 판토텐산 함량에 영향을 미쳤을 것이라고 생각된다. 젓갈과 같은 발효 식품은 소금 함량이 높으며, 젓갈을 제조하는 과정에서 첨가되는 소금의 종류에 따라 발효 식품에서의 역할과 기능성의 차이를 나타낼 수 있다(Park 등, 2023). 멸치 생 것은 상품별로 0.000-0.1802 mg/g의 판토텐산이 검출되었으며, 멸치 육젓의 함량과 비교하였을 때 멸치 생 것을 육젓으로 만드는 과정에서 판토텐산의 함량이 감소하는 것을 확인할 수 있었다. Kim(1996)의 연구에 따르면, 젓갈의 일반성분은 원료에 비해 수분과 단백질, 지방, 당질 등 유기 고형분의 감소가 발생하며, 염을 포함한 무기성분은 증가한다. 이러한 여러 요인으로 인해 생 것의 원료와 젓갈에서의 판토텐산 함량의 차이가 발생했을 것으로 사료된다. Kwak 등(2012)의 연구에 따르면, 오징어 생 것에서 비타민 B12의 함량은 10.80 μg/100 g의 함량을 나타냈으며, 젓갈로 만들었을 때는 6.37 μg/100 g으로 감소하는 경향을 나타냈다. 이는 본 연구에서의 경향과도 비슷하다는 것을 알 수 있었다. 또한, 고등어, 삼치, 냉동 날치알에서는 각각 0.1639 mg/g, 0.0586 mg/g, 0.2873 mg/g의 판토텐산의 함량이 나타났다. 또한 냉동 코다리에서는 0.4391 mg/g, 냉동 코다리를 삶았을 때 0.1061 mg/의 판토텐산이 검출되었다. 농촌진흥청에서 발간한 국가표준식품성분표(RDA, 2021)에 따르면, 자반고등어의 경우 0.265 mg, 삼치 생 것은 0.379 mg, 가다랑어 육수는 0.04 mg으로 대부분의 어패류 시료에는 판토텐산의 함량이 미량으로 함유되어 있다는 것을 확인할 수 있었다. 오징어 튀김의 경우 냉동 상태에서의 판토텐산은 0.1268 mg/g이 함유되어 있었으며, 기름에 튀긴 오징어 튀김에서는 0.1196 mg/g, 에어프라이기에 튀긴 것에서는 0.2247 mg/g의 판토텐산 함량이 나타났다. 에어프라이기 조리법(air-frying)은 대류를 사용하여 뜨거운 공기를 순환시켜 식품을 가열하는 조리법으로, 기름에 튀기는 과정에 비해 수분이 휘발하거나, 기름으로 비타민 등의 성분이 용출되는 것을 방지할 수 있는 것으로 알려져 있다(Lee와 Surh, 2022). 수산 식품의 판토텐산 함량은 다양한 식품군에서 검출되었으나, 그 함량은 본 연구에서 알아본 닭고기나 소 부산물 등의 육류 식품에 비하여 전반적으로 낮게 나타났다.

Table 4. Contents of pantothenic acid in seafoods
Sample Pantothenic acid (mg/g wet weight)1)
Anchovy, raw, A 0.0246±0.0008d2)
Anchovy, raw, B 0.1802±0.0069d
Anchovy, raw, C ND3)
Cod, frozen 0.4391±0.0056c,d
Cod, frozen, steamed 0.1061±0.0004d
Deep-fried squid, frozen 0.1268±0.0002d
Deep-fried squid, frozen, air-fried 0.2247±0.0009d
Deep-fried squid, frozen, deep-fried 0.1242±0.0015d
Dried fish strips, raw ND
Eorigul Jeot (salted/fermented oyster), A 1.9581±0.0179a
Eorigul Jeot (salted/fermented oyster), B 1.1825±0.0311b,c
Eorigul Jeot (salted/fermented oyster), C 0.4319±0.005c,d
Fish cutlet, frozen ND
Fish cutlet, frozen, air-fried ND
Fish cutlet, frozen, deep-fried ND
Flyingfish, roe, frozen 0.2873±0.0023d
Flyingfish, roe, frozen, steamed ND
Galchisok Jeot (salted/fermented hairtail guts), A 0.0426±0.0021d
Galchisok Jeot (salted/fermented hairtail guts), B 0.1251±0.0001d
Galchisok Jeot (salted/fermented hairtail guts), C 0.0536±0.0019d
Granulated ark shell, canned ND
Mackerel 0.1639±0.0022d
Melania snail, steamed, frozen 0.2117±0.0015d
Melania snail, steamed, frozen, broth ND
Meoljut sauce (salted/fermented fish Sauce), A 1.3201±0.0071a,b
Meoljut sauce (salted/fermented fish Sauce), B 0.8057±0.0026b,c,d
Meoljut sauce (salted/fermented fish Sauce), C 0.605±0.0103b,c,d
Myeolchi yukjeot (salted/fermented anchovy sauce), A 0.0758±0.0013d
Myeolchi yukjeot (salted/fermented anchovy sauce), B 0.2478±0.0048d
Myeolchi yukjeot (salted/fermented anchovy sauce), C ND
Pan-fried pollock (Dongtaejeon), frozen 0.4682±0.0206c,d
Pan-fried pollock (Dongtaejeon), frozen, cooked 0.4103±0.0057c,d
River snail meat, steamed 0.148±0.0002d
Shrimp cutlet, frozen 0.0862±0.0008d
Shrimp cutlet, frozen, air-Fried 0.1257±0.0001d
Shrimp cutlet, frozen, deep-Fried 0.1196±0.0024d
Smoked squid 0.1122±0.0034d
Spanish mackerel 0.0586±0.001d

1) All values are mean±SD (n=3).

2) Means with different superscript letters (a-d) are significantly different by Duncan’s multiple range test at p<0.05.

3) ND, not detected.

Download Excel Table

4. 요약

육류 및 어패류는 영양소 섭취에 있어 필수적인 식품군으로서 많은 소비가 이뤄지는 추세이나, 육류 및 어패류에 함유된 판토텐산의 함량에 관한 연구는 미비한 실정이다. 따라서 본 연구는 HPLC를 이용하여 판토텐산 함량을 정량적으로 분석하였으며, 직선성, 선택성, 분석 감도, 정확성, 반복성을 통해 분석법을 검증하였다. 본 연구는 0.999 이상의 우수한 직선성을 나타냈으며, 검출한계와 정량한계는 각각 0.001 μg/mL, 0.003 μg/mL로 고감도 검출이 가능한 것을 증명하였다. 육류에서는 소의 부산물 중 생간이 3.5833 mg/g으로 가장 높은 판토텐산 함량을 나타냈으며, 닭고기 중에서는 껍질을 포함한 생 닭다리가 1.5170 mg/g으로 많은 판토텐산을 함유하고 있었다. 돼지고기 중, 하몽에 판토텐산 함량은 3.2360 mg/g이었으며, 소의 생간 다음으로 가장 높은 판토텐산 함량을 나타냈다. 어패류에서는 어리굴젓(상품 A)이 1.9581 mg/g으로 높았다. 본 연구 결과는 많은 소비가 이뤄지는 육류와 어패류 식품군에 함유된 판토텐산 함량에 대한 정보를 제공하며, 국민의 섭취 패턴을 분석하는 기초자료로서 활용될 것으로 기대된다.

Acknowledgements

None.

Conflict of interests

The authors declare no potential conflicts of interest.

Author contributions

Methodology: Park E, Choi Y. Investigation: Yu J, Lee JA. Formal analysis: Yu J, Kim YJ, Lee JS. Writing - original draft: Yu J. Writing - review & editing: Kim YH.

Ethics approval

This article does not require IRB/IACUC approval because there are no human and animal participants.

Funding

This study was carried out with the support of “Cooperative Research Program for Agriculture Science and Technology Development (project no. RS-2023-00229794)” Rural Development Administration, Republic of Korea.

References

1.

Ahmad RS, Imran A, Hussain MB. Nutritional composition of meat. Meat Sci Nutr. 61:61-75 2018;

2.

Albuquerque TG, Oliveira M, Sanches-Silva A, Bento AC, Costa HS. The impact of cooking methods on the nutritional quality and safety of chicken breaded nuggets. Food Funct. 7:2736-2746 2016;

3.

Ali M, Lee SY, Park JY, Jung S, Jo C, Nam KC. Comparison of functional compounds and micronutrients of chicken breast meat by breeds. Food Sci Anim Resour. 39:632 2019;

4.

AOAC. AOAC Guidelines for Single Laboratory Validation of Chemical Methods for Dietary Supplements and Botanicals. Association of Official Agricultural Chemists International. MD, USA: 2002

5.

AOAC. Official Methods of Analysis of AOAC International. 20th edAssociation of Official Analytical Chemists. Gaithers-burg, MA, USA: 2016

6.

Bi J, Lin Z, Li Y, Chen F, Liu S, Li C. Effects of different cooking methods on volatile flavor compounds of chicken breast. J Food Biochem. 45:e13770 2021;

7.

Feddern V, Kupski L, Cipolatti EP, Giacobbo G, Mendes GL Badiale-Furlong E, Souza-Soares LA. Physico-chemical composition, fractionated glycerides and fatty acid profile of chicken skin fat. Eur J Lipid Sci Technol. 112:1277-1284 2010;

8.

Fisinin VI, Ismailova DY, Volik VG, Lukashenko VS, Saleeva IP. Deep processing of collagen-rich poultry products for different use. Agric Biol. 52:1105-1115 2017;

9.

Gerber N, Scheeder MRL, Wenk C. The influence of cooking and fat trimming on the actual nutrient intake from meat. Meat Sci. 81:148-154 2009;

10.

Hee SY. New nutritional concepts of vitamins and minerals. Korean J Pediatr. 48:12 2005;

11.

Hosomi R, Yoshida M, Fukunaga K. Seafood consumption and components for health. Glob J Health Sci. 4:72 2012;

12.

Islam MA, Park E, Jeong B, Gwak YJ, Kim J, Hong WH, Park SJ, Jung J, Yoon NA, Kim YK, Chun J. Validation of vitamin B5 (pantothenic acid) and B6 (pyridoxine, pyridoxal, and pyridoxamine) analyses in seafood. J Food Compos Anal. 109:104518 2022;

13.

Ivanovic J, Baltic MZ, Janjic J, Markovic R, Baltic T, Boskovic M, Jovanovic D. Health aspects of dry-cured ham. Sci J Meat Technol. 57:43-50 2016;

14.

Kim CJ, Chae YC, Lee ES. Changes of physico-chemical properties of beef tenderloin steak by cooking methods. Korean J Food Sci Ani Resour. 21:314-322 2001;

15.

Kim NY, Eom HR, Kim CG, Kim SJ, Kim DH, Moon JH. Changes in meat demand system due to COVID-19. J Foodserv Manag Soc Korea. 24:199-226 2021;

16.

Kim YM. The manufacturing technology and quality control of fermented seafood products (Jeotgal). Bull Food Technol. 9:65-86 1996;

17.

Korea Health Industry Development Institute. Distribution of intake by food group. Available from:https://www.khidi.or.kr/kps/dhraStat/result9?menuId=MENU01662&year=2022 AccessedMar. 7, 2025

18.

Kwak CS, Park JH, Cho JH. Vitamin B12 content using modified microbioassay in some Korean popular seaweeds, fish, shellfish and its products. Korean J Nutr. 45:94-102 2012;

19.

Lee JY, Surh JH. Effect of various cooking methods on the antioxidant activity and the oxidative stability of fish balls made with the addition of turmeric powder. J Food Sci Nutr. 51:1074-1083 2022;

20.

Lee KH, Kim JH, Cha BS, Kim JO, Byun MW. Quality evaluation of commercial salted and fermented seafoods. J Korean Soc Food Sci Nutr. 31:1427-1433 1999;

21.

Marinac Pupavac S, Kenoel Jovanovic G, Linsak Z, Glad M, Traven L, Pavicic Zezelj S. The influence on fish and seafood consumption, and the attitudes and reasons for its consumption in the Croatian population. Front Sustain Food Syst. 6:945186 2022;

22.

MFDS. Micronutrient test method. Available from:https://various.foodsafetykorea.go.kr/fsd/#/ext/Document/FC AccessedMar. 5, 2025

23.

MOHW, KNS Dietary Reference Intakes for Koreans 2020. Ministry of Health and Welfare, The Korean Nutrition Society. p p. 16 2020;

24.

Moon DH, Yong KS, Lee DY, Kim JJ. Analyzing determinants of rice consumption: An application of age-period-cohort model. J Rural Dev. 46:1-19 2023;

25.

NIAS. National Institute of Animal Science. Consumer consumption patterns and needs assessment for livestock products. Available from:https://www.nias.go.kr/front/siHumYeonGooBoGoSeoView.do?cmCode=M180906193631997&cn=TRKO202400012219 AccessedMar. 6, 2025

26.

Omojola AB, Ahmed SA, Attoh-Kotoku V, Wogar GI. Effect of cooking methods on cholesterol, mineral composition and formation of total heterocyclic aromatic amines in Muscovy drake meat. J Sci Food Agric. 95:98-102 2015;

27.

Park KY, Yang MH, Hong GH, Lee SY, Lee HS, Park BY. Salt kinds and their health benefits. Food Ind Nutr. 28:35-48 2023;

28.

Parlasca MC, Qaim M. Meat consumption and sustainability. Annu Rev Resour Econ. 14:17-41 2022;

29.

RDA. Rural De-velopment Administration. 10th Revision Korean Food Composition Table. Jeon-ju, Korea. p p. 227231-243 2021;

30.

Sabbagh M, Gutierrez L, Lai R, Nocella G. Consumer intention towards buying edible beef offal and the relevance of food neophobia. Foods. 12:2340 2023;

31.

Sadecka J, Karasova G, Polonsky J. Determination of pantothenic acid in food by capillary isotachophoresis. Eur Food Res Technol. 216:440-444 2003;

32.

Said HM. Water-soluble vitamins. World Rev Nutr Diet. 111:30-37 2015;

33.

Sampedro A, Rodriguez-Granger J, Ceballos J, Aliaga L. Pantothenic acid: An overview focused on medical aspects. Eur Sci J. 11:21 2015;

34.

Sanvictores T, Chauhan S. Vitamin B5 (pantothenic acid). In: StatPearls [Internet]. StatPearls Publishing Co. Treasure Island, FL, USA: 2024

35.

Shon DH, Park YS, Bae GW. An enzyme-linked immunosorbent assay for detection of pantothenic acid. Korean J Food Sci Technol. 32:1009-1014 2000;

36.

Statistics Korea. Survey on fisheries production trends. Available from:https://kosis.kr/statHtml/statHtml.do?orgId=101&tblId=DT_1J22001 AccessedMar. 7, 2025

37.

Vieira C, Silva M, Simoes M, Rodrigues G, Albuquerque T, Ramalho R, Pereira P. Effect of different cooking methods on the content of total vitamin C, ascorbic acid and dehydroascorbic acid of the galega kale. Ann Med. 53:S136-S136 2021;

38.

Wojtczak L, Slyshenkov VS. Protection by pantothenic acid against apoptosis and cell damage by oxygen free radicals-the role of glutathione. Biofactors. 17:61-73 2003;

39.

Yim DG, Hong DI, Chung KY. Physico-chemical changes of dry-cured ham during the curing, drying and aging stage. J Agric Life Sci. 49:197-204 2015;

Food Science and Preservation (FSP) reflected in Scopus

As of January 2024, the journal title has been changed to Food Science and Preservation (FSP).
We are pleased to announce that this has also been reflected in Scopus.
https://www.scopus.com/sourceid/21101210730
We look forward to your interest and submissions to the journal.
Thank you.


I don't want to open this window for a day.