1. Introduction
Starch is a polymer consisting of large number of monosaccharides linked by glycoside bonds and are an important storage agent and energy source in plants. Carbohydrates are a major source of energy consumed by animals and constitute a large part of their diet (Copeland et al., 2009; Tharanathan, 2002). Most water-soluble starches are absorbed in the form of glucose by the digestive system. However, some insoluble starches are not digested and travel to the intestine. These insoluble starches are called resistant starches (RSs) (Raigond et al., 2015). The starch is not digested because it changes due to physical or chemical factors in its environment, or its structure makes it difficult for enzymes to access it. RS plays a role similar to that of fiber in the gut and improves gut health with low digestion and absorption rates. It is also known to reduce blood sugar and insulin response after meals by interfering with digestion and absorption of digestible starch (Nugent, 2005). Recently, it has been reported that RS can also help prevent obesity, inhibit cardiovascular diseases, and lower the pH of the intestine by producing butyric acid through the action of bifidobacterium in the large intestine. This can help prevent colorectal cancer and increase the number of bowel movements. Accordingly, RS is being studied extensively with the focus being on its use as a dietary and health functional food (Cassidy et al., 1994; Leitch et al., 2007; Sorndech et al., 2019; Załȩski et al., 2013).
RS exists in five forms. RS1 is not digestible and is present in foods such as potatoes, bananas, and high-amylose corn starch. RS2 has a B-type crystal structure, which is attributable to the aging of amylose upon heating. It can be further classified into RS3, a starch obtained by chemical modification; RS4, a modified starch that is difficult to digest through chemical denaturation; and RS5, a starch that is in the form of an amylose-lipid complex formed by the incorporation of the hydrophobic group of fat within the spiral structure of the amylose of starch (Haralampu, 2000). In the industry, RS 2-4 are used, generally, and heating before gelatinization is a particularly suitable treatment for RS4, as it increases the conversion rate of the RS (Sang and Seib, 2006; Waduge et al., 2006). RS absorbs less water than dietary fiber and is not decomposed by the digestive enzymes in the human body. In addition, like dietary fiber, it is digested slowly in the large intestine through the lower part of the gastrointestinal tract. It is also known to reduce the postprandial blood sugar and insulin responses by affecting the environment of the intestinal bacteria as well as increasing the stool volume and interfering with the digestive absorption of digestible starch (Bodinham et al., 2014; Johnston et al., 2010; Kwak et al., 2012).
Various methods for quantifying RS have been reported and are currently being used for the development of food materials. However, the optimization of these quantification methods, whose choice depends on the type and source of the RS being analyzed, in necessary. Analysis based on the conventional Association of Official Analytical Chemists (AOAC) method uses enzymes that break starch into glucose. The RS that was not degraded was precipitated with ethanol and then weighed. However, even though this method is simple, the weighing of the precipitated sediment can be inaccurate and adversely affect the reliability and reproducibility of the measyrements.
Meanwhile, the food industry is developing methods to increase the RS content of various food ingredients with the aim of producing new diet foods. In addition, food materials such as soybeans many withcan undergo lipid peroxidation depending on the storage period and conditions. Several studies have found that the heat treatment of grains increases their RS content and inhibits lipid peroxidation. It has also been reported that hot-water-treated mung beans have a higher RS content. In addition, another legume, namely, the peanut, develops resistance to lipid oxidation when roasted in a home microwave oven (Abbas Ali et al., 2017; Li et al., 2011).
In this study, we modified the existing AOAC method to indirectly determine the amount of RS contained in test samples by measuring the amount of glucose decomposed by enzymes instead of measuring the actual weight of the RS. In addition, we verified that the suitability of the proposed indirect method for screening food materials with a high RS content.
2. Materials and methods
Soybean and rice samples were obtained from Wellbeing LS (Gangneung, Korea). α-Amylase, protease, and amyloglucosidase were purchased from Sigma (St. Louis, MO, USA). Phenyl-3-methyl-5-pyrazolone (PMP) and glucose oxidase/peroxidase (GOPOD) were purchased from Sigma-Aldrich (CA, USA). All the organic solvents high performance liquid chromatography (HPLC) reagents used were purchased from J.T. Baker (NJ, USA), a while the syringe filter used was purchased from Advantec MFS, Inc (Tokyo, Japan).
The AOAC method was performed in the same manner as described by McCleary and Monaghan (2002). In the proposed modified AOAC method, the quantifies a mount of glucose in the supernatant abtained after the precipitation of ethanol was quantified. The rice samples being testeds (0.5 g) was briefly vortexed in a phosphate buffer (pH 6.0) and then shaken at 100°C for 5 min. The solution was then subjected to a heat-stable α-amylase treatment, and subsequnetly incubated at 100°C for 20 min. The pH was adjustedsting the 7.5, and the protease was incubated at 60°C for 30 min to remove the proteins attached to the sugar. Next, titration was performed till the pH was 4.5, and amyloglucosidase was added to the solution and made to react at the same temperature (60°C) for 1 h. Finally, ethanol was added in an amount equal to four times the volume of the solution, and the solution was vigorously vortexed and allowed to stand at 25°C for 1 h. The supernatant was then diluted and made to, react with GOPOD at 37°C for 10 min. The reaction was stopped using 6 N sulfuric acid, and the absorbance was measured at 540 nm.
The test sample was prepared using a one batch one step drying machine provided by the Korea Federation of Rice Bran (Seoul, Korea). Soybeans (500 kg) were placed in the machine, which was preheated at 260°C, and heat-treated at 250°C for 10 min (internal temperature; upper heat temperature 73°C, lower heat temperature 68°C). The Next, the temperature of the infrared jacket was set 70°C, and the sample was treated for 50 min (internal temperature: upper heat temperature: 71°C, lower heat temperature: 69°C). After the heat treatment, the sample was cooled for 11 h to and internal temperature of 25°C. The mixing speed during the treatment was set to 60 ppm. MRS broth enriched in Lactobacillus fermentum LS-210 (KCTC14619BP) was inoculated with 1% of the total sample weight at a concentration of 1.00×10⁹ CFU/mL. The samples was recovered after fermentation at 37°C for 18 h. Next, the treated sample was collected, dried in hot air, and pulverized for analysis. An aliquot containing 0.1 g of the sample was used for the RS analysis.
For the HPLC analysis, 100 μL of each sample was added to 150 μL of 0.3 M NaOH. Next, the sample was mixed with 100 μL of a 0.5 M PMP solution (in MeOH), made to react at 70°C for 1 h, and cooled to 25°C. Subsequently, titration was performed by adding 150 μL of 0.3 M HCl and 5 mL of chloroform. The solution was then shaken vigorously and, allowed to stand this process was repeated three times. The aqueous supernatant generated in the upper layer was separated and centrifuged at 1,500 rpm for 15 min at 20°C. Next, the organic solvent was removed completely, leaving only the aqueous supernatant to be separated, which was then filtered through a 0.45 μm filter and used as the HPLC sample.
HPLC was performed using a TC-C18 column (length: 250 mm; internal diameter, 4.6 mm; particle size: 5 μm; Agilent, USA). The mobile phase consisted of acetonitrile (solvent A) and 0.045% KH2PO, 0.05% triethylamine buffer (pH 7.5) in water, and acetonitrile (90:10, v/v) (solvent B). The analysis was performed with a gradient system using increasing concentrations of solvent A: 0 min, 6% (v/v) A; 0-4 min, 6% (v/v) A; 5-20 min; and 12% (v/v) A. HPLC was performed at 35°C, and the compounds were detected at 245 nm. The flow rate was 1.0 mL/min.
The degree of lipid peroxidation was measured using an EZ-Lipid Peroxidation (TBARS) Assay Kit (DoGen Bio, Seoul, Korea). Briefly, 50 mg of the test sample was homogenized for 10 s in 1 mL of PBS using a homogenizer. After homogenization, the sample was transferred to a new tube, and 200 μL of a solution containing 5 g of trichloroacetic acid was dissolved in 6 mL of PBS. After the sample had been allowed to stand at 25°C for 5 min, it was subjected to centrifugation (15,000 rpm, 5 min, 4°C). Subsequently, the supernatant was transferred to a new tube, and 200 μL of both the supernatant and the indicator solution were mixed and incubated in an oven at 65°C for 45 min. Finally, the supernatant (200 μL) and an acid reagent (200 μL) were mixed and reacted under the same conditions, and the absorbance was measured at 530 nm.
3. Results and discussion
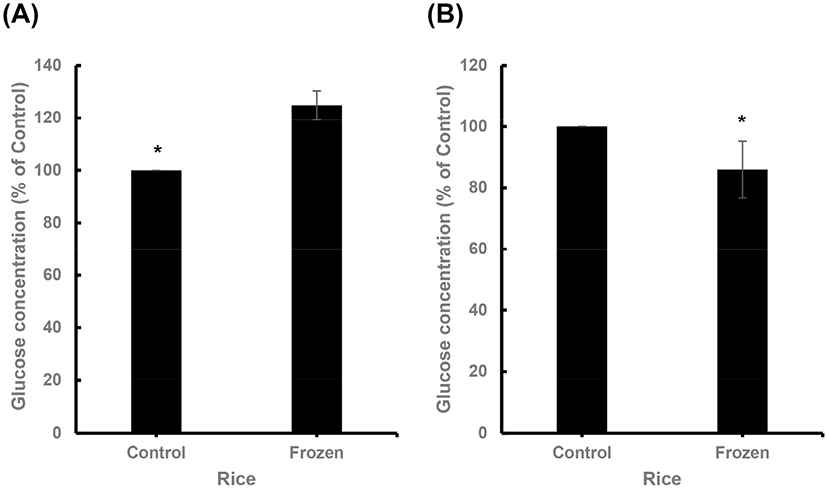
It has been reported that the conversion rate to RS higher in frozen rice is higher than that in warm rice (Ren et al., 2016). In this study, the RS in rice was measured to evaluate the effectiveness of the proposed modified AOAC method over the existing AOAC method. In the case of the conventional AOAC method, frozen rice showed a higher RS content (approximately 4.7 mg) than that of warm rice (approximately 1%) (Fig. 1(A)). However, the proposed modified AOAC method, the amount of glucose present in warm rice was found to be higher (6.5 μg/mL) (Fig. 1(B)). Moreover, the difference in the RS conversion rates was similar to that seen in the case of the original AOAC method.

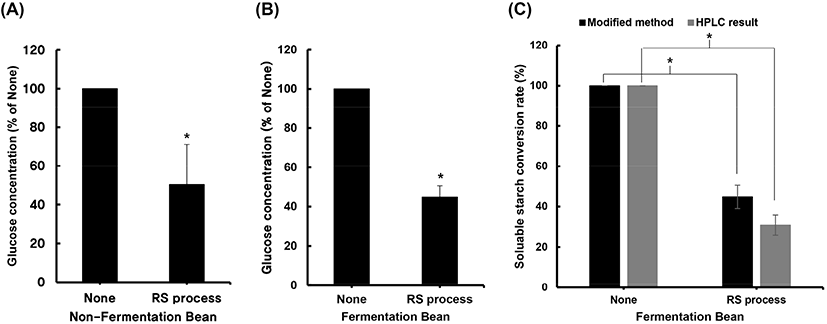
To further evaluate the effectiveness of the modified AOAC method, the RS content in soybeans was measured. For this, we analyzed the RS content of soybean samples heat-treated and subsequently incubated with LS-210 and compared it with that of soybean samples that were only heat-treated and not incubated with LS-210 (Fig. 2(A)). It was expected that the incubation treatment would increase the RS content of soybeans (Dupuis et al., 2014). The measurements were performed using the same process as that employed for the rice analysis. The glucose content of the processed soybean samples was lower than that of the control group (Fig. 2(B)). This result suggests that the modified RS measurement method is effective for use with cereals and soybeans. In addition, the difference in the RS contents of the control group and that incubated with LS-210 was not significant. Therefore, the treatment with the lactic acid bacteria did not affect the RS content and only affects the quality of food, including its organoleptic properties (Sharma et al., 2020). The glucose supernatant obtained by the modified AOAC method was derivatized with PMP and analyzed by HPLC. The glucose content in of the untreated group was high in the raw samples. The on the other hand, the RS conversion rate increased in the case of the treatment group (Fig. 2(C)).

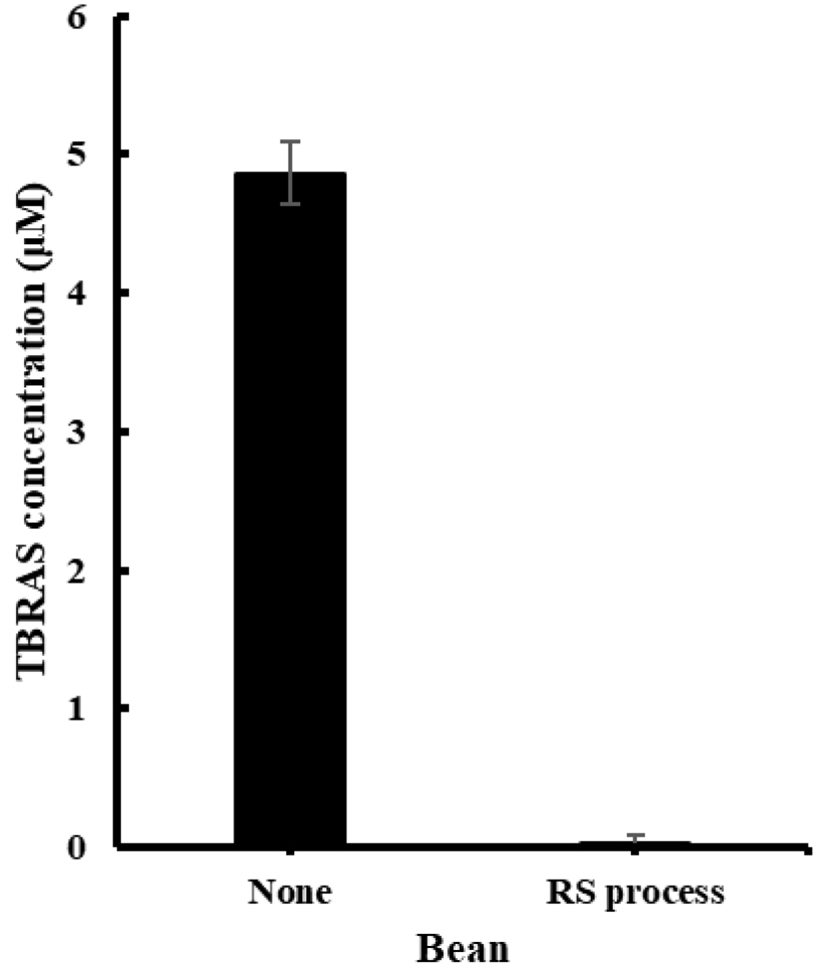
We also evaluated the degree of lipid peroxidation in soybean samples adried using hot air. The degree of lipid peroxidation is used as an index to measure the freshness of food samples and can be determined by measuring the amount of malondialdehyde, which is the final degradation product of lipids. We confirmed that the rate of lipid peroxidation was of the samples subjected to fermentation with lactic acid bacteria and a subsequent drying process was six times lower than that of the untreated samples (Fig. 3).

4. Conclusions
RS absorbs less water than dietary fiber and is not decomposed by the digestive enzymes in the human body. It is slowly digested in the large intestine through the lower part of the gastrointestinal tract. In addition, it is known to reduce the postprandial blood sugar and insulin responses by affecting the environment and thus the community of intestinal bacteria, increasing the stool volume, and interfering with the digestion and absorption of digestible starch. Therefore, there are significant efforts underway to develop of functional health foods based on RS (Bodinham et al., 2014; Johnston et al., 2010; Kwak et al., 2012).
In this study, a new method for quantifying RS was proposed with the aim of furthering the industrial use of RS. Compared with the conventional AOAC method, which measures RS itself, the proposed method measures the amount of glucose decomposed by glycolytic enzymes to indirectly calculate the amount of RS converted (Mccleary and Monaghan, 2002). We compared the two methods by measuring the amount of RS converted in rice to evaluate the effectiveness of the proposed method. The results showed that the RS content and conversion rate for frozen rice were high in the case of both methods, and with the results obtained using the two methods showing similar trends. In addition, the RS content of soybean samples that were heat-treated was also measured. Similar to the case for rice, the conversion rate of RS was higher in the treatment group compared with that for the control group. However, subjecting the samples treated with lactic acid bacteria did not influence their RS content. This was confirmed by the results of HPLC analysis, thus underlining the effectiveness of the modified AOAC method. In the industry, RSs 2-4 are used extensively, and a heat treatment before gelatinization is particularly suitable for RS4, as it increases the RS the conversion rate (Sang and Seib, 2006; Waduge et al., 2006).
Therefore, we believe that the modified AOAC method for RS quantification is suitable for exploring new methods for processing RS-rich food materials. In addition, the method could successfully determine the RS content and degree of rancidity inhibition in heat-treated soybean samples, suggesting that it also should aid the development of new functional food materials.


