Introduction
Blueberries (Ericaceae and Chlorella) are mainly distributed in North America but cultivated throughout the world (Westwood, 1993). The fruits are regarded as one of the world's top 10 super foods by the New York Times (Hwang and Ko, 2010), and can be consumed raw or incorporated into various processed foods, such as jams, jellies, muffins and cakes, as functional ingredients to attract consumer interest (Lee and Lee, 2007; Lee et al., 2008). The anthocyanins, flavonoids and lycopene present in blueberries are known to have excellent antioxidant properties, enhance vision and immunity, and aid in the prevention of stroke (Park et al., 2012). As the domestic production and import of blueberries increase, farmers are spurring the development of processed foods to promote consumption.
Blueberries are soft and prone to mechanical damage during harvesting and transportation (Xu et al., 2015). Due to their high water content, blueberries are also susceptible to food degradation factors, such as microbial growth, biochemical changes, and chemical reactions. Drying is widely used to overcome this issue (Park et al., 2014). Drying reduces the moisture content (MC) of food, which aids in preventing spoilage and degradation by microorganisms and enzymes, thereby contributing to improved shelf life and expanding the options of food product development (Shin et al., 2015).
Dried blueberry production technology has been well studied in the context of drying conditions, such as the drying method and drying temperature, because the MC of dried blueberries is an important indicator that determines the texture and quality of the product. As, all dry products must have a uniform MC non-destructive techniques are desired for measuring the quality of dried blueberries.
Hyperspectral imaging (HSI) is a non-destructive method. This technique combines conventional imaging and spectroscopy techniques and can provide both spatial and spectral information from the target, which is extremely useful for evaluating individual food items (Qin et al., 2013). HSI is an invaluable technique for investigating the local distribution of components and for monitoring particular chemicals using near-infrared rays (Huang et al., 2014). To monitor the quality, a large amount of food must be checked in real time. In conventional quality measurement, the refractometer is often used for total soluble solids (TSS) content and the oven for water content; therefore, only a fraction of the target can be monitored, and the analyzed food is damaged and becomes inedible. Other advantages of non-destructive techniques are that there is no need for pre-treatment of samples, and many foods can be analyzed at once within a short time. In addition, a non-destructive technique is less affected by the proficiency of the researcher. This system is more practical for the food industry because it is suitable for conveyor systems (Iqbal et al., 2014). Gowen et al. (2007) demonstrated the usability of HSI in the visible and near-infrared (NIR) wavelength regions (350-1700 nm) for assessing quality parameters of agricultural (corn, wheat, rye, lentils, soya bean, canola) and horticultural (apple, potato, cucumber, citrus, peach, strawberry, and cherry) crops. Recently, hyperspectral image analysis and chemometrics have been used to predict the MC of various foods (Lin et al., 2019; Wei et al., 2019; Xu et al., 2019). Pu and Sun (2015) visualized the distribution of moisture during microwave vacuum drying of mango slices using Vis-NIR HSI. To non-destructively monitor and control the drying process, Nguyen-Do-Trong et al. (2018) evaluated the quality of dried banana slices using VNIR hyperspectral reflectance imaging. The color and MC of vegetable soybeans during drying were also predicted using hyperspectral imaging technology (Huang et al., 2014)
There have been studies on the prediction of internal bruising, maturity, foreign matter, nutraceutical content and firmness of blueberries using NIR spectroscopy (Fan et al., 2017; Leiva-Valenzuela et al., 2014; Sugiyama et al., 2010; Yang et al., 2014). Although there have been many studies using HSI to analyze raw blueberries, there have been no studies on the quality characteristics of dry-processed products.
Therefore, this study aimed to (i) determine whether the degree of blueberry drying could be predicted through HSI and (ii) develop a prediction model for the MC of dried blueberries during drying using HSI, which is a non- destructive and rapid detection tool.
Materials and methods
Ethanol (EtOH; Duksan Pure Chemical Company, Ansan, South Korea) was used to extract samples for antioxidant activity analysis. Folin-Ciocalteu reagent (Junsei Chemical Company, Tokyo, Japan) and diethylene glycol (Samchun Pure Chemicals Company, Pyeongtaek-si, South Korea) were used to analyze the content of total phenolic compounds (TPC) and total flavonoid content (TFC), using gallic acid (Sigma Chemical, Co., St Louis, MO, USA) and naringin (Sigma Chemical Co.) as references.
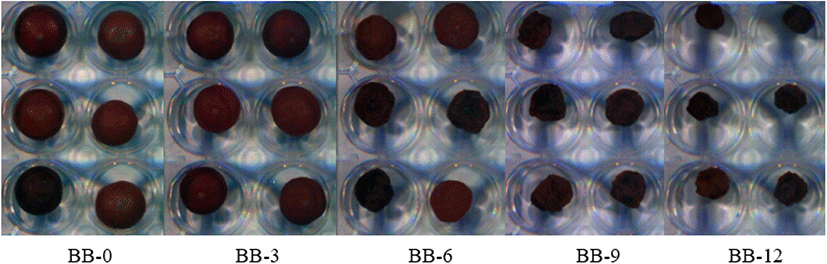
Blueberries were harvested in May and June 2019 in Korea, and they were purchased from local markets in Daegu. In order to reduce the error of the experiment, only those in good condition and weighing 1.9±0.2 g were selected and used. Shin et al. (2015) reported that the lower the drying temperature, the brighter and more purple the fruit, and the less the change in color; therefore, the blueberry in this study were dried at 35°C-40°C using a climatic chamber (JSRH-150CP, JS Research Inc., Gongju-si, Korea). The blueberries were divided into five groups based on drying time (days): 0 (BB-0), 3 (BB-3), 6 (BB-6), 9 (BB-9) and 12 (BB-12). To accurately determine the degree of drying, the weights were selected to be 1.9±0.2 g (BB-0), 1.5±0.2 g (BB-3), 1.1±0.2 g (BB-6), 0.7±0.2 g (BB-9) and less than 0.5 g (BB-12), respectively. Even if the drying time is the same, the MC may not be constant. The groups were classified by weight to deliberately vary the MC by group. Hyperspectral images were acquired for each group. Altogether, 670 blueberries (134 samples per group) were used for the In partial least-square discriminant analysis (PLS-DA) to determine and predict the degree of drying based on the MC. In partial least-squares regression (PLSR) for predicting MC, 150 (30 samples per group) of the blueberries purchased from the local market were used to develop an MC prediction model.
The MC, pH, hardness and strength, total soluble solids content, color, TPC content, TFC and microbiological content of the blueberries were analyzed. The MC (%) of the dried blueberries was calculated using the following formula:
where Wc and Wd denote the fresh and dry mass weights of the blueberries, respectively. The TSS content and pH were measured using a refractometer (Master-α, Atago Co., Tokyo, Japan) and a pH meter (Orion 3-Star, Thermo Electron Co. Waltham, MA, USA), respectively, after dilution (1:4, v/v) with distilled water and grinding using a homogenizer (AM-9, Nihonseiki Kashima Co., Ltd., Japan).
The hardness and strength of the blueberries were measured using a rheometer (Compac-100II, SunScientific Co., Tokyo, Japan) by compressing 20% of the sample using a 3- mm-diameter probe.
The color values of blueberries were measured using a colorimeter (CR-400, Minolta Co., Osaka, Japan) calibrated against a standard white plate (L*=97.79, a*=−0.38, b*= 2.05). The L*a*b* color values refer to brightness, redness, and yellowness, respectively.
To analyze the TPC and TFC of blueberries, a sliced sample (4 g) was extracted with 76 mL of 50% EtOH in a shaker at 45°C for 24 h. The extracts were then filtered (No. 4 filter paper; Whatman, Tokyo, Japan). The filtrates were evaporated on a rotary evaporator (RV 10 Digital, IKA, Staufen, Germany) to determine the dry weight, which was then diluted with 50% EtOH. TPC content was analyzed using a modification of the method described by Singleton et al. (1999). All experiments were performed in triplicates. Standard curves of gallic acid and naringin were constructed to calculate the TPC content and TFC, respectively.
Microbiological analysis of the dried blueberries was carried out by adding nine-fold the amount of peptone to 3.5 g of the sample and shaking at a constant rate for 2 min. The extracts were diluted using the 10-fold method, and 1 mL of each dilution was added to a Petri dish. Plate count agar and potato dextrose agar were poured and cultured at 35±1 and 25±1°C, respectively. The counts are expressed as log CFU/g.
Duncan’s multiple range test and Pearson’s correlation analysis were performed using SPSS (14.0, SPSS, Inc., Chicago, IL, USA) to identify significant differences between the results (p<0.05).
Samples were placed on a white background plate and line-scanned using a Vis/NIR HSI system (IMEC Kapeldreef 75, 3001 Heverlee, Belgium) with a spectral range of 470- 900 nm and a resolution of 2,048×1,088. The number of spectral bands was 150, and the pixel size was 5.5 μm×5. The spectrometer was installed with six halogen lamps of 20 W each. The frame rate during spectral acquisition was 10, and the exposure time during the measurement was 10 s. All raw images were calibrated using white and dark images as follows:
where Ical is a calibrated image, Iraw is a raw image, Idark is a dark image, and Iwhite is a white image. The Idark value is the spectrum obtained after closing the camera lens, and Iwhite is the spectrum of the white plate. To acquire sample spectra with removed background, the region of interest (ROI) function was applied in the ENVI software (version 4.8, Harris Co., Melbourne, FL, USA). The extraction of ROIs depended on human observation.
The extracted data should be used for analysis after removal of scattered light, unnecessary light sources in the surrounding environment, changes in the condition of the apparatus, and noise caused by the introduction of the sample. Bae et al. (2016) noted that it is possible to obtain more accurate spectra by performing various data preprocessing techniques such as normalization, smoothing, multiplicative scatter correction (MSC), standard normal variate (SNV) analysis, and the Savitzky-Golay (SG) method. Normalization makes the data distribution similar and corrects for the change of conditions. Smoothing replaced a certain range of values with the mean value in order to represent a spectrum with noise as a smooth curve. SNV and MSC pre-processing removed the influence of light scattering due to irregular shapes and sizes. SG-1 and SG-2 differentiation methods eliminated the movement of the baseline of the spectrum or emphasized the spectral characteristics.
PLSR, a common chemometric method, is a popular multivariate calibration technique for quantitative analysis (Burnham et al., 1999). PLS-DA is a PLS method, which is a regression model analysis that identifies groups by setting virtual variables. The PLS regression method not only obtains a regression equation using the principal components of the spectral data, but also predicts new variables by considering the measured dependent variables. Because both independent and dependent variables are used, discrimination is performed more stably than analysis of principal components using only independent variables. The β-coefficient calculated in the PLS-DA model was used to predict the wavelength affecting the determination of the dryness of blueberries, and the PLS-DA was executed using Unscrambler (10.5, CAMO, Trondheim, Norway). As explained in section 2.2., in this study, the MC of blueberries was classified into five levels, and the five levels were confirmed by PLS-DA. Approximately 70% of the 670 blueberries were used to develop the calibration model, and 200 were applied to the developed model to confirm the discrimination accuracy.
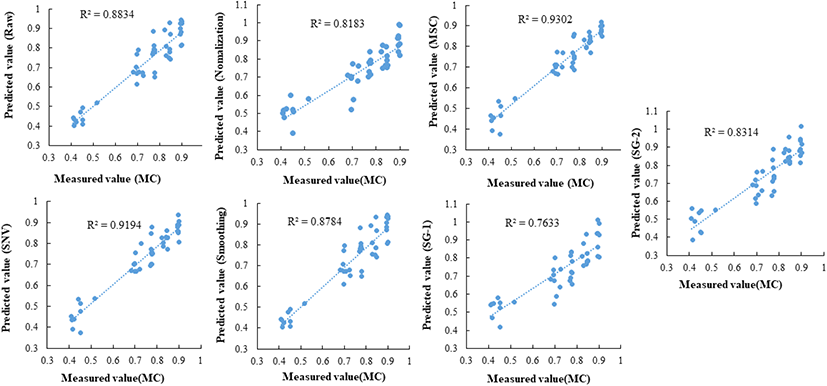
PLSR was employed to predict the MC of dried blueberries. A regression model was derived using the HSI spectrum and measured MC of each blueberry. The PLSR model was calibrated using data from 70% of the 150 samples. The remaining 30% of the samples were used to validate the model. The accuracy of the developed model was estimated using the coefficients of calibration (R2c), full cross-validation (R2cv), root mean square error of calibration (RMSEC), and root mean square error of full cross-validation (RMSECV). The accuracy of the prediction model is represented by R2p. All model development procedures were conducted using Unscrambler X software (10.2, Camo, Oslo, Norway).
Results and discussion
The physicochemical data for the blueberries are presented in Table 1. From the analysis of the quality characteristics, MC was found to decrease significantly after the drying period (p<0.05), and TSS content did not show any significant change until the 6th day of storage, but displayed an increasing trend starting from the 9th day of storage. The pH was not affected by the drying time, whereas TPC and TFC showed a tendency to decrease significantly. Lightness (L*) decreased with time, whereas yellowness (b*) increased. As it dries, the blueberry becomes sticky and darker in color as the moisture and sugar inside the pulp move to the pericarp. Fruit firmness is one of the most critical quality indices of blueberries (Angeletti et al., 2010; Chen et al., 2015; Chen et al., 2017). Both the hardness and strength rapidly decreased until the 6th day of drying. This is because blueberries initially lose their hardness and strength as the texture of the flesh degrades. Softening is one of the main reasons for the high perishability and susceptible spoilage of blueberries during postharvest storage and influences fruit quality, storage life, and transport ability (Chen et al., 2015; Deng et al., 2014; Paniagua et al., 2013). Blueberry’s softening is primarily caused by the degradation of cell wall components, including water-soluble pectin, cellulose, and hemicellulose. During storage of blueberries, the water-soluble pectin content increases, and the contents of cellulose and hemicellulose decrease. (Liu et al., 2019). However, they became harder as the MC decreased rapidly from the 9th day of drying. This is consistent with the study of Kang et al. (2004), who reported that the hardness decreased and then increased again due to excessive evaporation of moisture in dried persimmons during the drying process.
Microbiological analysis showed that bacteria were rarely produced throughout the experimental period, and the number of molds and yeasts was similar, except for the 9th day of drying. Jung et al. (2014) reported that total aerobic bacteria, yeast, and molds occurred at approximately 4 log CFU/g in the control group when stored for 12 days under refrigeration. This result is different from the results of the current study. In this study, it is considered that the bacterial occurrence was reduced because the MC and water activity both decreased as the blueberry dried.
Blueberries contain sucrose, glucose, and fructose, with sucrose as the main sugar (Jain et al., 2011; Rai et al., 2007). The TSS content of the blueberries varied between 55° and 65° Brix. Since blueberry fruit does not contain starch to support soluble sugar synthesis after harvest, the slight increase in TSS may be a consequence of cell wall degradation (Cordenunsi et al., 2003).
The classification results of the PLS-DA model pre- treated with various methods (smoothing, normalization, SNV, multiplicative scatter correction [MSC], SG-1 and SG-2) are shown in Table 2. In this study, the R2c and R2cv of the developed calibration model and cross-validation model using raw data without pre-treatment were higher than 0.91, and R2p determined the drying extent at a high accuracy rate of 0.81. Among the pre-processing methods used in this study, the accuracy of the predictive model was approximately 70% when applying the MSC and SNV preprocessing methods, which yielded the most inaccurate results. However, when the data were pre-processed using the smoothing moving average method, an R2p of 0.81 was shown. In the PLS-DA model for MC determination, smoothing pre-treatment of the spectrum was the most appropriate.
1) SNV, standard normal variate; MSC, multiple scatter correction; SG-1, Savitzky-Golay-1; SG-2, Savizky-Goloy-2.
The original images obtained using the hyperspectral camera are shown in Fig. 1. The mean reflectance pre- treated smoothing of blueberries according to the drying period, as determined by HSI analysis, is shown in Fig. 2. Overall, the longer was the blueberries dried, the lower the reflectance. The β coefficient of the PLS-DA model can be used for meaningful wavelength selection (Cheng and Sun, 2015a). Fig. 2 shows the absolute value of the β coefficient of the smoothed spectra. There were five specific peaks at approximately 706, 790, 827, 868, and 894 nm. Using the β coefficient of the PLS-DA model, the informative wavelength was determined, and the quality characteristics affecting the absorption spectrum of the blueberry were measured. For example, as the primary structural components of the majority of food molecules contain functional groups such, as C-H (organic compounds), N[1]-H (proteins and amino acids) and O-H (water, carbohydrate and fat), these groups are closely related to the overtones and combination bands in the NIR spectral region (Pu et al., 2015).
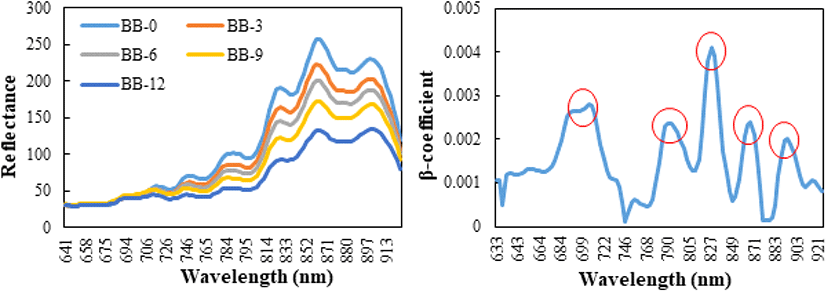
In the current study, the spectral region below approximately 690 nm did not differ between the groups (Fig. 1). The absorption bands at approximately 780 nm were attributed to the third overtone of the O-H stretching generated by water (Cheng and Sun, 2015b). He et al. (2013) also reported that the absorption band positioned at approximately 780 nm in the NIR region was due to the third overtone of O-H stretching.
Therefore, in Fig. 2, the peak around 790 nm is caused by the MC. A peak at approximately 850 nm is usually assigned to the stretching overtones of C-H and N-H, which are associated with proteins, lipids, and other organic compounds (Howard and Kjaergaard, 2006; Tarr and Zerbetto 1989). The TSS content represents the organic molecules, which contain C-H, O-H, C-O, and C-C bonds (Liu et al., 2010). Glucose has an informative region of 840-1,062 nm, where bands resulting from the first overtones of the C-H stretching modes of glucose exist (Workman and Weyer, 2007). Informative regions of 816-1,050 nm were obtained for fructose. These regions correspond to the regions for bands due to the combination of C-H stretching (Osborne et al., 1993). Sugar absorption bands, generally from O-H stretching, and the third and fourth overtones of C-H stretching, occur near strong water absorption regions (Giangiacomo, 2006). This suggests that 827, 868 and 894 nm, shown in Fig. 2, are the peaks caused by the TSS difference between the groups.
A substance substituted with a period (-OH), such as that of one of the hydrogens of the benzene ring (C6H6), is referred to as a phenol. Polyphenols are defined as having two or more hydroxyl groups. Examples include catechins, tannins, anthocyanins, and flavonoids. In this study, the TPC and TFC of blueberries were significantly altered during drying. Therefore, it is considered that this affects the hyperspectral image spectra.
Pearson’s correlation coefficient (r) is commonly used to determine the relationship between two variables (Cha and Kim, 2018). Pearson’s correlations among the physicochemical analysis results are shown in Table 3. Overall, MC and various quality characteristics showed high correlations. Those between MC and lightness, TPC, TFC, and TSS were 0.9 or more, and high correlations between hardness and strength (0.979) and TPC and TFC (0.977) were also determined. Lee et al. (2011) reported that differences in TSS might be related to differences in MC during the drying process, and Shin et al. (2015) observed that the difference in texture of dried blueberries was correlated with the difference in MC during the drying process, which is similar to the results of this study. Pearson’s correlation coefficients can induce quality characteristics that indirectly affect the β coefficient. Therefore, it is expected that the MC of blueberries can be predicted by the above correlation from the tendencies in attributes, such as lightness, TSS, TFC and TPC. The wavelength range at which the absolute value of the β coefficient was high was influenced by the MC, TSS, TFC and TPC content. It can be seen that these wavelength bands are highly correlated with each other.
MC, moisture contents; TSS, total soluble solids; TPC, total phenolic contents; TFC, total flavonoid contents.
The PLSR model was developed using HSI spectra and the respective measured MC values. In total, 105 of the 150 samples were used to create the calibration model. When the MC prediction model was established based on the remaining 30% of the samples that were not used in the model calibration, most of the preprocessing methods showed high accuracy. A prediction model for predicting MC was implemented using spectra with different pre- treatments. The measured MC and predicted moisture are shown in Fig. 3. When MSC and SNV pre-processing were applied, the R2 value was higher than 0.91, indicating a higher prediction accuracy than with the raw data. This result differs from that of the PLS-DA model. Finally, we developed an MC prediction model with high prediction accuracy. These results suggest that HSI techniques can be used to monitor and predict the MC of blueberries during drying. In the future, it is necessary to develop a machine learning system to implement a machine learning system in actural food production, distribution, and storage sites by conducting field demonstration research in which an algorithm using hyperspectral imaging anlaysis is applied to a machine.