1. Introduction
Currently, urban agglomerations house majority of the world’s population, because of increased urbanization and industrialization. The number of pollutants entering the urban environment increases due to many intensive activities (Bilos et al., 2001; Manno et al., 2006). The most prevalent and significant environmental component influencing human health is soil (Duong and Lee, 2011). A wide spectrum of trace or heavy metals is commonly found in high amounts in outdoor soil (Tong and Lam, 2000). A heavy metal is a metallic element that has a specific gravity of 5.0 or greater and is usually poisonous (Hardy et al, 2008). Metal-contaminated soil can impair people’s health when they come into contact with it through skin contact and hand-to-mouth contact, especially when kids unwittingly ingest it in outdoor play area (Saeedi et al., 2012). The concentration of heavy metals on and within plants is influenced by many factors which includes; atmospheric deposition, fertilizer application, and irrigation with waste water etc. (Khairiah et al., 2004; Itanna, 2002).
Heavy metals have long biological half-lives and can amass in human organs, generating harmful side effects. (Jarup, 2003). The effects of high doses of some heavy metals have been enumerated to include low intelligent quotient (IQ) in children, brain, foetus, kidney and nervous system damages caused by lead (Pb), decreased body weight, heart and liver damage and skin irritation caused by nickel, gingivitis, tremors, psychological changes and brain damages caused by copper (Cu) etc. Zinc (Zn) though needed in trace amount in living organisms causes damage to some biological systems and interferes with the body metabolism at excessive levels (Akpe et al., 2018; Lenntech, 2014). Thus, the vegetables consumed by people should have little or no heavy metals contamination to avoid the negative health effects listed above.
Vehicles movement and wind can re-suspend organics, trace metals, other inorganics, mold spores, animal dander, and pollen fragments, resulting in significant sources of air pollution. Under meteorological conditions, particles and associated metals, particularly fine soil, were found to stay suspended in the air for long. Due to observations, particles and associated heavy metals, especially with fine soil, remain suspended in air longer under meteorological conditions (Bilos et al., 2001; Charlesworth et al., 2003; Gupta et al., 2012). Metal pollution in city streets and roadside soil has received a lot of attention around the globe, and research have showed that most soil contains a range of toxic metals (Charlesworth et al., 2003; Ferreira-Baptista and De Miguel, 2005).
Fluted pumpkin (Telfairia occidentalis) is grown primarily in Nigeria, Ghana, and Sierra Leone. It is called Ikong Ubong in Ibibio language while the Igbo people call it Ugu. It is a low-growing creeping vegetable with lobed leaves and long twisting tendrils. It is the most common edible vegetable across many tribes in Nigeria. Rich organic soils are ideal for its growth (Uboh et al., 2011). T. occidentalis is rich in antioxidants, thiamin, riboflavin, and ascorbic acid. Its fresh leaves are utilized in many southern states of Nigeria, most notably for delicacies. The Efik and Ibibio people enjoy eating Edikang Ikong (fluted pumpkin leaves) soup (Idodo-Umeh and Ogbeibu, 2010).
Humans, more than any other organism, have the unique ability to modify the environment to meet their immediate needs as scientific knowledge advances. However, through their actions and inactions, humans are directly responsible for environmental degradation. As human needs increase and technology develops, the capacity to damage various components of the ecosystem-whether intentionally or unintentionally, also grows, leading to environmental pollution.
Pollution is also described as any level of contamination of air, water, or land that is expected to have a major negative impact on a large number of people, animals, or plants in the near future. Pollution and contamination are thus distinguished by their ability to inflict harm. As a result, pollution sources can be roughly separated into natural and manmade sources (Prokhorov et al., 2018).
Anthropogenic (man induced) pollution is a direct consequence of man’s direct or indirect introduction of pollutants into the environment which may stem from some industrial processes, agricultural processes, thermal processes, domestic waste disposal, mining and petroleum exploration.
Vast studies have been carried out on the level of trace metal pollution on street soils in different parts of the world. Heavy metals in agricultural soil irrigated with stable pond runoff in Birjand, Iran, has total hazard index values of 0.91 and 1.10 for adults and children respectively, through the three routes of exposure indicating a non-carcinogenic risk for children and less risk for adults (Karimi et al., 2020). In terms of carcinogenesis, the health risk of humans in Guizhou Province through ingestion of potato was Cr > As > Cd. Cr, with a risk index of less than 1 but remediation is still needed to protect human health (Zhang et al., 2023). Heavy metals (Cd, Co Pb and Zn) levels in mg/kg in the soil and edible vegetables of Yala Urban Area of Cross River State, Nigeria, were within the permissible limits set by WHO (Akpe et al., 2020).
Rapid urbanization together with high precipitation leading to urban floods in Hue city, Vietnam are a significant factor spreading heavy metals in agricultural farms (Viet-Dung et al., 2021). To protect the local food production, wastewater treatment system has been recommended to reduce heavy metal load in cities. Seasonal variation in terms of weather changes has been reported to influence the concentration of dissolved heavy metals in soil and their availability for bioaccumulation by crops grown in them. The total pollution degree was relatively high in autumn and summer due to increased riverine inputs after the rainy season, while relatively low in spring and winter in Liaodong Bay, China (Guo et al., 2022). Geographical dispersion of heavy metals in the soil may depend on different factors like soil texture or pH. However, Cd, Cu, Pb, and Zn levels are substantially greater in Chinese Urban soils than Ni and Cr levels that are lower or equal to crustal values (Li, 2015).
Trace metal pollution in the roadway soil in Eastern Chinese continental metropolis was caused by local enterprises (Zhao et al., 2019). This supports the assertion that heavy metals pollution is mostly caused by anthropogenic activities. Heavy metal pollution in vegetables and their growing soil in Pakshi, Bangladesh were higher than the permitted limits of various international standards, especially arsenic (As) and iron (Fe) (Tasrina et al., 2015). Also, mean content values of Cd, Cr, Ni, Pb, and Zn in roadway dust of Lublin, Poland were quite high when compared to acceptable international standards (Zgobick et al., 2018).
The method of production of edible vegetables may affect the level of heavy metals accumulated by them. Organic produce had higher average amounts of As, cadmium (Cd), Pb, chromium (Cr), and barium (Ba) compared to those in conventional produce among vegetables generally consumed in the United States (Hadayat et al., 2018). Generally, it is a fact that the quality of vegetables in terms of the heavy metals levels in them depends on the concentration of heavy metals in the soil in which they are grown. Pumpkin (T. occidentalis) may not be an exception. However, the bioaccumulation of metals by these vegetables may depend on different factors. Thus, the concentration of heavy metals in the soil where vegetables are grown need to be studied to ensure their quality and safety.
Despite the vast researches carried out on toxic or heavy metals in the world generally and Nigeria in particular as reviewed above, there is currently no readily available report on the heavy or toxic metals concentration and their possible transfer from street soil to edible vegetables like fluted pumpkin grown in them in Calabar Municipality. The aim and objective of this study is to ascertain the quality of pumpkin grown in street farms and consumed in Calabar Municipality and also address the research gap about the toxic metals level and the possible health effect of consuming contaminated edible vegetables grown in street farms or gardens in the city, especially pumpkin the most common edible vegetable in the study area, in order to ensure food quality and safety for the city or urban dwellers in Calabar Municipality.
2. Materials and methods
Concentrated hydrochloric acid (HCl), nitric acid (HNO₃), and sulfuric acid (H₂SO₄) of analytical grade were obtained from British Drug Houses (BDH, Poole, UK). Whatman No. 540 filter paper (Whatman, Maidstone, UK), polyethylene bags, calico bags, brushes, and plastic scoops were used for sample preparation and handling.
The equipment used for sample preparation and digestion included 250-mL digestion flasks, measuring cylinders, an electronic weighing balance (Mettler Toledo, Greifensee, Switzerland), a fume hood, sieves, a mortar and pestle, an oven, beakers, a KDM-A digital thermostatic heating device (Ningbo Hinotek Technology Co., Ltd., Ningbo, China), and a hot plate. Mineral concentrations were determined using an atomic absorption spectrophotometer (WFX-320, Beijing Beifen-Ruili Analytical Instrument Group Co., Ltd., Beijing, China). All instruments were calibrated according to the manufacturers’ instructions before analysis.
Calabar is situated in Cross River State, Nigeria. As a coastal city, it has relatively high rainfall, with a well-drained sandy and loamy soil. The soil pH ranges from 4.06 to 5.20 and acidic according to (Abua et al., 2010; Usang, 2014) and it is a well-drained sandy and loamy soil. It is also characterized by high rainfall like Calabar, both sharing similar weather conditions. The acidic nature of the soil could be as a result of high rainfall leading to the leaching of some cations especially calcium from the surface of the soil (Abua et al., 2010). Due to the town’s high population density and traffic, it registers relatively high transportation activities. As a result, gaseous contaminants from car and truck exhaust are released into the environment. Companies (Lafarge Cement Company, Niger mills, etc.) and small scale business activities have been forced to rely on power generators as an alternate power supply due to the state capital’s epileptic power supply. In the state capital, auto-mechanic workshops, welding and metal building work by the roadside are typical occurrences. Trace metal contaminants are also discharged into the environment or deposited in roadside soil as a result of these operations. These activities make the contamination of the soil and vegetables planted therein with some trace or toxic metals inevitable. Table 1 shows the various sampling locations and their coordinates in terms of latitudes and longitudes.
The soil and vegetable (T. occidentalis) samples were collected from street farms and vegetable gardens located nearer (about 20 metres) to motor parks, market places, roundabouts, highways, and residential areas as the case may be. The control sample was collected at Ikang, a surburb located about 38 km away from Calabar city with little or no anthropogenic activities compared to Calabar city. It has very low traffic, auto-mechanic and welding workshops, construction works and commercial activities compared to Calabar. Soil samples were collected on polyethylene sheets/calico bags put along the roads in each location of the study area using a brush and plastic scoop. Samples were taken from December 2023 to June 2024, spanning both the wet and dry seasons, in order to compare or establish seasonal variations in trace metals inside the city.
Every glassware was painstakingly cleaned with a hot detergent solution, then carefully washed and rinsed with distilled water, and then hexane where necessary to avoid contamination.
A brush and plastic scoop were used to collect soil samples at a depth of around 5 cm, which were then transferred to clean sample bags for examination. All of the materials were dried in an oven at 100-105°C to remove moisture and achieve a consistent weight, then sieved to 63 μm after disaggregation in an agate mortar. To standardize the result by a chemical component, the 63 μm mesh was chosen.
All of the investigations employed chemicals of the analytical reagent grade. The soil samples were digested in a fume cupboard according to one of the methods of Association of Official Analytical Chemist (AOAC) as reported by Akpe et al. (2019) and Akan et al. (2010) thus: 2.0 g of each homogenized soil sample powder was weighed into an acid washed beaker placed in a fume cupboard. 20 mL of aqua regia (a mixture of Conc. HCl and HNO3, in the ratio 3:1) was added to the sample in the beaker. The beaker was covered with a clean dry watch glass and heated at 90°C for about an hour. The source of heat was put off, the beaker allowed to cool, and was removed from the cupboard. The digest was stirred after adding 100 mL of de-ionized water to it and filtered using a filter paper into a 250 mL volumetric flask after digestion. The filtrate (supernatant solution) was used for metals analysis using AAS, for the toxic metals concentration of the supernatant liquid to be determined.
T. occidentalis plant samples were cut with a knife from numerous urban farms, placed in clean sample bags and properly labelled. They were taken to the laboratory for analysis. The leaves were pulverized into a fine powder, baked in an oven at 40°C, and kept for heavy metals analysis in a previously cleaned plastic bottle. Within Calabar Municipality, samples were collected at four different locations. The Geographical Positioning System (GPS) coordinates of the sample collection places were used as a reference.
The soil samples were digested in a fume cupboard according to one of the methods of AOAC as reported by Sobukola et al. (2010) thus: 1.0 g of each pumpkin vegetable sample was put in a beaker and placed in a fume cupboard. The sample was digested by adding 20 mL of Conc. HCl, 10 mL of Conc. HNO3 and 5 mL of Conc. H2SO4 to it in the cupboard. After digestion, the digest in beaker was heated for about 30 minutes in the cupboard. The digest was allowed to cool and 100 mL of de-ionized water was added to it, stirred and filtered to obtain the supernatant solution (filtrate). The supernatant liquid was put into plastic bottle, capped and taken for AAS analysis to determine the metals concentrations in the sample.
The digested soil and vegetable samples were evaluated in the laboratory for the metals (Cr, Fe, Pb, Cd, Zn, and Cu) using an AAS. Working standards were also created by further diluting 1,000 ppm stock solutions of each metal, and by plotting absorbance versus concentration, a calibration curve was created, allowing the concentrations of the metals in sample digests to be calculated. All determinations’ values were documented.
By multiplying the concentration of each element in the soil by the background value, the CF is calculated. As a result, the concentration factor was calculated using equation (1) (Muller, 1969).
Where Ci = metal concentration in the sample under study, while Cb = metal concentration in the background (Pre-industrial or unpolluted area that may serve as Control). On a scale of 1-6, the intensity of contamination can be defined (0 indicates that there is no information available. 1 = none to moderate, 2 = moderate to strong, 3 = strong to extremely strong, 4 = extremely contaminated, 5 = strong to very strong, 6 = very strong) (Muller, 1969).
Hakanson (1980) proposed the ‘degree of contamination’ Cd, which is determined as the total of the CF for each sample to aid in pollution control and n is the number of samples.
The Cd for each sampling site was calculated using the equation (2) above.
The overall degree of contamination in surface layers at a specific sampling site is determined by the Cd. According to Hakanson (1980), contamination levels (m Cd) fall into the following groups thus: Cd < 6 is graded as low level of contamination, 6 < Cd < 12 is graded as moderate level of contamination, 12 < Cd < 24 as considerable level of contamination and Cd > 24 is graded as high level of contamination.
The equation (3) below was used to pinpoint the real source of the harmful metals investigated in soils. It is known as the EF (Zhang et al., 2011).
Where; Mx and Fex = levels of heavy metals and Fe in soil samples, respectively, Mb and Feb = concentrations in baseline reference material.
According to Zhang et al. (2011), EF values between 0.5 and 2 indicate that the metal’s occurrence is due to natural processes, whereas ratios more than 2 indicate that the metal’s occurrence is due to anthropogenic inputs. There are five different types of EF grade based on their EF values as proposed by Zhang et al. (2011) thus: EF < 2 indicates deficiency to mineral enrichment, EF > 2-5 indicates moderate enrichment, EF >5-20 indicates significant enrichment, EF > 20-40 indicates very high enrichment and EF > 40 indicates extremely high enrichment. The contribution of anthropogenic origins generally increases with the EF value (Atiemo et al., 2011; Fagbote and Olanipekun, 2010).
This index was proposed by Tomlinson and his co-workers in 1980. The model is designed to investigate the amount of pollution caused by roadway dust. It appears as concentration-related factors (CF). To calculate the PLI of a site, the PLI obtained from each research location is combined with the nth root of the contamination factors (Ray et al., 2006).
Where the number of metals is n and CF is same as in equation (1).
PLI ranges from zero (no pollution) to ten (highly polluted).
According to Xu et al. (2021), this index can be used to quantitatively describe the possible ecological danger connected to a certain contaminant.
Where Tri is the metal’s harmful reaction factor (Pb = 5.00, Zn = 1.00, Cd = 30.00, Cr = 2.00, Ni = 5.00, Cu = 5.00, Hg = 40.00, Fe = 0.00, As = 10.00) according to USEPA and CFi is the contamination factor.
Ecological risks are defined using five terminologies (Xu et al., 2021). These terminologies are based on ecological risks values thus: ERF < 40 is graded as low potential ecological risk, 40 < 80 is graded as moderate potential ecological risk, 80 < 160 is graded as considerable potential ecological risk, 160 < 320 is graded as high potential ecological risk and ERF ≥ 320 is graded as very high ecological risk (Xu et al., 2021).
This index accounts for the cumulative effects of the studied metals’ individual effects as well as all of their ecological risk factors (Hakanson 1980). It’s calculated as follows:
Where; ErF = ecological risk factor, n = the number of elements under study. The PERI are graded thus: RI < 150 indicates low ecological risk, 150 < 300 indicates moderate ecological risk, 300 < 600 indicates considerable ecological risk and RI ≥ 600 indicates very high ecological risk (Xu et al., 2021). According to Luo et al. (2007), the grade of ecological risk of a single trace metal is interpreted based on the ecological risk (Er) values thus: Er < 40 indicates Low risk, 40 ≤ Er < 80 indicates moderate risk, 80 ≤ Er < 160 indicates considerable risk, 160 ≤ Er < 320 indicates high risk and Er ≥ 320 indicates very high risk. Also, the Grade of ecological risk of the environment is graded based on RI values thus: RI < 65 indicates low risk, 65 ≤ RI < 130 indicates moderate risk, 130 ≤ RI < 260 indicates considerable risk and RI ≥ 260 indicates very high risk (Luo et al., 2007).
Four replications of the experiment were carried out for each measured value and the data reported as the mean ± SD, (n = 4), in the Table of results. IBM SPSS Version 20 (IBM Corp., Armonk, NY, USA) software was used to carry out one-way ANOVA and significant test (Duncan’s multiple range test) on the data obtained from experimental procedures at p < 0.05. The significance indication was also stated using superscript letters of alphabets in the Tables. Pearson’s correlation coefficient approach was used to find a link between hazardous metals in street soils and the edible plant. The significance levels were set at 5%, 2%, and 1%, respectively. The mean values of metals were used to determine environmental indices and compare them with globally accepted standards in literature to ascertain the level of metals pollution and the pumpkin vegetable contamination level and quality in the study area.
3. Results and discussion
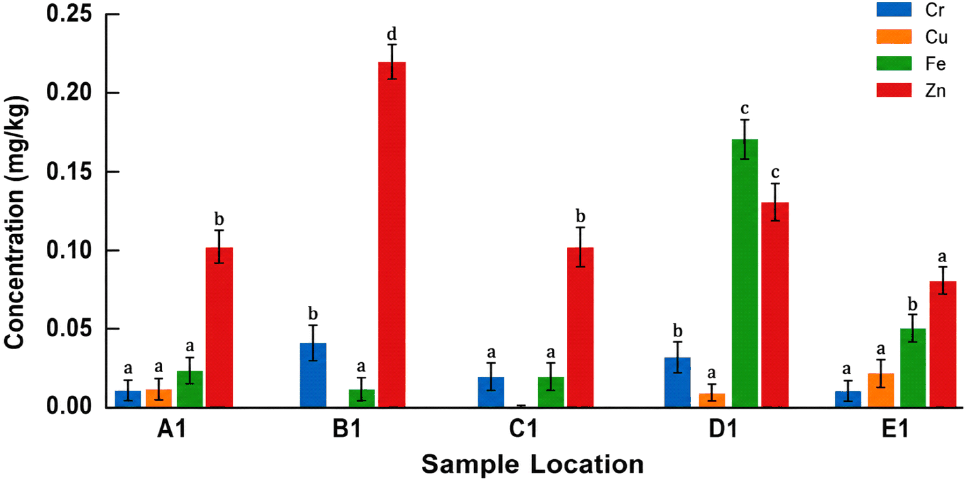
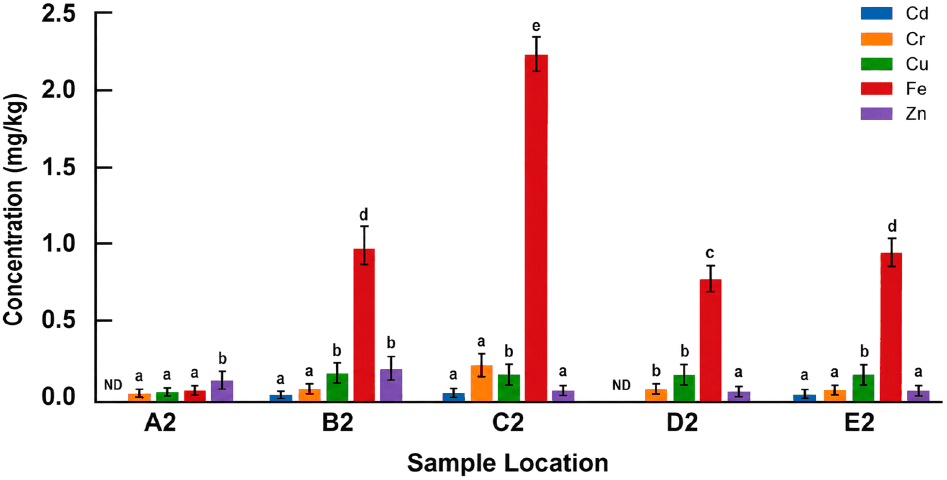
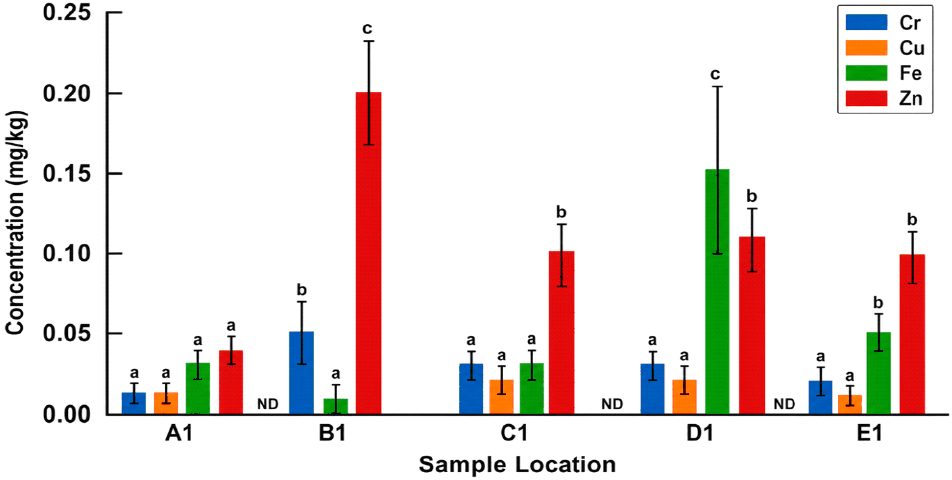
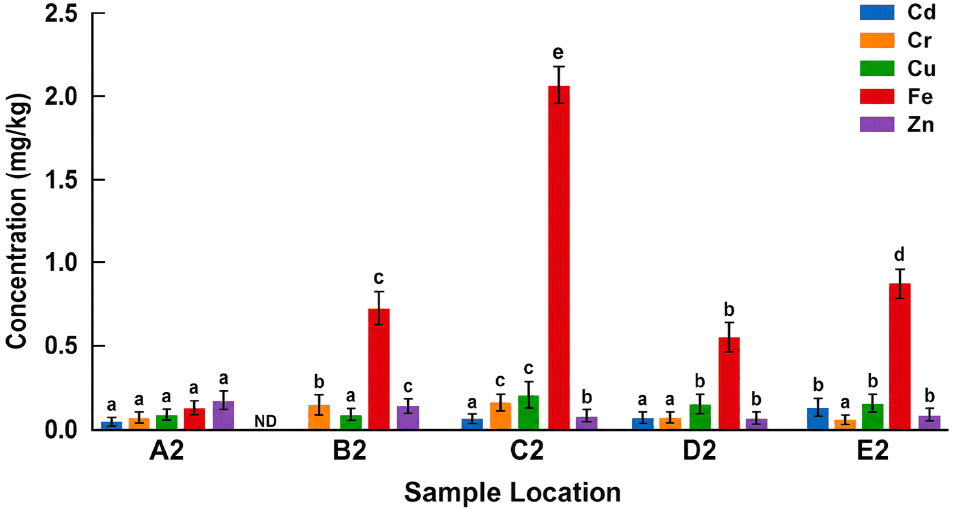
Table 2 and Figs. 1 and 2 show the toxic metals analysis result of the soil and T. occidentalis sample for December 2023 and February 2024 (dry season) respectively, while Table 3 and Figs. 3 and 4 show the toxic metals analysis result of the soil and T. occidentalis sample for April 2024 and June 2024 (wet season) respectively. The Tables 2 and 3 include the mean concentrations of Fe, Pb, Cu, Zn, Cd and Cr, found in soil and T. occidentalis in mg/kg and the WHO/FAO (1996) and WHO/FAO (2024) maximum permissible limits. The Tables 2 and 3 displays the various sample locations with descriptions ranging from A1 to E1 and A2 to E2 for soil and T. occidentalis samples respectively. Table 4 shows the PLI of the study area while Tables 5 and 6 shows the correlation matrix for dry and wet seasons respectively. The level of Cd found in the T. occidentalis samples ranged from 0.01-0.07 mg/kg and was highly less than the WHO/FAO (1996) and WHO/FAO (2024) maximum permissible limit of 0.2 mg/kg. Metals concentrations in soil samples were generally in increasing order: Pb < Cd < Cr < Cu < Zn < Fe. The T. occidentalis sample showed a similar trend in the increasing order of metal concentrations.
| Sample location | Observ. numbers | Cd | Cr | Cu | Fe | Pb | Zn |
|---|---|---|---|---|---|---|---|
| A11) | 1 | ND2) | 0.01±0.013)a4) | 0.01±0.01a | 0.02±0.01a | ND | 0.10±0.01b |
| A2 | ND | 0.02±0.01a | 0.02±0.01a | 0.02±0.01a | ND | 0.10±0.01b | |
| B1 | 2 | ND | 0.04±0.01b | ND | 0.01±0.01a | ND | 0.22±0.02d |
| B2 | 0.01±0.01a | 0.03±0.01a | 0.11±0.02b | 0.95±0.05d | ND | 0.15±0.03b | |
| C1 | 3 | ND | 0.02±0.01a | ND | 0.02±0.01a | ND | 0.10±0.02b |
| C2 | 0.01±0.01a | 0.19±0.03c | 0.13±0.03b | 2.18±0.13e | ND | 0.04±0.02a | |
| D1 | 4 | ND | 0.03±0.01b | 0.01±0.01a | 0.17±0.03c | ND | 0.13±0.03c |
| D2 | ND | 0.04±0.02b | 0.12±0.02b | 0.77±0.03c | ND | 0.02±0.01a | |
| E1 | 5 | ND | 0.01±0.01a | 0.02±0.01a | 0.05±0.01b | ND | 0.08±0.02a |
| E2 | 0.01±0.01a | 0.02±0.01a | 0.11±0,02b | 0.96±0.10d | ND | 0.03±0.01a | |
| WHO/FAO (1996; 2024) | 0.2 | 2.0 | 73.3 | 425.5 | 0.3 | 99.4 |
| Sample location | Observ. numbers | Cd | Cr | Cu | Fe | Pb | Zn |
|---|---|---|---|---|---|---|---|
| A11) | 1 | ND2) | 0.01±0.013)a4) | 0.01±0.01a | 0.03±0.01a | ND | 0.04±0.01a |
| A2 | 0.01±0.01a | 0.01±0.01a | 0.01±0.01a | 0.03±0.01a | ND | 0.03±0.01a | |
| B1 | 2 | ND | 0.05±0.02b | ND | 0.01±0.01a | ND | 0.20±0.03c |
| B2 | ND | 0.05±0.02b | 0.02±0.01a | 0.70±0.15c | ND | 0.13±0.02c | |
| C1 | 3 | ND | 0.03±0.01a | 0.02±0.01a | 0.03±0.01a | ND | 0.10±0.02b |
| C2 | 0.02±0.01a | 0.09±0.02c | 0.19±0.02c | 2.03±0.13e | ND | 0.07±0.01b | |
| D1 | 4 | ND | 0.03±0.01a | 0.02±0.01a | 0.15±0.05c | ND | 0.11±0.02b |
| D2 | 0.01±0.01a | 0.03±0.01a | 0.10±0.02b | 0.52±0.13b | ND | 0.05±0.02b | |
| E1 | 5 | ND | 0.02±0.01a | 0.01±0.01a | 0.05±0.01b | ND | 0.10±0.03b |
| E2 | 0.07±0.02b | 0.02±0.01a | 0.11±0.02b | 0.91±0.11d | ND | 0.06±0.03b | |
| WHO/FAO (1996; 2024) | 0.2 | 2.0 | 73.3 | 425.5 | 0.3 | 99.4 |
| Samples | Cd | Cr | Cu | Fe | Zn | PLI1) |
|---|---|---|---|---|---|---|
| B12) | 5.9 | 3.0 | 0 | 0.5 | 2.4 | 1.53 |
| C1 | 5.0 | 2.0 | 1.0 | 1.0 | 1.0 | 1.19 |
| D1 | 13.8 | 3.0 | 1.0 | 8.5 | 1.3 | 2.40 |
| E1 | 8.8 | 3.0 | 2.0 | 2.5 | 1.3 | 1.77 |
Cr level was more in the T. occidentalis sample obtained from a street farm along NEPA road, Calabar. For the soil sample and T. occidentalis sample, the average concentration of Cr during the dry season ranged 0.01-0.04 and 0.02-0.19 mg/kg (Table 2) respectively, whereas during wet season, the average concentration was 0.01-0.05 and 0.01-0.09 mg/kg respectively (Table 3) respectively. These results showed no significant difference at p < 0.05 between Zn values in the soil or T. occidentalis for the dry and wet season in most locations except T. occidentalis at Nse Ekpo road (B2), though dry season values were slightly higher than wet season. This could be due to the soil nature, availability of Cr ions for T. occidentalis to take up from the soil or other environmental factors.
The concentration of Cr in the edible plant (NEPA road station) was highest but within WHO/FAO (1996) maximum permissible limit of 2.0 mg/kg. The mean value of Cr in T. occidentalis in both seasons as shown in Tables 2 and 3 were also within the WHO permissible limits and the vegetable quality is safe at the moment. Bhattacharya et al. (2013) investigated the concentrations of Cr in road soil, dispersed particulate matter, and foliar ground deposition in Anand, Gujarat. They discovered that the street soil had a Cr concentration of 118.0 to 151.5 ppm and that the suspended particulate matter had a concentration of 75 to 130 ppm. The result of their study revealed higher Cr level compare to this study. This variation could be as a result of the nature of anthropogenic activities in their study area and among other factors compare to those of this study.
A moderately positive correlation with Fe (r = 0.752), Cu (r = 0.541), and Cd (r = 0.581) were found during the dry season, but a negative correlation with Zn (r = −0.301) was discovered. Tables 5 and 6 show that during the wet season, Cr is positively correlated with Fe (r = 0.835), Cu (r = 0.752), and Zn (r = 0.055).
The results in Table 2 showed that the average concentration of Fe in the soil sample and T. occidentalis sample during the dry season ranged 0.01-0.17 and 0.02-2.18 mg/kg respectively, whereas during wet season, the average concentration was 0.01-0.15 and 0.03-2.03 mg/kg respectively (Table 3) respectively. These results revealed significant difference at p < 0.05 in the average Fe concentration in both soil and T. occidentalis between some locations. This could be due to differences in the level of Fe contamination of the locations as a result varied degree of anthropogenic activities in different locations.
Station C (NEPA road) recorded the highest value of 2.18 mg/kg (Table 2) for dry season and 2.03 mg/kg (Table 3) for wet season and these values were within the WHO/FAO (1996) maximum permissible limit for edible plants which stands at 425.5 mg/kg. The mean value of Fe in this study was far lower than the average content of (3,219-5,110 μg/g dry street soil) in all areas, reported by Mahmoud et al. (2012), who assessed trace metal contamination on street soil in New Damietta City. This variation could be due to level of trace metals pollution of street soils, anthropogenic activities and different environmental factors in Damietta City compared to Calabar.
During the dry season, Pearson correlation matrix analysis revealed a slight positive correlation between Cu (r = 0.785), Cd (r = 0.785), and Cr (r = 0.857), but a negative correlation value for Zn (r = −0.679). During the wet season, there was a modest positive correlation of Fe with Cu (r = 0.865), Cd (r = 0.889), and a negative correlation with Zn (r = −0.679), whereas there was no association with Pb as shown in Tables 5 and 6.
The results in Table 2 showed that the average concentration of Cu in the soil sample and T. occidentalis sample during the dry season ranged 0.01-0.02 and 0.02-0.13 mg/kg respectively, whereas during wet season, the average concentration was 0.01-0.22 and 0.01-0.19 mg/kg (Table 3) respectively. The vegetable sample from site C2 (NEPA road) during the rainy season contained the highest amount of Cu, 0.19 mg/kg (Table 3). The concentration of the soil sample in C1 increased to 0.02 mg/kg during the rainy season, whereas sites B1 (Old Odukpani road) recorded no value and was detected 0.11 mg/kg during the dry season (Table 2). These results showed no significant difference at p < 0.05 between Cu values in the soil or T. occidentalis for the dry and wet season among locations. However, the values of Cu recorded in the both seasons were significantly low but within the WHO/FAO (1996) maximum permissible limit for Cu which stands at 73.3 mg/kg.
The wet season result indicate moderate pollution outcome of the PLI in Table 4 where it values for all metals in the soil were less than 10. According to Ray et al. (2006), PLI values of 10 and above indicates high pollution.
During the dry season as shown in Table 5, there was a positive association with Cd and Cr (r = 0.747) and a negative correlation with Zn (r = −0.878) according to Pearson correlation matrix analysis shows a negative association with Zn (r = −0.419) and a positive correlation with Cd and Cr (r = 0.747) and (r = 0.592) during the rainy season.
After Fe, and Cu, Zn is the third most available metal in the soil and T. occidentalis samples studied in this research. In both the dry and wet seasons, the soil samples have higher Zn concentrations than the T. occidentalis sample. The results in Table 2 showed that the average concentration of Zn in the soil sample and T. occidentalis sample during the dry season ranged 0.08-0.22 and 0.02-0.15 mg/kg respectively, whereas during wet season, the average concentration was 0.04-0.20 and 0.03-0.13 mg/kg (Table 3) respectively. These results showed no significant difference at p < 0.05 between Zn values in the soil or T. occidentalis for the dry and wet season in most locations except Old Odukpani Rd (B1), though dry season values were slightly higher than wet season.
The highest values were reported at location B1 (Old Odukpani road) during the dry season, 0.22 mg/kg for soil and 0.15 mg/kg for T. occidentalis in (Table 2), and 0.20 mg/kg and 0.13 mg/kg respectively during the wet season (Table 3). The mean values of Zn in this study for T. occidentalis in both seasons were within and highly below the maximum permissible limit of WHO/FAO (1996, 2024) of 99.4 mg/kg. Their ecological risk factors were low in both seasons and can be considered safe as put forward by Luo et al. (2007).
Dietary Zn deficit is potentially more harmful to health than dietary Zn excess. Although males should consume 15 mg/kg of Zn daily and females should consume 12 mg/kg, excessive Zn levels in vegetables can Pb to nausea, renal damage, cramping, and other issues (Keith et al., 2007). Zn concentrations in contaminated soils frequently exceed the amount required as a nutrient, posing a threat to plants. Excessive levels of Zn can cause damage to some biological systems and interfere with the body metabolism, though it is needed in trace amounts in living organisms (Akpe et al., 2018).
During the dry season, there was a negative correlation with Cd and Cr (r = −0.643) and (r = −0.40) correspondingly, and a negative correlation value of (r = −0.250) for Cr during the wet season, whereas Cd showed a positive correlation value of (r = 0.419) as shown in Table 6.
Although Cd was not found in any soil sample both in wet and dry seasons, T. occidentalis samples concentration ranged from 0.01 to 0.07 mg/kg (Table 3) in all locations except B1 (NEPA road). The bioaccumulation of Cd in the tissues of the crop may be as a result of high uptake of Cd by the roots and its transportation to the leaves through transpiration process without the metal being remobilized through the phloem. WHO/FAO (1996) and WHO/FAO (2024) maximum permissible limit for Cd is 0.2 mg/kg and the T. occidentalis samples recorded a value below or within the WHO/FAO permissible limits. The PLI and contamination degree as shown in Table 4 was less than 10 for all metals indicating low contamination in all the samples, and were within the acceptable limit for both wet and dry season.
The values of Cd in this study are far less than a maximum Cd level of 51.2 μg/g found in roadside soil and a minimum Cd level of 12.58 μg/g in industrial regions of Misurata, Libya as reported by Ahemad, (2015), when monitoring trace metal content in soil taken from the city center and industrial sectors. This variation could be due to the differences in the level of Cd-related waste pollution of that city and Calabar or the soil and other environmental factors.
Pb was not found in all of the samples evaluated, the vegetable farms that were sampled for this study were Pb-free, and no Pb was found in any of the soil and vegetable samples that were taken. This could be due to its concentration highly below the detection limit or not present at all.
Generally, the concentration of the metals studied in the soil was in the order: Pb < Cd < Cu < Cr < Fe < Zn, while in T. occidentalis the order was Pb < Cd < Cu < Cr < Zn < Fe. Cd did not record any significant difference for both season and was not detected in all soil samples while values which ranged from 0.01-0.07 mg/kg in their respective T. occidentalis samples. All T. occidentalis samples had several levels of the metals studied except Pb but were all within the WHO/FAO and WHO/FAO (2024) permissible limits 0.3 mg/kg. These elements can bio-accumulate over time and cause health problems and even death.
In summary, this study assessed the level and season variation of some toxic metals in street soil and the quality of pumpkin vegetable planted in them in Calabar Municipality. Except for Pb and Cd, the study area had an appreciable level of metals contamination at the end of the study, though the levels were still within the WHO/FAO (1996) and WHO/FAO (2024) maximum permissible limits. The cause or source of this contamination could be due to anthropogenic activities and indiscriminate disposal of metal waste within the city.
Most metals correlated positively with each other between the street soil and T. occidentalis in the dry season compare to the wet season except for Cd and Pb that were not detected in most of the locations, according to the Pearson correlation matrix. Seasonal variations exist to some extent, though slightly, with metal levels in soil being higher in the dry than the wet seasons, while in pumpkin, the wet season had higher amounts of metals than the dry season. With the exception of Pb, the metal concentrations in T. occidentalis (Cr, Cu, Fe, Zn, and Cd) are dependent on the concentrations in the street soil, which can be carried to surrounding fields via wind, runoff, and other means. Most T. occidentalis samples recorded a higher metal concentration than that of the soil they grew on, which could be due to nature of the soil, environmental factors or increased bioaccumulation of the metals in the T. occindentalis over time.
4. Conclusions
The result of this study revealed that the soil quality in terms of toxic metals determines the quality of pumpkin grown in them. Except for Pb and Cadmium, the study area had an appreciable level of metals contamination, though the concentration was still below and within the WHO/FAO (1996) and WHO/FAO (2024) permissible limit. At the moment, the pumpkin quality is still good and safe for consumption, but relevant state agencies need to take appropriate measures to monitor and control further metals pollution in the area.