1. Introduction
Rice is cultivated in over 100 countries and is the primary staple for more than half of the world’s population, and legumes such as beans and peas are rich in protein and minerals and serve as critical nutritional sources in developing regions (Fukagawa and Ziska, 2019; Munthali et al., 2022). Legumes are inexpensive protein sources and very crucial in developing countries. Despite their nutritional and economic importance, prolonged cooking times and high energy demands remain major barriers to more frequent consumption, particularly in low and middle income households where fuel costs can represent a significant portion of disposable income (Munthali et al., 2022). Improving the cooking process through pretreatments can significantly improve convenience and thus increase legume consumption (Ogundele et al., 2022). On the other hand, rice dominates diets and industry in many countries. Soaking and cooking of grains are required to transform dry seeds into edible form and hence, understanding the hydration and cooking dynamics of these is crucial to optimize process planning, reduce energy use, and safeguard quality Although white rice generally cooks more rapidly than most legumes, parboiled and brown rice varieties still require considerable thermal energy due to structural barriers that limit water diffusion. When soaking, water diffuses into the grain and disperses into starch granules and protein matrices, which facilitates gelatinization of starch and denaturation of proteins upon heating. These phenomena change the seed structure and allow kinetic models to capture the moisture uptake behavior (Bender et al., 2024; Fabbri and Crosby, 2016). In recent years, both classical and experimental approaches have been applied to attain the complex kinetics of water uptake and cooking.
Pre soaking legumes and rice kernels has widely practiced to accelerate cooking Soaking bean varieties for 12 h shortened cooking times by about 20 to 38% (Munthali et al., 2022). Soaking prior to cooking facilitates starch gelatinization and protein denaturation, thereby reducing both cooking time and energy consumption (Yanni et al., 2023). Furthermore, soaking can greatly reduce energy requirements during cooking. However, the soaking medium greatly affects the structure of the grain. This observation is consistent with studies showing that water absorbed during soaking accelerates starch gelatinization and protein softening during cooking and hence speeding up the overall process (Fabbri and Crosby, 2016). The softening of the texture during soaking speeds up cooking and leads to reduction in cooking time. Controlling the soaking of pulses is crucial as it affects subsequent processing steps and the final product quality (Bender et al., 2024). Hence, soaking is a remedy that can considerably reduce rice and legume cooking time and energy costs, so predictive models of soaking and cooking kinetics are also valuable for industry.
It has been depicted that soaking rice kernels for 15 to 60 min reduces cooking time from approximately 20 to 10 min and enhances kernel size (Hirannaiah et al., 2001). Soaking temperature and duration strongly influence hydration rate, hardness, and yield, with optimal conditions around 75°C for basmati and 80°C for non basmati rice (Sharma et al., 2024). These optimal soaking temperatures reported in the literature correspond to controlled hot soaking conditions, whereas the present study restricts soaking experiments to a moderate temperature range of 25-55°C. Moreover the bran and husk act as diffusion barriers (Li and Chen, 2024). In particular the outer husk has been identified as a primary barrier to water intake and significantly slowing moisture diffusion into the grain (Thakur and Gupta, 2006).
Rice shows a strong inverse correlation between initial grain moisture and total boiling duration, confirming that hydration significantly decreases energy consumption (Herath et al., 2016). Modeling of the whole cooking process of local rice types has incorporated heat and mass transfer dynamics and further studies have investigated moisture transport behavior during rice cooking, supporting systematic insight into diffusion controlled water migration and gelatinization (Jayamini et al., 2021).
A wide range of kinetic models have been utilized in past studies to describe water absorption behavior during soaking. Among these, Peleg (1988) proposed a two parameter empirical equation that has become one of the most extensively applied models for sorption kinetics (Peleg, 1988). Application of Peleg’s model to split chickpea soaking experiments reached good agreement with experimental data with R2 ≈ 0.98, confirming faster initial uptake at higher temperatures (Johnny et al., 2015). In contrast, a spherical diffusion model developed for chickpea hydration demonstrated that the effective moisture diffusivity increased with temperature and confirmed the temperature dependent acceleration of water migration during soaking (Bidkhori and Mohammadpour, 2021). Similar research carried out with mung beans observed that the effective moisture diffusivity increased with time and temperature (Sharanagat et al., 2016). Temperature dependent diffusivities usually obey Arrhenius type behavior (Kumar et al., 2020). Although several researchers evaluated alternative models (Bidkhori and Mohammadpour, 2021; Kumar et al., 2020; Sharma et al., 2024), Peleg’s model provided the best fit at lower temperatures and hence remains the reference standard in food hydration research.
However, traditional established models lack the ability to capture nonlinear effects influenced by variations in grain geometry and composition. As an advancement, neural networks are excellent tools to model complex, dynamic, and nonlinear food process systems (Aghbashlo et al., 2015). Feed forward backpropagation networks have been used to predict chickpea hydration ratios from soaking time and temperature (Kumar et al., 2020). Artificial neural networks coupled with response surface methodology have been trained to predict infrared heated cowpea properties such as water absorption and pectin solubility (Ogundele et al., 2022). In rice parboiling, a neural network has been developed to predict moisture ratio, yield, and whiteness, achieving R2 = 0.97. These examples illustrate that AI based models efficiently estimate the nonlinear mapping between process parameters and outcomes and hence can considerably advance predictive accuracy for rice and legume hydration and cooking. However, although extensive research has been carried out in both hydration kinetics and cooking performance, few studies integrate the soaking and cooking phases into a combined predictive framework. Moreover, thorough comparisons between empirical and AI based models for predicting the entire soaking-cooking continuum are still scarce. Nonthermal technologies such as ultrasound, high pressure, and plasma have shown potential to accelerate hydration (Alsalman and Ramaswamy, 2020; Bender et al., 2024) yet they are still to be incorporated into predictive frameworks.
This study addresses these gaps by combining classical Peleg type empirical modeling with artificial neural network based prediction to describe and forecast water uptake, cooking time, and energy consumption across both rice and legume species. We integrate experimental kinetics with AI predictions to offer a pathway toward data driven, energy efficient cooking design. This study aims to (i) model hydration kinetics of selected rice and legume varieties using the Peleg model, and (ii) develop an artificial neural network to predict cooking time and energy consumption from soaking conditions, providing a data driven basis for energy efficient smart cooking systems.
2. Materials and methods
Four staple food materials were used in this study: long grain rice (Basmati, raw), short grain rice (Japonica, raw), chickpeas, and mung beans. The parboiled rice used in this study represents a commercially available medium grain product; varietal differences among parboiled rice types were not explicitly resolved. All experiments were conducted in triplicate (n = 3), and results are reported as mean ± standard deviation (SD). A schematic overview of the methodological workflow is provided in Table 1.
All samples were purchased from local commercial retailers in the UAE and manually cleaned to remove foreign matter. Prior to experimentation, samples were equilibrated to a uniform initial moisture fraction of 0.12 by storage in airtight containers at 25°C for 24 h.
All moisture calculations were performed on a dry weight basis, using the dry mass Wd as the reference. Samples were maintained in airtight containers at controlled room temperature (25°C) to minimize moisture variation due to ambient humidity. All experimental measurements, including moisture fraction, cooking time, and energy consumption, were performed in triplicate (n = 3) and are reported as mean ± SD.
Each experimental condition (grain type, soaking temperature, and soaking duration) was evaluated using three independent replicates.
A mass of 20.0 ± 0.1 g of each sample (mean ± SD, n = 3) was placed in 250 mL glass beakers containing 200 mL of distilled water (1:10 w/v). Beakers were immersed in a thermostatically controlled water bath (Memmert WNB14, Germany) set at 25, 35, 45, or 55 ± 0.2°C. Samples were withdrawn at 0, 3, 5, 10, 30, 60, 120, 240, and 480 min, blotted gently with filter paper to remove surface water, and weighed on an analytical balance.
Moisture fraction Mt at any given time t, with Wt, W0 as the sample weight at t and 0 was calculated as
Initial moisture is set as 0.12 (corresponding to 12% moisture content on a wet basis), and equilibrium moisture was approached for long t. All measurements were conducted in triplicate and calculated the averages for further analysis. The hydration data were tabulated as time (min), moisture ratio, temperature (°C), and grain type for further modeling.
The Peleg (1988) model is employed to determine the hydration kinetics for each sample and the Peleg’s constants were determined for each sample and temperature using nonlinear regression with Levenberg Marquardt algorithm.
Subsequently, for the cooking experiments, the soaked samples were gently dried at room temperature to remove surface adhered water and to ensure consistent handling conditions prior to cooking. The samples were then placed in water at ratios of 1:3 for rice and 1:4 for legumes. Cooking was considered complete based on a compressibility criterion consistent with AACCI Method 66 50.01, where at least 90% of the grains were compressible between two glass plates without exhibiting a hard core. The corresponding cooking time was recorded at this endpoint, and energy consumption was calculated accordingly. Each experiment was conducted in triplicate to validate experiments. Peleg model parameters (k1 and k2) were estimated using nonlinear regression based on averaged experimental data from triplicate measurements. Therefore, variability is reflected in the experimental data rather than in the fitted parameters.
The soaking temperature, soaking time, initial and final moisture fractions, cooking time, and energy consumption were entered in a dataset for four grain type and each for four different soaking temperatures in different intervals. Data were preprocessed using Pandas and NumPy libraries in Python version 3.11. The dataset was split into 70% training, 15% validation and 15% independent test sets. Training data set was stratified to preserve a balance between rice and legume samples and temperature and soaking duration. Energy consumption during cooking was calculated by multiplying the rated electrical power of the cooker by the measured cooking time, assuming constant power operation, and expressed in kilojoules (kJ).
A supervised artificial neural network (ANN) was developed to predict cooking time and energy consumption from soaking parameters. The model inputs included food type, variety, soaking temperature, soaking time, initial moisture fraction, and final moisture fraction. The network architecture consisted of fully connected layers with ReLU activations and dropout regularization, and training was performed using the Adam optimizer. All input data were scaled, and early stopping with learning rate scheduling was applied to ensure stable convergence. SHAP analysis indicated that the final moisture fraction was the most influential variable, contributing approximately 45% to cooking time predictions, followed by soaking temperature (35%) and soaking time (20%). Model performance was evaluated using the coefficient of determination and root mean square error. On the independent test set, the trained ANN achieved R2 values of 0.98 for cooking time and 0.97 for energy consumption, indicating strong agreement between predicted and measured values.
External validation was performed using independent datasets from previous legume soaking studies (Bello et al., 2004; Bidkhori et al., 2021; Costa et al., 2018; Johnny et al., 2015; Kaur et al., 2022; Miano et al., 2018; Sharma et al., 2024), covering soaking durations from 0 to 600 min and temperatures between 20 and 60°C. Under these conditions, the ANN maintained strong predictive performance, achieving R2 values of 0.94 for cooking time and 0.91 for energy consumption. To further assess model robustness, fivefold cross validation was conducted, with each fold using 80% of the data for training and 20% for testing, and randomized data splits to minimize sampling bias. A refined ANN architecture was implemented, comprising two hidden layers with 64 neurons each, along with batch normalization, L2 regularization, and dropout to prevent overfitting. All folds were trained using identical scaling parameters to maintain consistency across training and evaluation stages.
Uncertainty analysis was conducted using Monte Carlo resampling with 1000 iterations, in which input features were perturbed within ± 2% of their measured values. Each perturbed input set was evaluated using the trained ANN to generate distributions of predicted cooking time and energy consumption for each sample. All statistical analyses were performed using Python, employing NumPy, scikit learn, SciPy, Matplotlib, and Seaborn libraries.
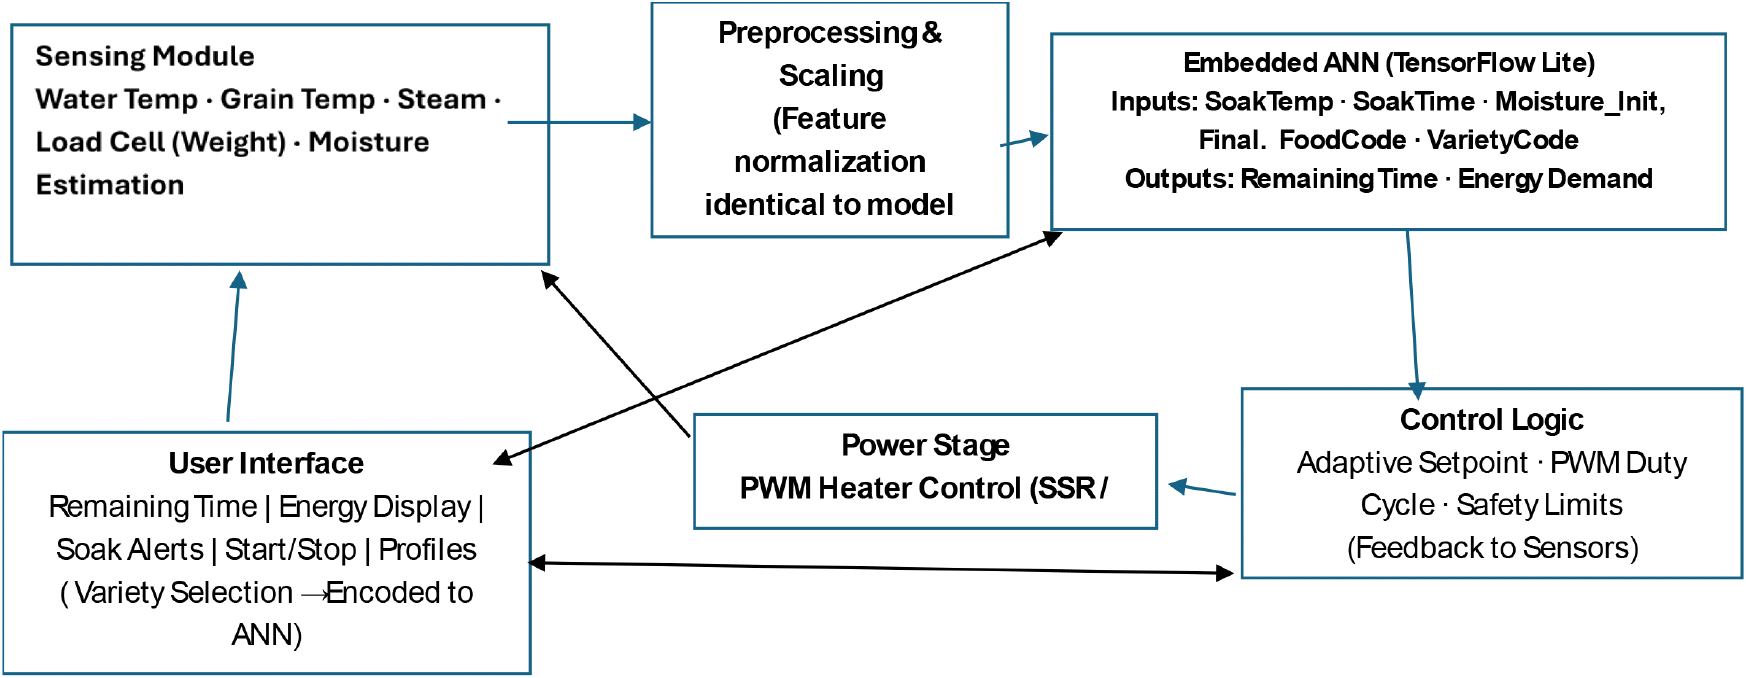
The trained ANN was converted into a lightweight TensorFlow Lite format to evaluate its suitability for real time execution on low cost microcontrollers. A conceptual smart cooker control architecture was then developed, in which simulated real time sensor inputs including water temperature, grain temperature, steam humidity, and grain weight were normalized using the same scaling parameters applied during training. These processed inputs were supplied to the embedded ANN to estimate the remaining cooking time and energy demand directly on device, without reliance on cloud computation. The predicted outputs were fed into a feedback controller that dynamically adjusted heater power through pulse width modulation (PWM), enabling a transition from conventional fixed power boiling to an adaptive, energy efficient heating strategy suitable for future smart cooking appliances.
All experiments were conducted in triplicate (n = 3), and results are presented as mean ± SD. Statistical analysis was performed to evaluate the effects of soaking temperature, soaking time, and grain type on hydration, cooking time, and energy consumption. One way and two way analysis of variance (ANOVA) were used where appropriate, followed by Tukey’s post hoc test for multiple comparisons. A significance probability of p < 0.05 was considered statistically significant. All statistical analyses were performed using Python programming.
3. Results and discussion
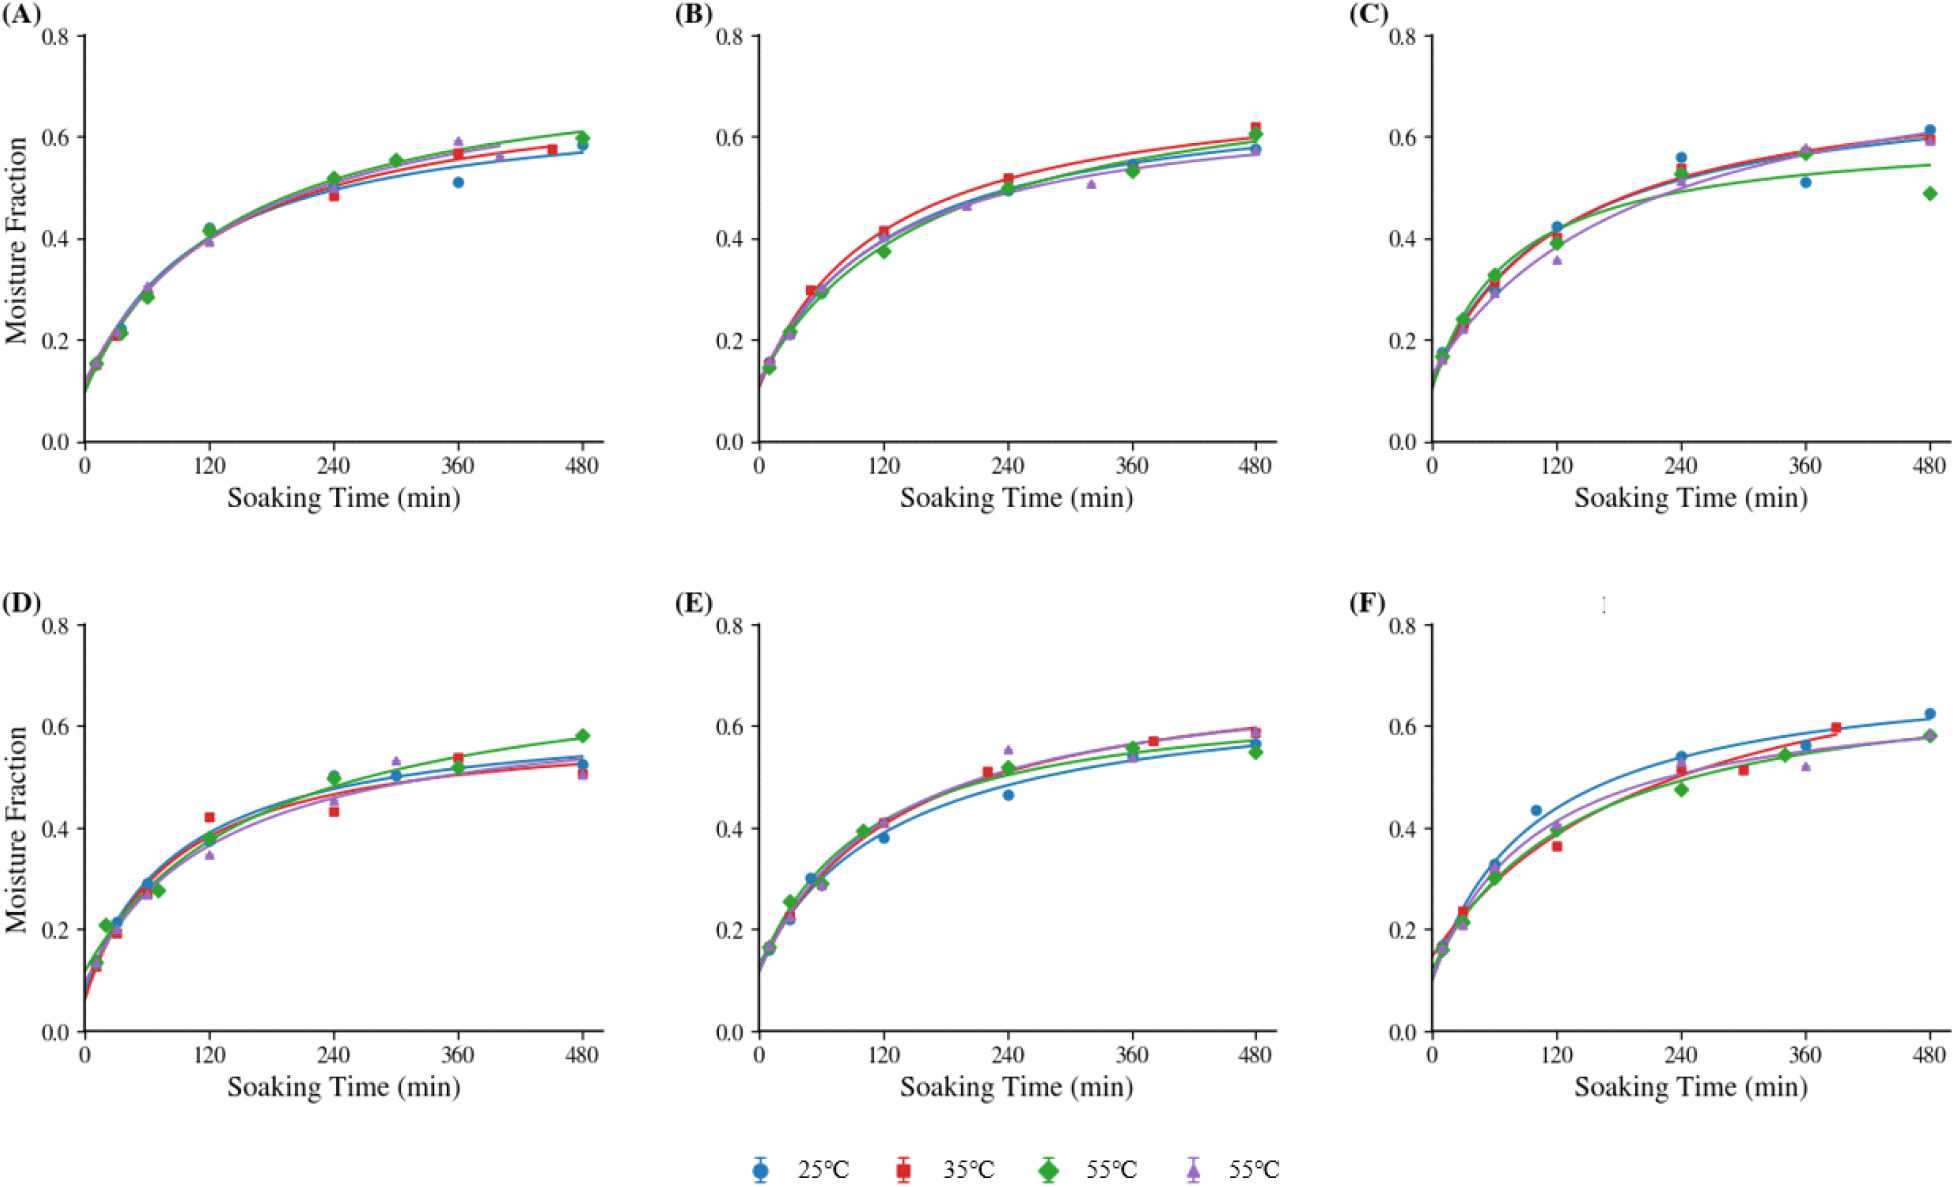
The moisture uptake during soaking exhibited an asymptotic, hyperbolic trend characteristic of diffusion controlled hydration processes. All reported experimental values represent the mean of three independent replicates, and variability is expressed as standard deviation. As shown in Fig. 1, the Peleg model can fit the moisture uptake profile for all types for the soaking temperatures ranging from 25°C to 55°C. With increasing soak temperature, water absorption increased significantly. This is reflected in reduced rate constant at higher temperatures, which implicates faster initial diffusion. For example, Japonica rice soaked at 55°C reached a moisture fraction of 0.58 in 480 min when compared to 25°C, that gives 0.48. These trends verify that thermal energy supports disturbing grain surface walls and facilitates water intake. Moreover, moisture diffusion coefficients ranged between 1.8 × 10⁻⁹ and 3.2 × 10⁻⁹ m2/s, and it is in agreement with literature on hydrated cereal systems (Alsalman et al., 2020; Bello et al., 2004). The fitted Peleg constants (k1, k2) for all grain types and soaking temperatures are summarized in Table 2. The Peleg model parameters demonstrate clear temperature dependence across all grain types. Increasing soaking temperature generally reduced k1 values, indicating faster initial hydration rates, while k2 values remained within a narrow range, reflecting similar equilibrium moisture behavior. The fitted equilibrium moisture fractions were consistent with experimentally observed saturation levels, confirming the suitability of the Peleg model for describing hydration kinetics of both rice and legumes.
1) The parameters k1 and k2 were obtained by fitting the Peleg model to the experimental soaking data for each grain/variety and soaking temperature.
Peleg parameters were obtained by nonlinear regression using averaged triplicate measurements. Therefore, variability is represented in the experimental hydration data used for fitting rather than in the fitted parameter estimates.
Soaking grains has a noticeable impact on cooking time and energy demand. As hydration increased, cooking is faster and hence more energy efficient. Fig. 2A depicts the relationship of final moisture fraction and cooking time for different varieties, where higher moisture fractions correspond to significantly reduced cooking times. Energy consumption trends in Fig. 2B also depict that cooking energy decreased consistently with increasing soaking temperature. A logarithmic scale was used to clearly distinguish energy consumption trends among grain types with differing absolute energy demands. The average decrease in cooking time, calculated from experimental measurements across all rice varieties, was 40% when the soaking temperature increased from 45 to 55°C, while a corresponding reduction of 33% was observed for chickpeas.
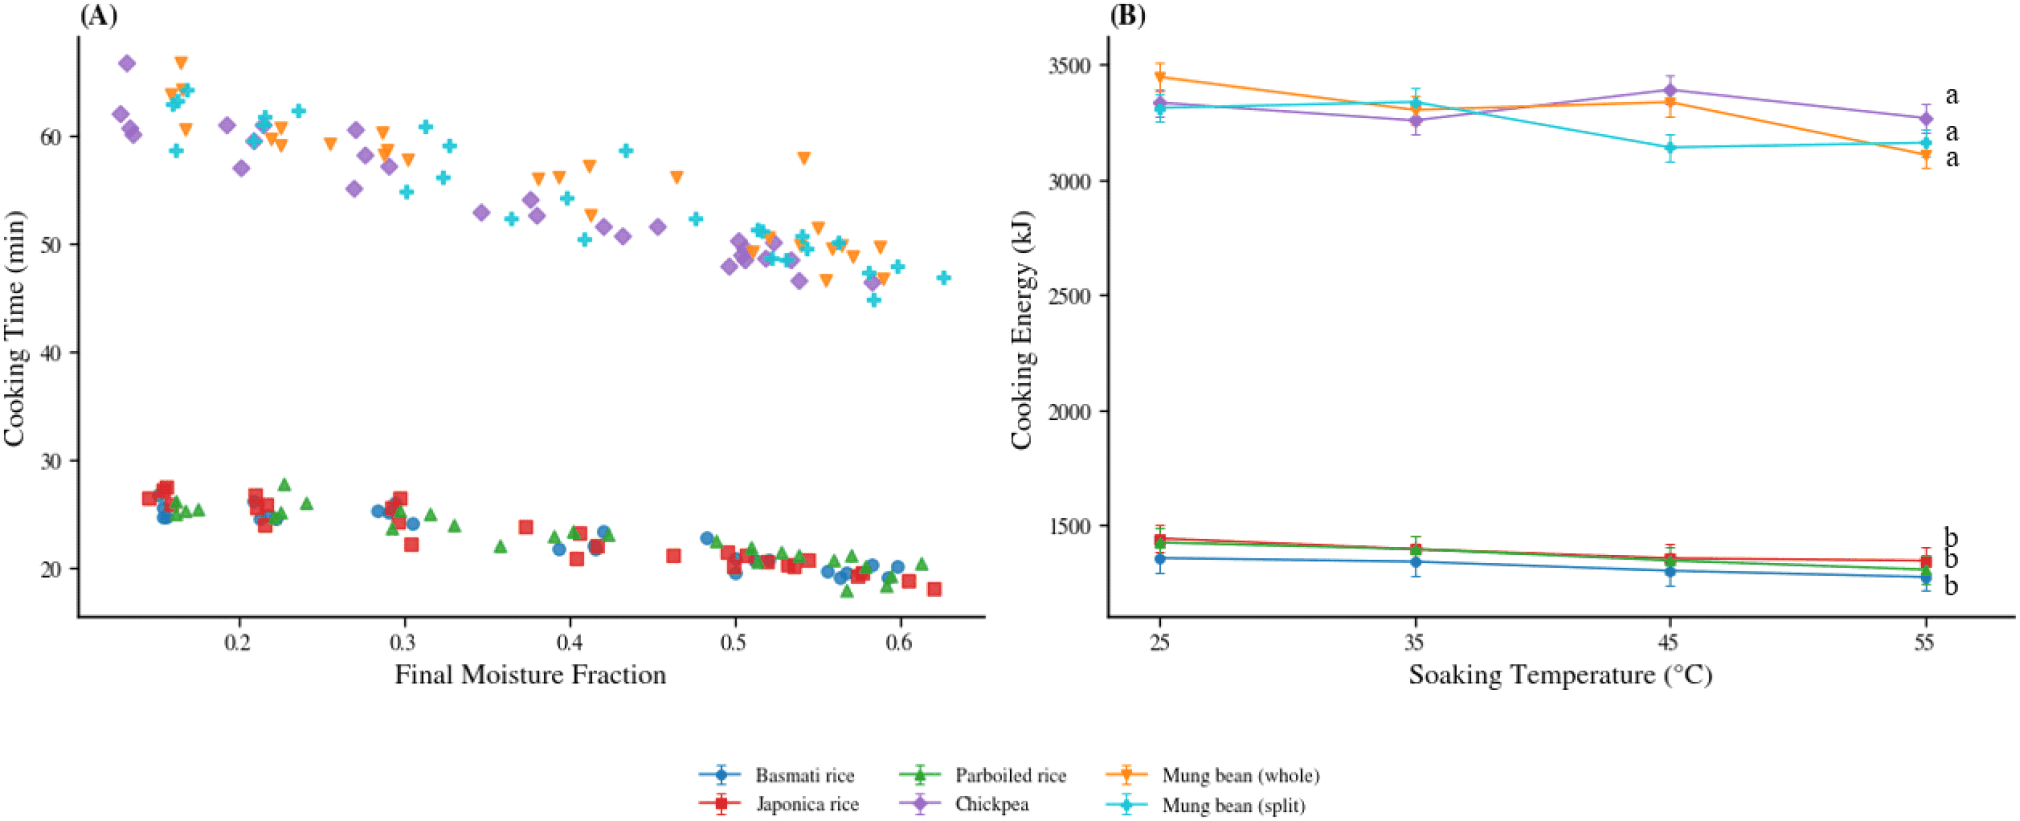
Regression analysis showed a strong negative correlation between soaking temperature and cooking time and hence the findings represent the role of soaking in softening structural barriers and enabling more efficient heat transfer and starch gelatinization during cooking (Shafaei, 2014). ANOVA showed that soaking temperature significantly affected moisture uptake, cooking time, and energy consumption (p < 0.05). Different soaking temperatures produced statistically significant differences based on Tukey’s post hoc test.
Supervised ANN predicted cooking time and energy from soaking parameters with high accuracy using dense layers, dropout, and early stopped Adam optimization. The mean absolute error for both training and validation sets showed a sharp decline during the initial 20 epochs, indicating instant convergence. The validation MAE stabilized after approximately 60 epochs, reaching values below 0.03 in normalized units, indicating effective generalization without overfitting.
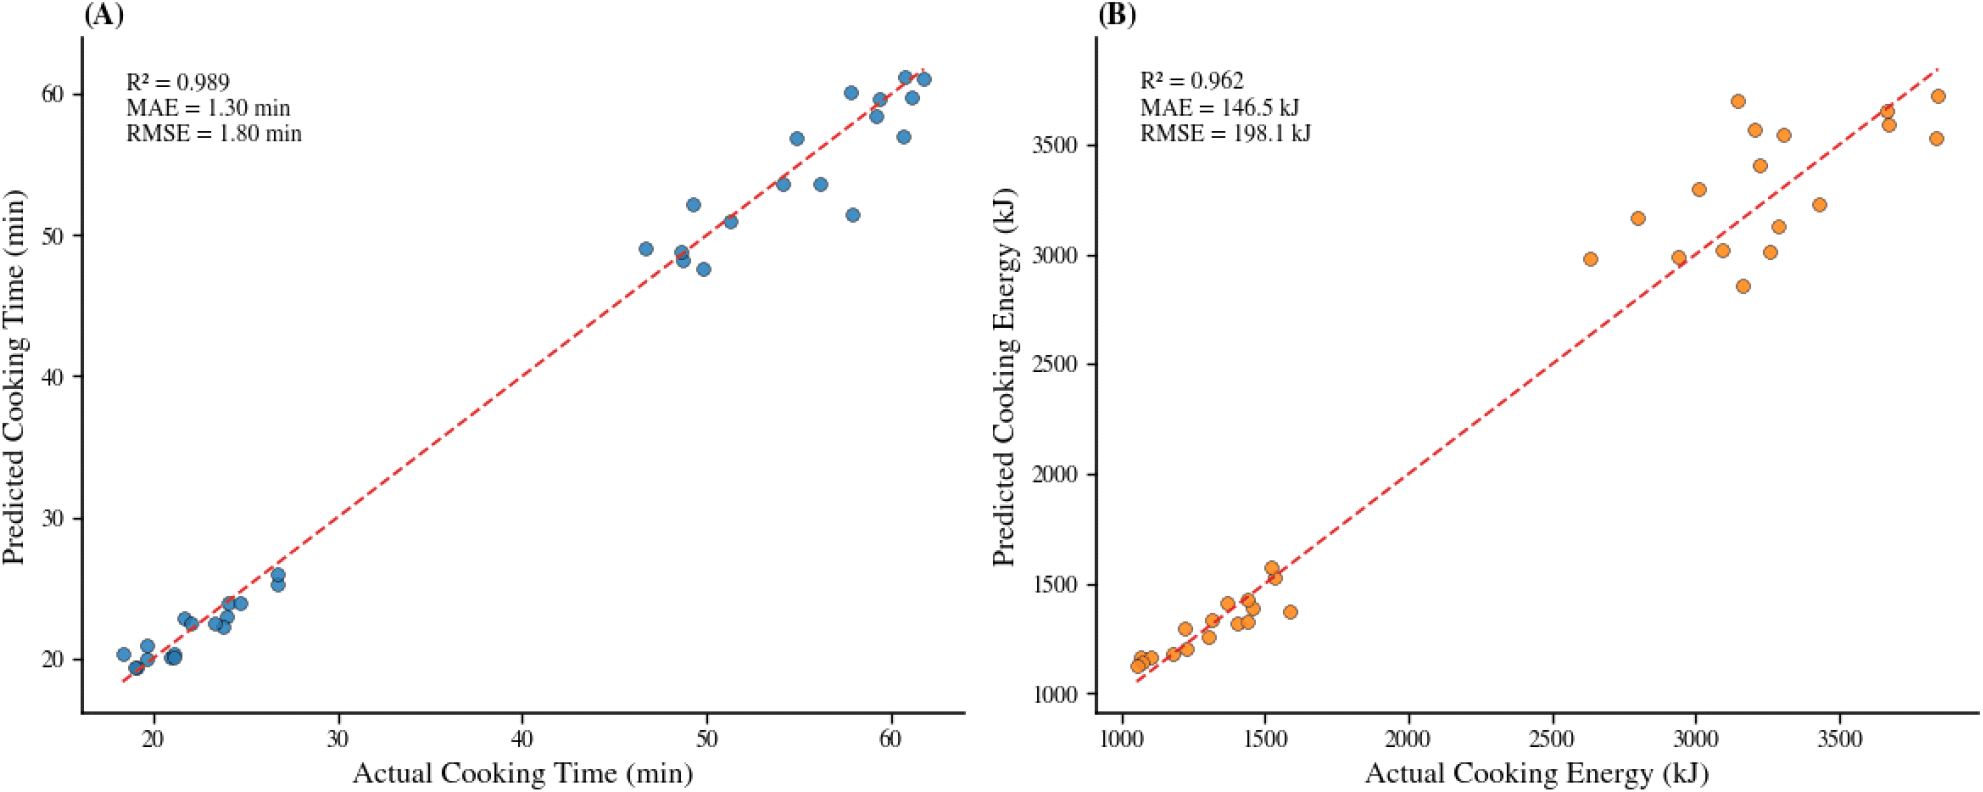
Fig. 3 shows the predicted versus actual cooking times and actual energy values across the combined validation samples of rice and legumes. The predictions track measured values accurately and that confirms reliable modeling of both cooking duration and energy demand and further closely follow the ideal diagonal, indicating excellent agreement and minimal bias.
The ANN model predicted a consistent decrease in cooking time with increasing soaking duration and soaking temperature for both Basmati rice and chickpeas. These trends are following the improved moisture uptake observed during the hydration process, that facilitates heat transfer and accelerates the softening of the food matrix during cooking. The results further show that the developed ANN model successfully captures the coupled effects of hydration kinetics and thermal processing, providing reliable predictions across a range of soaking conditions.
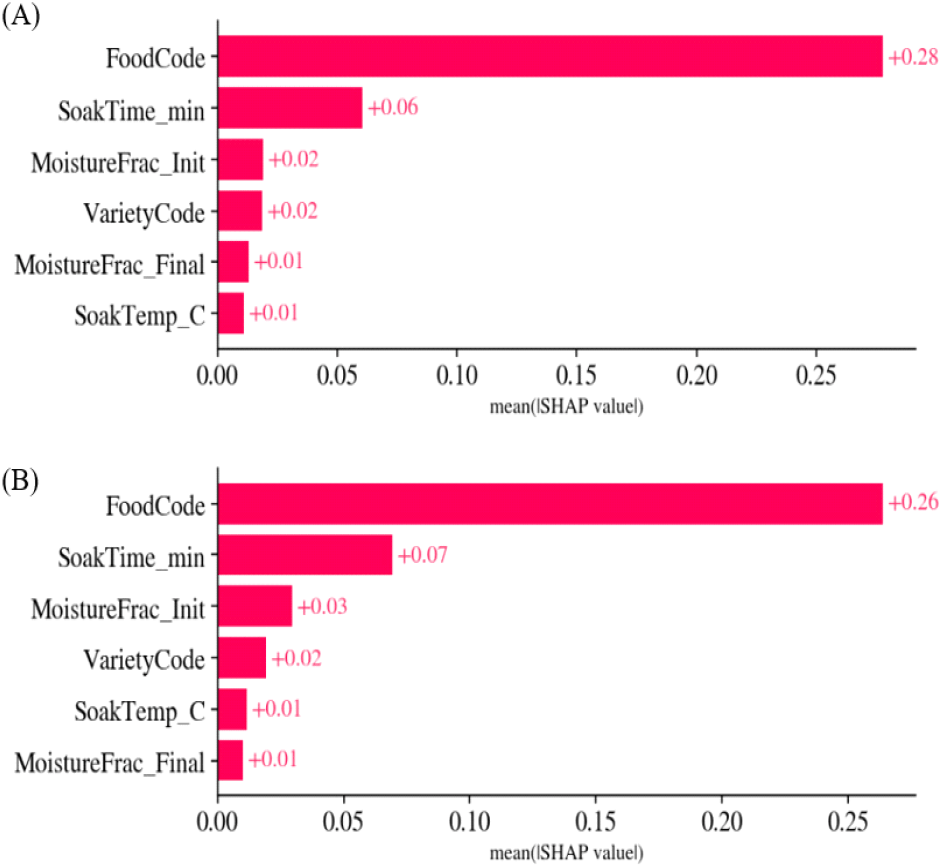
SHAP analysis shows that final moisture fraction is the most significant input with 45% followed by soaking temperature 35% and time 20%. Interaction effects from grain type and variety were present but secondary. These results confirm that the model fits data accurately and hence support its reliability for intelligent control in cooking applications. Fig. 4 illustrates the mean SHAP values for each input feature in predicting cooking time and energy demand. Food type exhibits the highest global importance across the dataset, reflecting inherent structural differences between grain categories rather than the influence of controllable soaking parameters. Moisture parameters followed next, consistent with their thermodynamic significance in heat and mass transfer. Soaking temperature had relatively low influence, likely due to its indirect impact being captured via moisture evolution.
The trained model is tested on an independent dataset compiled from published experimental studies, with temperature vary in the range from 20 to 60°C and soak duration from 0 to 600 min. Fig. 5A shows a positive coupling between predicted and observed variables, where ANN achieved an R2 value of 0.944 and deviations remaining within approximately ± 5% of experimental measurements across the range tested. This shows that the model generalizes the thermal response of hydrated grains, when applied to literature data. Predictions of cooking energy exhibited medium variability and that is expected owing to other uncontrolled factors that affects heat consumption in different experimental setups.
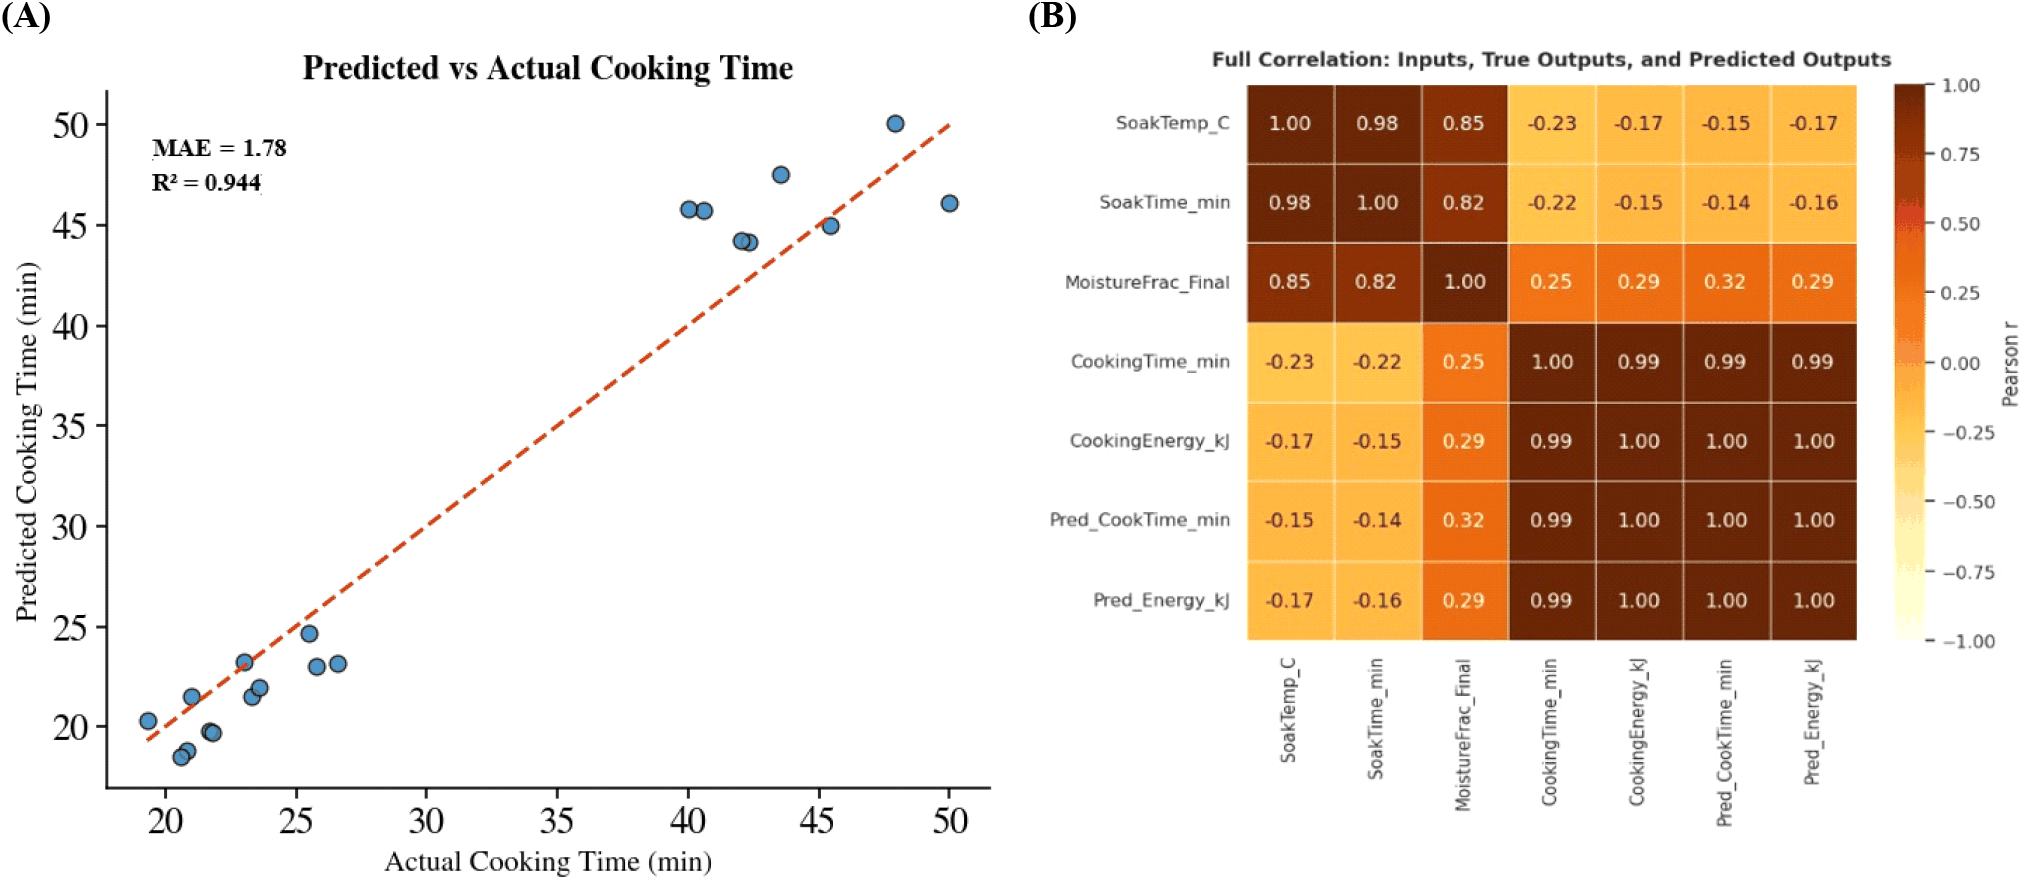
Fig. 5B shows the correlation heatmap for soaking conditions with cooking performance and how ANN predictions align with experimental results. Soaking temperature and soaking duration exhibit negative correlations with cooking time and cooking energy, and this confirms that improved hydration reduces thermal resistance and speeds cooking. Final moisture fraction demonstrates a moderate positive correlation with cooking metrics due to increased thermal load when more water is absorbed. Table 3 below shows the cross validation analysis results, that demonstrates the network attained stable and accurate predictions across all folds, indicating consistent learning behavior without overfitting. For cooking time, the ANN achieved high predictive accuracy where mean MAE of 2.24 min and a mean R2 of 0.973. Five fold cross validation confirmed the robustness of the ANN model, with low variability in MAE and consistently high R2 values across all folds, demonstrating reliable predictive performance and strong generalization capability.
Monte Carlo uncertainty analysis confirmed the stability of the ANN model under input uncertainty. The prediction distributions remained well constrained, indicating robust model behavior and reliable performance for real time smart cooking applications. Qualitative observations obtained using a PentaView™ Celestron digital compound light microscope revealed progressive structural changes within the rice grain during soaking. The unsoaked grain surface appeared rough and opaque, while the cross section exhibited a dense endosperm structure with limited translucency. After soaking at 45°C for 20 min, the grain surface appeared smoother and more hydrated, and the cross section showed increased translucency and a more uniform internal appearance. These changes indicate the onset of moisture diffusion into the endosperm and are uniform with the hydration trends detected from the kinetic analysis. No major structural fractures or damage were observed during this early stage of hydration.
The proposed smart cooker architecture combines sensing, data preprocessing, artificial neural network prediction, control logic, and a user interface to support intelligent cooking management. As illustrated in Fig. 6, measurements obtained from the sensing module are preprocessed and normalized before being supplied to the trained artificial neural network. The model predicts the remaining cooking time and cooking energy demand, and these predictions are transmitted to the control logic, which regulates heater power through pulse width modulation while continuously updating the user interface.
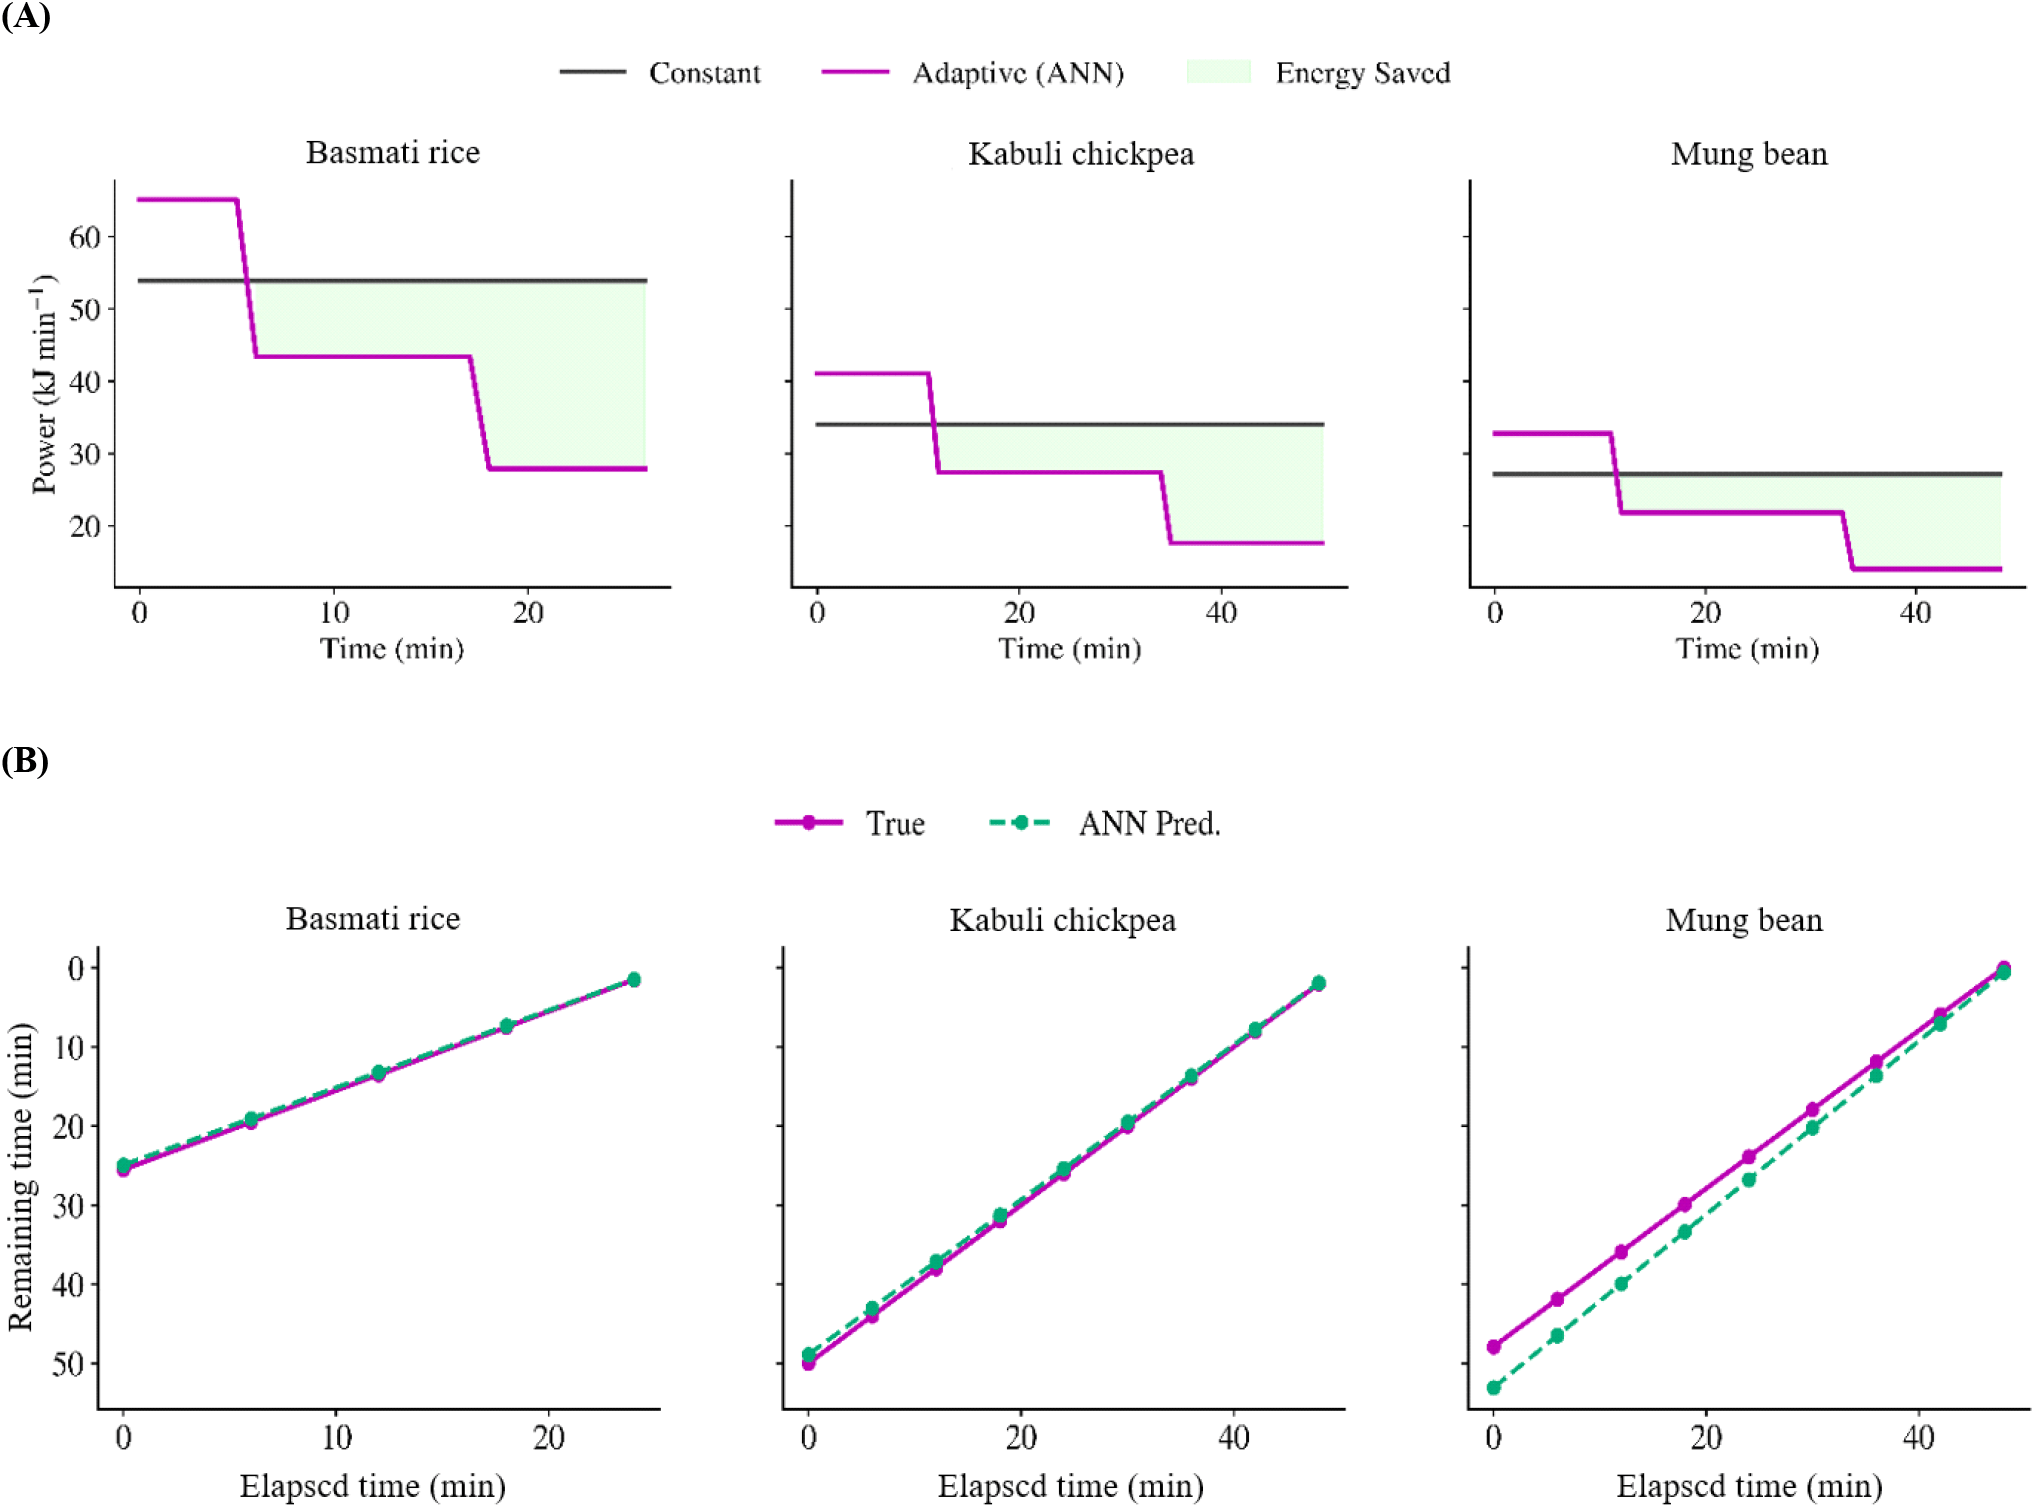
The performance of the proposed cooking strategy was evaluated by simulation using representative samples of Basmati rice, Kabuli chickpea, and mung bean. The trained artificial neural network generated predictions of cooking time and energy demand that were used to construct adaptive heating schedules. As hydration progressed and thermal resistance decreased, heater power was gradually reduced during the later stages of cooking. As shown in Fig. 7A, the adaptive heating strategy reduced the estimated cooking energy consumption by approximately 18% to 22% compared with conventional constant heating. The largest reductions were observed for chickpea and mung bean because of their longer cooking durations, whereas Basmati rice exhibited smaller energy savings owing to its shorter cooking time. The prediction capability of the model was further assessed by updating the estimated remaining cooking time throughout the cooking process. As shown in Fig. 7B, the predicted remaining cooking time progressively converged on the measured remaining cooking time for all three representative food types, indicating stable prediction performance during cooking. Preliminary linear regression models produced lower prediction accuracy than the ANN, confirming that nonlinear relationships between hydration behaviour and thermal processing are better represented by the proposed model. Overall, the simulation results depict that the proposed framework provides an effective approach for adaptive cooking control and energy efficient thermal processing.
4. Conclusions
This study developed an artificial intelligence embedded framework for optimizing the soaking and cooking of rice and legumes by integrating hydration kinetics with artificial neural network prediction. Experimental hydration behavior was described using the Peleg model, showing that increasing soaking temperature accelerated water absorption and increased equilibrium moisture content, leading to reductions in cooking time of up to 40% for rice and approximately 30% for legumes, together with approximately 20% lower cooking energy compared with minimal soaking conditions. The ANN model, developed using soaking temperature, soaking time, food type, variety, and moisture content as input variables, predicted cooking time and energy consumption with coefficients of determination (R2) of 0.98 and 0.97, respectively, while independent validation yielded R2 values of 0.944 for cooking time and 0.935 for energy. Fivefold cross validation generated mean R2 values of 0.973 and 0.951 for cooking time and energy prediction, respectively, indicating consistent model performance across different data partitions. The developed predictive framework provides a quantitative basis for adaptive cooking control and energy efficient thermal processing of cereals and legumes. Development of a smart cooker prototype incorporating the trained ANN model and embedded control hardware is currently underway to enable experimental validation of real time prediction and adaptive heating under practical cooking conditions.