1. Introduction
Tomato (Solanum lycopersicum L.) is an annual crop belonging to the family Solanaceae and is one of the most widely consumed fruit vegetables worldwide (Collins et al., 2022). Tomato has been recognized as one of the worldߣs top ten health foods by Time magazine, largely due to its richness in functional compounds (Bhowmik et al., 2012; Yong et al., 2023). With its distinctive flavor and appealing bright red color, tomato is consumed not only fresh but also as a raw material for a variety of processed products, such as juice, paste, sauce, puree, ketchup, and canned goods, with its consumption steadily increasing each year (FAO, 2025; Schwingshackl et al., 2017). In recent years, the development of diverse cultivars with various sizes and colors has further expanded its popularity as a snack and dessert item (Hwang and Kim, 2022; Jung and Hwang, 2021). Tomatoes are rich in carotenoids such as lycopene, β-carotene, and lutein, which contribute to their characteristic color, antioxidant activity, and overall quality (Borguini et al., 2009; Yin et al., 2019). These compounds, along with phenolics and flavonoids, are key determinants of tomato flavor and nutritional functionality, making them important indicators for evaluating fruit quality (Koh et al., 2017; Upritchard et al., 2000).
The content of bioactive compounds and quality characteristics of tomatoes are influenced by various factors, such as cultivar, fruit size, maturity, cultivation area, soil conditions, and climate (Chand et al., 2020; Zhou et al., 2019). Different cultivars, such as large-fruited tomatoes and cherry tomatoes, not only vary in physical characteristics like size and color, but also show substantial differences in the accumulation of functional compounds due to interactions with the cultivation environment (Zhou et al., 2019). For effective quality control and functional enhancement, comprehensive understanding of both cultivar and environmental conditions is essential. For instance, high temperature and abundant sunlight are associated with increased lycopene and carotenoid content, whereas high-altitude cultivation tends to enhance the accumulation of polyphenols and flavonoids (Chand et al., 2020; Tilahun et al., 2017). Thus, the interaction between cultivar and cultivation environment plays a key role in determining the functional and quality attributes of tomatoes.
Quality evaluation of tomatoes should incorporate not only physicochemical indices such as size, weight, color, moisture content, sugar content, acidity, and pH, which strongly influence consumer preference (Baldwin et al., 2015). The balance between sugar and acidity is a critical determinant of tomato flavor, and this balance is highly dependent on cultivar and cultivation conditions. Recently, advances in electronic tongue technology have enabled the objective and quantitative analysis of complex electronic tongue response profiles, including sourness, sweetness, umami, saltiness, and bitterness, thereby providing an accurate assessment of flavor differences among cultivars and the influence of cultivation environments (Jo et al., 2016; Magnani et al., 2024). This technology provides reproducible and quantitative assessment of electronic tongue response variation among cultivars, complementing traditional biochemical analyses.
However, few comparative studies have integrated objective electronic tongue response profiles with biochemical and antioxidant analyses across multiple tomato cultivars from diverse regions. This integrative approach is expected to provide a more comprehensive understanding of the relationship between electronic tongue response profiles and functional attributes of tomatoes. In this study, sixteen tomato cultivars were comprehensively evaluated for their physicochemical properties (size, weight, color, moisture, sugar content, acidity, and pH) and electronic tongue response profiles (sourness, sweetness, umami, saltiness, and bitterness) using an electronic tongue system. Furthermore, major carotenoids (lycopene, lutein, and β-carotene), polyphenols, flavonoids, and antioxidant activity were analyzed to elucidate the effects of cultivar and cultivation environment on tomato quality and functional properties. Particularly, the objective quality evaluation incorporating electronic tongue data is expected to provide valuable scientific evidence for reflecting consumer preferences and for guiding the development of new functional tomato cultivars. Therefore, this study aimed to comprehensively evaluate the physicochemical, electronic tongue response profiles, and bioactive properties of sixteen tomato cultivars from different regions in Korea. Furthermore, we investigated how cultivar and growing environment influence their quality traits, sensor-based flavor profiles, and antioxidant potential.
2. Materials and methods
Sixteen tomato cultivars (Pink Top, Kyupirang, Super Dotaerang, Sun Red, Sun Glove, TP-7 Plus, Lovely 250, Gwangbok, TY-Sun, and other commercially available Korean cultivars) were obtained at the red-ripe stage from a large-scale supermarket in Anseong, Korea. The samples were originally cultivated in various regions of Korea (e.g., Jeonju, Gimje, Nonsan, Changwon, Buyeo, Hwaseong, Iksan, and Seosan) and represent major commercial and research-recognized tomato varieties widely grown nationwide, including large-fruit, medium-fruit, and cherry tomato types that reflect regional diversity in genotype and growing environments. Because samples were obtained from retail sources rather than directly from experimental fields, detailed management records (e.g., fertilizer application rates, irrigation schedule, and exact harvest dates) and in-situ soil analyses were not available for all cultivars. Consequently, the present study focuses on comparative profiling of physicochemical, electronic tongue response profiles, and bioactive properties of market-available fruits; site-specific agronomic variables were not directly controlled.
The samples were washed under running water, air-dried to remove surface moisture, and prepared for analysis. Gallic acid, catechin, Folin-Ciocalteuߣs phenol reagent, and 1,1-diphenyl-2-picrylhydrazyl (DPPH) were purchased from Sigma-Aldrich Co. (St. Louis, MO, USA). 2,2′-azino-bis (3-ethylbenzothiazoline-6-sulfonic acid) diammonium salt (ABTS) was obtained from Fluka (Heidelberg, Germany). All other reagents used in this study were of analytical grade and purchased from Sigma-Aldrich Co. and Junsei Chemical Co., Ltd. (Tokyo, Japan). Analytical-grade reagents were used for general analyses and HPLC-grade solvents for chromatographic determination.
Fruit length and diameter were measured in centimeters (n = 10 fruits per cultivar) using a ruler, and fruit weight was determined using an electronic balance. Color parameters of tomato skin, including lightness (L*), redness (a*), and yellowness (b*), were determined at the equatorial region of each fruitusing a colorimeter (Chroma Meter CR-300, Minolta, Tokyo, Japan). The instrument was calibrated against a standard white plate (L* = 97.10, a* = +0.24, b* = +1.75). For each cultivar, ten tomatoes were randomly selected, and color was measured at three different points per fruit; the average value was used for analysis.
Moisture content was determined according to the AOAC (2019), Method 925.09, by drying homogenized samples at 105°C in a drying oven (EYELA, Tokyo, Japan). For the determination of soluble solids, acidity, and pH, homogenized tomato samples were prepared using a blender (KHC-1000, Kitchenart, Seoul, Korea). Three grams of homogenized sample were mixed with 27 mL of distilled water, vortexed, and centrifuged at 13,500 ×g for 10 min (Mega17R, Hanil, Seoul, Korea). Soluble solids (°Brix) were measured using a refractometer (PR-201, Atago, Tokyo, Japan) in triplicate. pH was determined with a pH meter (GMK-875, Mettler Toledo, Greifensee, Switzerland) in triplicate.
For organic acid and free sugar analysis, freeze-dried tomato powder (1 g) was extracted with 29 mL of distilled water, centrifuged, and filtered through filter paper and a 0.45 μm membrane filter. Organic acids were analyzed using HPLC-DAD (Agilent 1260 Infinity, Agilent, Santa Clara, CA, USA) equipped with a Shodex RSpak KC-811 column (300 mm × 8.0 mm, Showa Denko America, Inc., New York, NY, USA). The mobile phase was 3 mM perchloric acid solution at a flow rate of 0.7 mL/min, with analysis performed at 80°C for 35 min. Detection of organic acids was performed at 210 nm using calibration curves (R2 > 0.998). Seven standard acids (phosphoric, citric, tartaric, malic, succinic, lactic, and acetic acids) were used for identification and quantification.
Free sugars were analyzed using HPLC-RI (Ultimate 3000, Thermo Scientific, Waltham, MA, USA) with a Sugar-pak column (300 × 6.5 mm, Waters, Milford, MA, USA). Water was used as the mobile phase at a flow rate of 0.5 mL/min, and analysis was carried out at 70°C for 35 min. The injection volume was 10 μL.
Sensor-based attributes of tomato samples were measured using an electronic tongue system (TS-5000Z, Insent Inc., Atsugi, Japan). The system was equipped with six sensors (AAE, CT0, CA0, GL1, AE1, and C00) specific to sourness, sweetness, umami, saltiness, bitterness, and astringency. In addition, aftertaste-B (bitterness-related) and aftertaste-A (astringency-related) values were recorded, representing the residual potential difference on the sensor surface after rinsing, which reflects the persistent sensor response following the initial output. Fresh tomatoes were homogenized, filtered through a 0.45 μm membrane filter, and analyzed at room temperature. The instrument was equipped with 6 chemical sensors designed to detect specific taste components and convert the responses into electrochemical signals. Ten milliliters of sample were analyzed in triplicate. The sensors were calibrated with distilled water before and after measurement.
Total polyphenols were determined using the Folin-Ciocalteu method (Singleton and Rossi, 1965), and total flavonoids were measured according to Woisky and Salatino (1998). Tomato extracts were prepared by homogenizing 3 g of sample with 12 mL of 95% ethanol, vortexing, and centrifugation (13,500 ×g, 10 min). Total polyphenol contents were determined by mixing 0.2 mL of extract with 0.4 mL of 10% Folin-Ciocalteuߣs reagent, incubating for 3 min, and adding 0.8 mL of 10% Na2CO3. After incubation in the dark for 1 h, absorbance was measured at 750 nm using a microplate reader (Infinite M200 Pro, Tecan Group Ltd., San Jose, CA, USA). Results were expressed as gallic acid equivalents (GAE, μg/g dry weight sample).
Total flavonoid contents were determined by reacting 0.1 mL of extract with 0.5 mL of distilled water and 30 μL of 5% sodium nitrite solution for 6 min, followed by addition of 60 μL of 10% AlCl3·6H2O for 6 min. Then, 0.2 mL of 1 M NaOH was added, and absorbance was measured at 510 nm. Results were expressed as quercetin equivalents (QE, μg/g dry weight sample).
Freeze-dried tomato powder (100 mg) was extracted with 3 mL of ethyl acetate containing 100 mg/L BHT by vortexing for 1 min, followed by centrifugation (13,500 ×g, 5 min). The extraction was repeated three times until the red color disappeared, and the pooled ethyl acetate extracts were concentrated under vacuum. The dried extract was re-dissolved in 0.25 mL diethyl ether and 0.75 mL of mobile phase (methanol/acetonitrile/tetrahydrofuran, 50:45:5, v/v/v), filtered through a PTFE syringe filter (0.45 μm), and analyzed by HPLC (Shimadzu, Kyoto, Japan) with a C18 Novapak column (3.9 × 150 mm, 5 μm) using the same mobile phase at a flow rate of 1 mL/min. Detection wavelengths were set at 472 nm for lycopene, 450 nm for β-carotene, and 445 nm for lutein. Calibration curves were constructed for each compound (R2 > 0.995) within the range of 0.5-20 μg/mL.
Antioxidant activities were determined using DPPH and ABTS radical scavenging assays (Cheung et al., 2003; Re et al., 1999) and a reducing power assay (Oyaizu, 1986). Tomato extracts were prepared by homogenizing 30 g of sample with 120 mL of 95% ethanol, followed by centrifugation at 13,500 ×g for 10 min. For DPPH scavenging activity, 192 μL of extract was mixed with 768 μL of 50 μM DPPH solution in 95% ethanol and incubated in the dark for 30 min before measuring absorbance at 517 nm.
For ABTS scavenging activity, ABTS radical cation was generated by mixing 7 mM ABTS with 2.45 mM potassium persulfate (2:1 v/v) and incubating for 24 h in the dark. The solution was diluted with ethanol to an absorbance of 0.17 ± 0.03 at 734 nm. Then, 50 μL of extract was mixed with 950 μL of ABTS solution, incubated for 10 min in the dark, and measured at 734 nm. The results of DPPH and ABTS assays were expressed as percent inhibition (% inhibition) according to the following equation:
where Acontrol is the absorbance of the control and Asample is that of the extract.
Reducing power was determined by mixing 0.5 mL of extract with 0.5 mL of 20 mM phosphate buffer (pH 6.6) and 0.5 mL of 1% potassium ferricyanide, followed by incubation at 50°C for 20 min. After adding 1 mL of 10% trichloroacetic acid, the mixture was centrifuged (13,500 ×g, 15 min). One milliliter of the supernatant was mixed with 1 mL of distilled water and 1 mL of ferric chloride, and the absorbance was measured at 720 nm. The resultes were expressed as a percentage (%) relative to the control to ensure consistency with other antioxidnat assays, according to the following equation:
where Acontrol is the absorbance of the control and Asample is that of the extract.
All measurements were performed in triplicate, and the results are expressed as mean ± standard deviation. Prior to analysis, data normality and homogeneity of variances were verified using Shapiro-Wilk and Leveneߣs tests, respectively. Significant differences among samples were determined by one-way ANOVA followed by Duncanߣs multiple range test at p < 0.05.
To visualize the overall relationships among physicochemical properties, bioactive compounds, antioxidant activities, and electronic tongue response profiles, Principal Component Analysis (PCA) was performed. The dataset was standardized (Z-score normalization) to eliminate the influence of different measurement units, and the analysis was based on the correlation matrix. All statistical analyses, including univariate and multivariate methods, were conducted using R software (version 4.3.1; R Core Team, Vienna, Austria). The FactoMineR and factoextra packages were specifically used for PCA visualization.
3. Results and discussion
The size and color characteristics of tomatoes cultivated in different regions are summarized in Table 1. Size-related parameters, including fruit length, diameter, and weight, exhibited substantial variation among samples. Fruit length ranged 2.17-7.43 cm, diameter from 1.87-6.00 cm, and weight from 10.27-185.27 g, representing approximately a 17-fold difference between the smallest and largest fruits. Samples 1, 2, and 3 showed similar length; however, sample 2 had the highest weight, suggesting possible differences in fruit density or flesh content. Samples 2 and 3 exhibited significantly greater diameter and weight, indicating their classification as large-fruited cultivars potentially suitable for processing. In contrast, samples 8, 13, and 14, with weights below 20 g, can be categorized as cherry or specialty cultivars, traits that influence consumer preference and packaging considerations.
Color parameters (L*, a*, b*) also varied significantly among the samples. Lightlness ranged from 21.87 (sample 9) to 38.74 (sample 15), reflecting differences in brightness across cultivars. Generally, samples with higher L* values appeared brighter and more mature. Most samples exhibited positive redness values, confirming red coloration; however, sample 15 showed a negative a* value (−1.15), indicating an immature stage or green-fruited cultivar. The highest redness was observed in sample 5 (20.14), likely associated with elevated lycopene content. Yellowness ranged from 3.23 (sample 9) to 18.67 (sample 14), with sample 14 exhibiting a distinct yellow hue, possibly due to cultivar-specific pigment composition. Samples with higher a* and b* values were considered more mature and vividly colored, whereas those with lower values reflected immaturity or reduced pigment accumulation. The a* value showed a strong positive correlation with lycopene content (r = 0.86, p < 0.01), indicating that deeper red coloration reflects higher pigment accumulation. These results suggest that color intensity can be used as an indirect indicator of lycopene levels in tomatoes.
These results indicate that tomato size and external color characteristics were strongly influenced by both cultivar and cultivation environment, providing important reference data for quality evaluation, processing suitability, and consumer preference. Tomato color is primarily determined by the accumulation of pigments, including lycopene, β-carotene, and chlorophyll, which were closely associated with ripening stage, storability, and antioxidant properties (Collins et al., 2022; Hwang and Kim, 2022).
The observed variations in physical characteristics among the samples are likely attributable to the diverse environmental conditions of their respective cultivation regions. However, as the samples in this study were obtained at the fully ripe stage from commercial markets to ensure high-quality standards for analysis, specific cultivation parameters—such as soil chemical composition, precise climatic variables (temperature and sunshine duration), and detailed irrigation or fertilization regimes could not be directly monitored or controlled. Previous research has emphasized that such environmental factors and soil nutrient availability are critical determinants of fruit development and the biosynthesis of secondary metabolites in tomatoes (Jo et al., 2016). Therefore, while the present findings provide a clear snapshot of the quality attributes of these cultivars, the quantitative impact of specific pre-harvest factors remains a subject for further controlled studies starting from the seedling stage.
The proximate composition of tomatoes, including moisture, soluble solids, acidity, and pH, is presented in Table 2. Moisture content ranged 90.00-94.59%. The highest values were recorded in samples 4 (94.59%), 3 (94.53%), and 2 (94.02%), all exceeding 94%, suggesting high water retention and superior freshness. Conversely, the lowest moisture content was observed in samples 10 (90.00%), 5 (90.15%), 12 (90.29%), and 13 (90.26%), which may indicate denser tissue and relatively higher sugar concentrations. High moisture levels were closely associated with fruit softening and postharvest deterioration (Sinha et al., 2019). Samples 3 and 4, with over 94% moisture, may retain freshness but were likely to be more sensitive to mechanical damage and quality loss, as reported in previous studies.
Sugar content varied widely 3.7-8.9 °Brix, with significant differences among cultivars (p < 0.05). Sample 5 showed the highest value (8.9 °Brix), followed by samples 12 (8.0 °Brix), 10 (7.8 °Brix), and 14 (7.0 °Brix). These cultivars may correspond to small-fruited or concentrated types suitable for fresh consumption as high-sugar tomatoes. In contrast, samples 4 (3.7 °Brix) and 2 (4.5 °Brix) exhibited the lowest sugar content, consistent with their high moisture levels.
Titratable acidity ranged 0.27-0.51%, showing an inverse trend with sugar content. Sample 15 exhibited the highest acidity (0.51%), while samples 7, 8, and 13 also displayed relatively high levels (> 0.40%). Conversely, samples 5 (0.27%), 12 (0.33%), and 14 (0.33%) exhibited low acidity, resulting in a milder sour taste.
The sugar-acid ratio, an important indicator of flavor balance, exhibited a significant positive correlation with sweetness values obtained from the electronic tongue (r = 0.79, p < 0.05), confirming that cultivars with higher ratios were perceived as sweeter. Sample 5 showed the highest value (32.96), indicating the most favorable balance of sweetness and acidity, followed by samples 12 (24.24) and 14 (21.21). In contrast, samples 4 (11.56) and 2 (12.16) recorded the lowest values, reflecting less balanced flavor profiles. Previous studies have highlighted that consumer preference is strongly influenced by the sugar-acid ratio rather than sugar content alone (Agius et al., 2018). Excessively high sugar-acid ratios may result in overly sweet but monotonous flavors, while balanced ratios were generally preferred. Tamaki et al. (2005) reported that although high-sugar tomatoes may appear attractive, they do not always correspond to higher consumer preference in practical consumption contexts such as salads. Similarly, Baldwin et al. (2008) emphasized that the interaction between sugar and acid significantly affects flavor perception and consumer liking.
pH values ranged 3.85-4.56, showing a clear inverse relationship with acidity. The lowest pH was observed in sample 15 (3.85), consistent with its high acidity and strong sourness. In contrast, sample 5 exhibited the highest pH (4.56), together with the highest sugar content and lowest acidity, representing a cultivar with pronounced sweetness. These findings align with previous reports indicating that lower pH corresponds to stronger perceived sourness in tomatoes (Tigist et al., 2013).
The free sugar and organic acid compositions of tomato cultivars were analyzed using high-performance liquid chromatography (HPLC). The quantitative results of these analyses are summarized in Table 3. Glucose and fructose were the predominant free sugars, together accounting for over 95% of the total sugar content. Across all samples, glucose and fructose levels showed notable variation among cultivars, with fructose generally exceeding glucose concentrations (fructose/glucose ratio 1.1-1.2). Cultivars exhibiting higher sugar contents, particularly samples 5, 12, and 16, displayed enhanced sweetness intensity in the electronic tongue analysis. In contrast, samples with lower sugar and higher acid levels (e.g., samples 6 and 7) were perceived as sourer. Pearson correlation analysis revealed that both fructose (r = 0.84) and glucose (r = 0.76) contents were significantly and positively correlated with sweetness scores (p < 0.05), confirming that the fructose-dominant sugar profile strongly influences perceived sweetness.
Among organic acids, citric and malic acids were predominant, and their proportions varied considerably across cultivars. Samples with higher citric and malic acid contents tended to exhibit lower sugar-to-acid ratios, consistent with their more acidic taste characteristics. These results indicate that both sugar composition and organic acid balance collectively determine tomato flavor quality.
Electronic tongue response profiles of 16 tomato cultivars differing in cultivation region and size were analyzed using an electronic tongue, and the results were summarized in Table 4. Sourness intensity varied significantly among samples. Sample 8 exhibited the lowest sourness value (−8.74), while sample 16 showed the highest (−1.62), demonstrating a statistically significant difference between the two. Samples 1 (−1.50), 6 (−1.55), 9 (−1.26), and 10 (−1.91) displayed intermediate sourness with no significant differences among them. Negative sensor values indicate potential differences relative to the reference solution, representing lower signal intensities.
In terms of sweetness, sample 16 recorded the highest value (−1.23), indicating the strongest sweetness, whereas sample 8 exhibited the lowest (−1.39). For umami, sample 16 again ranked highest (8.29), significantly surpassing samples such as 8 (4.99) and 15 (4.82), which showed the lowest umami intensities. Intermediate umami values were observed in samples 2 (6.48), 3 (6.95), 7 (6.95), 11 (6.42), 12 (6.40), 13 (6.38), and 14 (7.63). A higher umami-replated resonse was observed in samples with moderate organic acid and sugar levels, suggesting synergistic effects between amino acid-derived compounds and primary chemical constituents. Saltiness was highest in sample 8 (9.03), followed by samples 1 (8.37) and 15 (8.24), while sample 4 showed the lowest intensity (3.64). Bitterness was most pronounced in sample 16 (1.45), while samples 1 (−1.89), 9 (−1.63), 13 (−1.74), and 15 (−1.77) exhibited the lowest bitterness levels. Astringency was strongest in sample 16 (−1.14) and weakest in samples 2 (−1.70), 3 (−1.72), and 6 (−1.70). Aftertaste-A was highest in sample 15 (1.62), whereas aftertaste-B was most pronounced in sample 16 (1.78). Richness was significantly higher in samples 11 (3.99), 12 (4.11), 13 (4.12), 14 (4.40), 15 (4.21), and 16 (4.40), compared to other cultivars.
Overall, the nine electronic tongue response attributes measured by the electronic tongue revealed statistically significant differences among the 16 tomato samples. In particular, sourness, sweetness, umami, and saltiness showed clear distinctions between cultivars, suggesting their crucial roles in determining the instrumental tongue response quality. Previous studies have emphasized that sourness and sweetness were key determinants of flavor balance and consumer acceptance (Missio and Renau, 2015; Sinesio et al., 2021). Furthermore, umami compounds, such as glutamic acid, and 5′-nucleotides, play a critical role in enhancing flavor perception and consumer preference (Sorrequieta et al., 2010).
In this study, electronic tongue response attributes were evaluated using an electronic tongue system to obtain objective and reproducible electronic tongue response profiles. Although electronic tongue responses correlate with human taste perception in many food matrices, they do not fully replace human hedonic evaluations. Therefore, the present results should be interpreted as instrument-based tongue response profiling; future work should include consumer hedonic testing to validate preference-related conclusions. Volatile compounds are key contributors to tomato aroma and overall flavor perception. GC-MS analysis was not performed in this study due to resource constraints. As a limitation, the absence of volatile profiling restricts our ability to link aroma-active compounds to the observed electronic-tongue and biochemical patterns. Future investigations will incorporate volatile profiling and integrate the volatile, non-volatile, and instrumental tongue response datasets through multivariate methods to obtain a comprehensive electronic tongue response-function framework.
The electronic tongue profiling allowed for an objective and highly reproducible comparison of basic electronic tongue response attributes among the tomato samples, minimizing the subjective bias inherent in human sensory evaluation. However, it should be noted that these instrumental values may not fully reflect the holistic sensory experience or overall consumer preference, which are typically influenced by complex interactions between texture, aroma, and psychological factors. Previous studies have demonstrated varying degrees of correlation between electronic tongue sensor outputs and consumer liking (Magnani et al., 2024), suggesting that while the E-tongue is a powerful tool for quantifying electronic tongue response intensity, it does not directly measure overall palatability. Therefore, the present results should be interpreted as a fundamental electronic tongue response mapping, and future research incorporating human sensory panels is necessary to validate these findings in the context of actual consumer satisfaction.
The total polyphenol and flavonoid contents of tomatoes from different cultivation regions were presented in Table 5. The total polyphenol content ranged from 269.35 μg GAE/g (sample 2) to 302.64 μg GAE/g (sample 9), showing statistically significant differences among samples (p < 0.05). Sample 9 exhibited the highest polyphenol concentration, which was significantly higher than that of samples 2, 1, and 3. Samples 12 (297.32 μg GAE/g), 13 (295.47 μg GAE/g), and 10 (293.42 μg GAE/g) also demonstrated relatively high polyphenol levels, forming the upper group.
Total flavonoid contents varied markedly among samples as well. The lowest level was observed in sample 2 (31.21 μg QE/g), while the highest was found in sample 9 (211.00 μg QE/g). Samples 8 (152.62 μg QE/g) and 10 (123.47 μg QE/g) also exhibited relatively high concentrations, with statistically significant differences compared to lower-level samples. In general, cultivars with higher phenolic and flavonoid contents, particularly sample 9, exhibited stronger antioxidant activities. Pearson correlation analysis revealed strong positive associations between total polyphenol and DPPH scavenging activity (r = 0.83) and between total flavonoid and ABTS activity (r = 0.81) (p < 0.01), indicating that these compounds substantially contribute to the antioxidant potential of tomato cultivars. In contrast, samples 1, 2, and 3 showed values below 45 μg QE/g, highlighting a clear disparity.
Previous studies have shown that antioxidant composition in tomatoes varies with cultivar, cultivation environment, and harvest stage. Kaboré et al. (2022) reported significant regional differences in total phenols, flavonoids, and carotenoids, affecting antioxidant capacity and flavor. Hernández-Vega et al. (2025) highlighted the roles of environmental factors such as light, temperature, and water availability in flavonoid and polyphenol synthesis. Lima et al. (2022) demonstrated that altitude and climate influence antioxidant levels, with high-altitude tomatoes exhibiting higher phenolic and flavonoid contents. These findings indicate that optimizing cultivation practices is essential for enhancing antioxidant potential and maintaining tomato quality.
The carotenoid composition of tomatoes was analyzed by HPLC and expressed as μg/g dry weight (Table 6). Lycopene was the predominant carotenoid, followed by β-carotene and lutein. An inverse trend between lycopene and β-carotene levels was observed, which may result from metabolic competition via lycopene β-cyclase, converting lycopene into β-carotene.
All samples were harvested at full ripeness. Lutein content ranged from 0.69 μg/g (sample 13) to 3.34 μg/g (sample 7). Sample 7 exhibited significantly higher lutein concentrations than the other cultivars, while samples 1 (2.04 μg/g), 2 (2.01 μg/g), and 9 (2.29 μg/g) also showed relatively high levels. In contrast, samples 11, 12, 13, 14, and 16 all contained less than 1.0 μg/g.
Lycopene content ranged from 40.24 μg/g (sample 15) to 333.73 μg/g (sample 7). Samples 6 (305.84 μg/g), 12 (326.89 μg/g), 14 (293.58 μg/g), and 5 (289.77 μg/g) also exhibited high concentrations, whereas sample 15 showed the lowest lycopene content, suggesting limited pigment accumulation possibly due to environmental conditions. β-Carotene content varied from 27.92 μg/g (sample 14) to 136.67 μg/g (sample 9). Samples 4 (131.85 μg/g), 3 (131.14 μg/g), and 12 (115.71 μg/g) also ranked among the higher groups. Interestingly, samples with high lycopene levels, such as 14 and 5, showed relatively low β-carotene contents. Sample 7 displayed the highest concentrations of both lutein and lycopene, suggesting strong potential as a functional tomato cultivar. Conversely, sample 15 exhibited consistently low levels of all three carotenoids.
These results demonstrate that the levels of major carotenoids in tomatoes (lutein, lycopene, and β-carotene) vary considerably depending on cultivar and cultivation conditions. Lycopene accumulation is particularly known to increase under warm and humid conditions (Astija et al., 2023). Carotenoid synthesis is influenced by cultivar genetics, environmental stresses, photosynthetic activity, temperature, and soil conditions (Lima et al., 2022). Collectively, these findings suggest that selecting suitable cultivars and managing cultivation environments can optimize specific carotenoid contents, providing valuable insights for enhancing functional properties and improving tomato quality.
The antioxidant activities of tomato powders, evaluated using DPPH and ABTS radical scavenging assays and reducing power, were summarized in Table 7. Considerable variation was observed among cultivars. In general, samples 8, 9, 10, 12, and 13 exhibited consistently higher antioxidant performance across all assays, whereas samples 2 and 5 showed relatively low activity. DPPH scavenging activity ranged from 54.6% to 69.2%, and ABTS activity from 39.0% to 71.6%, showing significant cultivar-dependent differences (p < 0.05). The reducing power of the tomato extracts, expressed as a percentage relative to the control, ranged from 352.67% to 886.50%. Sample 9 exhibited the highest reducing power (886.50%), followed by samples 8 (625.67%) and 13 (589.33%). These results indicate that sample 9 possesses the most potent electron-donating ability among the tested cultivars, which is consistent with its high DPPH and ABTS radical scavenging activities.
Pearson correlation analysis revealed strong positive relationships between total polyphenol and flavonoid contents and antioxidant capacity (DPPH, r = 0.89; ABTS, r = 0.84; reducing power, r = 0.76, p < 0.01). Lycopene and β-carotene contents also showed significant correlations with overall antioxidant activity (r = 0.78 and 0.72, respectively), indicating that both phenolic and carotenoid compounds contribute synergistically to tomato antioxidant potential.
Collectively, these findings demonstrate that the antioxidant activity of tomato cultivars is primarily governed by their bioactive compound composition, which is in turn influenced by genotype and environmental conditions.
PCA was applied to the entire dataset, integrating physicochemical properties, bioactive compounds, antioxidant capacities, and electronic tongue profiles, to provide a comprehensive view of cultivar characteristics. The biplot (Fig. 1) illustrates the distribution of the 16 tomato cultivars and the correlations among the 23 analyzed variables. The first two principal components (PCs) explained 61.36% of the total variance (42.84% for PC1 and 18.52% for PC2), effectively reducing the dimensionality of the complex dataset.
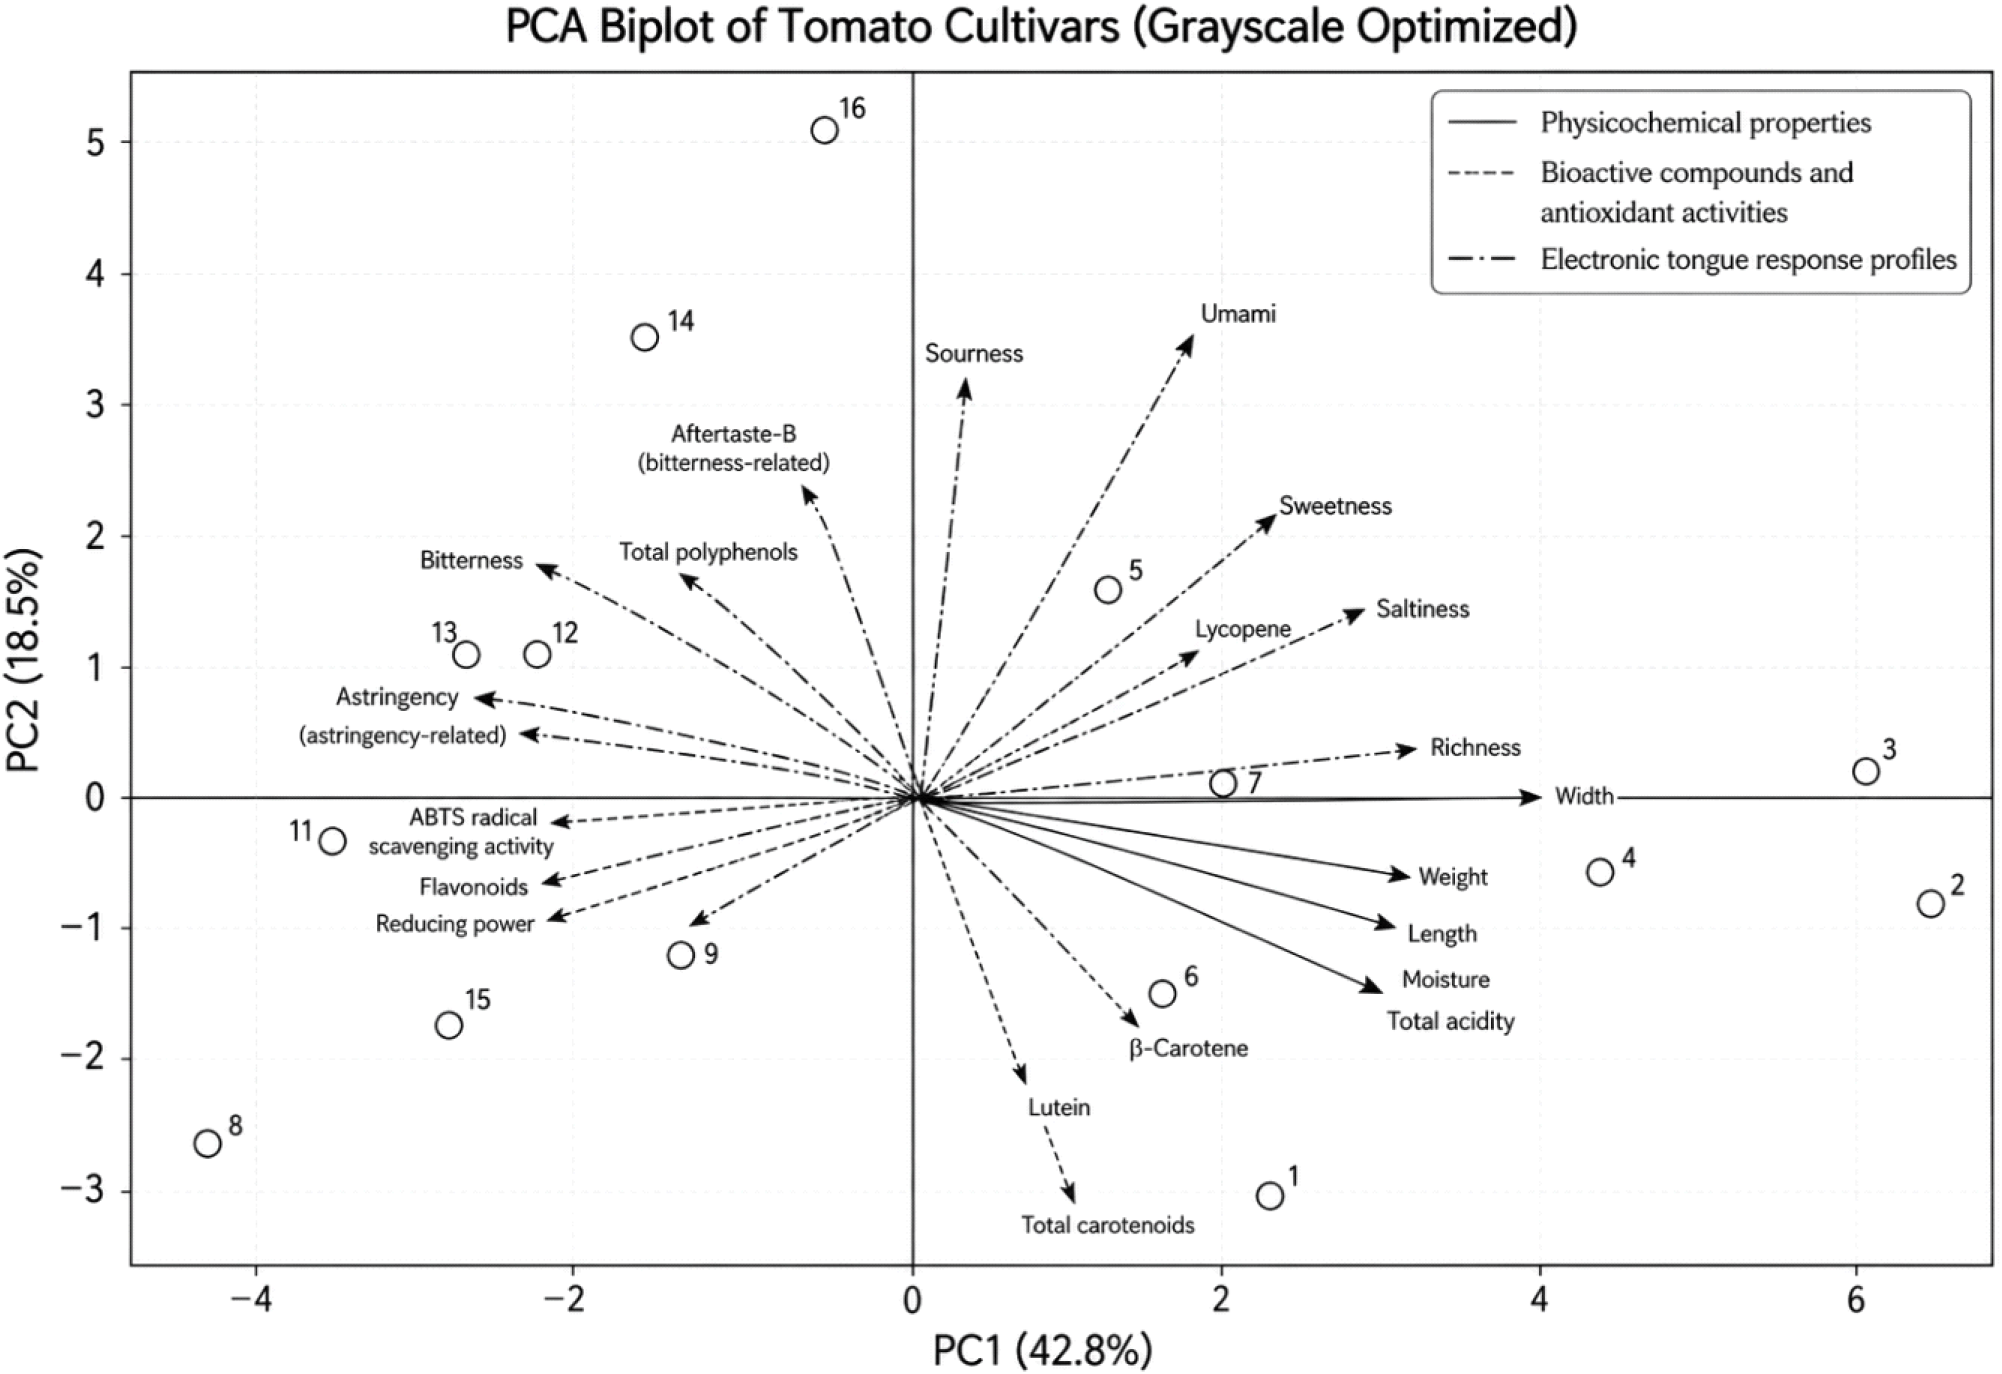
PC1 clearly differentiated the cultivars based on a trade-off between physical size and functional quality. Variables related to fruit size, such as weight, width, and length, showed strong positive loadings on PC1. In contrast, bioactive compounds (total polyphenols, flavonoids, lycopene, and β-carotene), antioxidant activities (DPPH, ABTS, and reducing power), and sweetness (instrumental sweetness profile and Brix) were clustered on the negative side of PC1. This distribution statistically confirms the dilution effect in tomatoes, where larger fruits tend to have higher moisture content but lower concentrations of soluble solids and secondary metabolites. Consequently, small-fruited cultivars positioned on the negative side of PC1 (e.g., Samples 8, 9, 10, and 12) were characterized as high-quality genotypes possessing superior antioxidant potential and intense sweetness. PC2 was primarily driven by the electronic tongue response profiles, which distinguished the cultivars based on their distinctive response patterns. Umami and saltiness showed positive loadings on PC2, whereas sourness and total acidity were positioned in the negative direction, indicating that PC2 reflects the balance between savory-related and acidic response profiles. For instance, cultivars located in the upper quadrants exhibited a stronger umami intensity, while those in the lower quadrants were characterized by dominant acidity.
Collectively, this integrated multivariate analysis offers data-driven insights for breeding programs and product development. The strong correlation observed between the electronic tongueߣs sweetness score and bioactive compounds (negative PC1 axis) suggests that selecting for high-sugar traits can concurrently enhance antioxidant potential, aligning with consumer preferences for both flavor and health. Furthermore, the PCA results statistically confirm the dilution effect, implying that breeding strategies should aim to break the negative linkage between fruit size and nutritional density. In terms of functional product development, cultivars positioned in the high-functional/high-flavor cluster (specifically samples 8, 9, and 12) are identified as optimal candidates for premium functional foods.
4. Conclusions
This study comprehensively evaluated the physical, physicochemical, electronic tongue response profiles, and bioactive characteristics of sixteen tomato cultivars, harvested at the red-ripe stage from various regions of Korea. The results demonstrated clear varietal and environmental influences on fruit quality, electronic tongue response profiles, and antioxidant potential. Notably, multivariate analysis (PCA) identified a distinct trade-off between fruit size and nutritional density, confirming the dilution effect where larger fruits tend to have lower concentrations of bioactive compounds.
Among the cultivars, Samples 8, 9, and 12 were clustered as high-quality genotypes, exhibiting the highest accumulation of total polyphenols, flavonoids, lycopene, β-carotene, and antioxidant activity. This integrated approach using PCA proved that electronic-tongue sweetness is strongly correlated with functional components, suggesting that high-sugar traits can serve as a marker for antioxidant potential. Importantly, this research provides a multidimensional understanding of flavor and functional quality by integrating electronic-tongue profiling with biochemical analyses. These findings offer practical guidance for breeding strategies, specifically recommending the selection of genotypes that overcome the negative linkage between yield and quality, and support the development of high-quality functional tomato products. Future studies should further clarify how specific cultivation factors, including region, genotype, and harvest timing, influence bioactive compound accumulation and electronic tongue response profiles.