


1. Introduction
The oxidative stability of edible oils is a critical determinant of their shelf life, nutritional quality, sensory acceptability, and overall consumer acceptance (Kochhar and Henry, 2009). Lipid oxidation results in the development of undesirable flavors, unpleasant odors, loss of essential nutrients, and potentially harmful compounds. This limits the quality and usability of oil-based food products (Nguyen et al., 2024). Refined bleached shea olein (RBSO) has gained increasing attention in the food industry owing to its favorable fatty acid profile and the presence of bioactive minor components such as tocopherols and phytosterols (Abdel-Razek et al., 2023). However, the high level of unsaturated fatty acids that contributes to its nutritional appeal also makes RBSO particularly susceptible to oxidative degradation when exposed to heat, oxygen, and light (Kūka et al., 2018). Consequently, enhancing the oxidative stability of RBSO represents a substantial technological challenge. To mitigate oxidative deterioration, antioxidants are commonly incorporated into edible oils (Farooq et al., 2021; Nid Ahmed et al., 2024; Saoudi et al., 2016). Synthetic antioxidants, including butylated hydroxytoluene (BHT), have traditionally been used owing to their effectiveness and low cost. Nevertheless, rising consumer concerns about possible health risks linked to synthetic additives have increased interest in natural antioxidant options (Ghosh et al., 2022).
Accordingly, spices and herbs, including cloves, rosemary, ginger, and turmeric, have attracted considerable attention as sources of natural antioxidants capable of retarding lipid oxidation in food systems (Balogun et al., 2023; Kour et al., 2022; Nazdar et al., 2024). However, raw spices present several quality and safety challenges, including microbial contamination, poor solubility, and regulatory non-compliance. Oleoresins, which are concentrated extracts obtained from spices, offer distinct advantages over raw spices, including improved solubility, enhanced color and aroma, standardized quality, extended shelf life, and superior retention of bioactive compounds (Procopio et al., 2022). Importantly, oleoresins capture both volatile and non-volatile constituents of spices, enhancing their usefulness in food systems (Mohan et al., 2024; Procopio et al., 2022). Numerous studies have demonstrated that spice oleoresins possess antibacterial, antioxidant, anti-inflammatory, and anticancer properties, further supporting their value in enhancing food quality (Benmeziane-Derradji and Aoun, 2022; Nagavekar and Singhal, 2019; Subtain et al., 2024). Among culinary spices, ginger (Zingiber officinale) and turmeric (Curcuma domestica) are particularly notable because of their widespread use in culinary and traditional medicinal applications (Sah et al., 2012; Shahrajabian et al., 2019). Previous studies have largely focused on the antioxidant properties of ginger and turmeric individually, using powders, essential oils, or extracts in different food matrices (Balogun et al., 2023; Kour et al., 2022; Nazdar et al., 2024). Comparative studies have reported that turmeric may exhibit higher flavonoid content and superior antioxidant capacity than ginger in certain systems (Ajanaku et al., 2022; Erdoğan and Erbaş, 2021). Studies have also shown that ginger and turmeric oleoresins can enhance the functional properties of food products, including milk and emulsified systems (Jayathilake et al., 2022). However, the combined application of ginger and turmeric oleoresins, particularly in lipid systems, has received limited research attention. The application of oleoresins to enhance the oxidative stability of edible oils is gaining attention, and further research is needed, particularly for underutilized oils like shea olein. Therefore, it is crucial to understand the phytochemical properties and effectiveness of ginger and turmeric oleoresins for enhancing the oxidative stability of RBSO. The objective of this study was to address an important research gap by providing scientific evidence supporting the use of spice-derived oleoresins as natural antioxidants for food oil stabilization. Furthermore, Nigeria is a leading global producer of ginger and turmeric, with an annual ginger output of about 691,239 tons and accounting for approximately 3% of global turmeric production. Despite this production capacity, substantial quantities of oleoresins are still imported, underscoring the need for local value addition, standardization, and expanded research on spice oleoresin development. Accordingly, this study aimed to characterize oleoresins extracted from different ginger-turmeric blends in terms of yield, phytochemical composition, carotenoid content, antioxidant activity, and color properties, and to evaluate selected oleoresins in RBSO.
2. Materials and methods
Fresh turmeric rhizomes and ginger were obtained from Bodija Market in Ibadan, southwest Nigeria. All reagents and chemicals, including Folin-Ciocalteu (FC) reagent and 1,1-diphenyl-2-picrylhydrazyl (DPPH), quercetin, and gallic acid, were purchased from Merck Co. (Darmstadt, Germany). Solvents were purchased from Fisher Scientific (Waltham, MA, USA), and other reagents were purchased from Merck Co.
Ginger and turmeric samples were sorted, washed, sliced, and dried for three days in a parabolic-shaped solar dryer (Nigerian Stored Product Research Institute, Ibadan, Nigeria), under average ambient conditions of 33.3°C and 70.9% relative humidity. The dried samples were milled into powder using a laboratory grinder (IKA Werke GmbH & Co. KG, Staufen, Germany). The powdered samples were blended into seven predefined ginger-turmeric formulations selected to span the full composition range, from 100% turmeric to 100% ginger, with intermediate blending ratios: Oleo 1 (17% ginger and 83% turmeric), Oleo 2 (100% turmeric), Oleo 3 (36% ginger and 64% turmeric), Oleo 4 (53% ginger and 47% turmeric), Oleo 5 (70% ginger and 30% turmeric), Oleo 6 (85% ginger and 15% turmeric), and Oleo 7 (100% ginger). Each formulation underwent oleoresin extraction without further modification.
Oleoresins were extracted using the maceration method described by Nurhadi et al. (2020). Each formulation (250 g) was macerated in 1,500 mL of 96% ethanol using cold percolation for 72 h with occasional shaking. The extract was vacuum-filtered, and the residue was re-extracted with fresh solvent to ensure maximum recovery. The filtrates were combined and concentrated using a rotary evaporator (OSB-2100, Eyela, Shanghai, China) at 30°C to remove residual solvent. The resulting extract was further dried in a vacuum oven at 45°C until a constant weight was achieved. Oleoresin yield was calculated using the equation provided below. The extracted oleoresins were stored in amber glass bottles wrapped in aluminum foil and placed in a chest freezer (Defy Appliances, Durban, KZN, South Africa) at −20°C until further analysis.
where We represents the extract weight after evaporation, and Ws represents the sample weight before extraction.
Oleoresins were diluted in methanol to a concentration of 10 mg/mL, and the L*, a*, and b* values were measured using a colorimeter (HunterLab ColorFlex, Reston, VA, USA) with D50 standard illumination and a 2° observer angle. The following color parameters were then calculated using equations (2)–(5) according to Azab et al. (2022):
where C represents the chroma (color saturation), H represents the hue angle, BI represents the browning index, and ΔE represents the color difference (Azab et al., 2022).
The TPC of the oleoresin extracts was quantified using a modified FC assay adapted from a method reported by Ozdal et al. (2019). Oleoresin samples were precisely weighed and solubilized in 75% (v/v) ethanol to yield solutions at a concentration of 5 mg/mL. Gallic acid was used to generate a standard calibration curve. In a 96-well microplate, measured volumes of either the oleoresin solutions or gallic acid standards were combined with 30 μL of FC reagent, followed by the addition of 150 μL of 3.5% (w/v) sodium carbonate solution. The reaction mixtures were incubated at 40°C for 30 min, and absorbance was subsequently recorded at 765 nm using a microplate spectrophotometer (VersaMax Tunable Microplate Reader, Molecular Devices, CA, USA). Quantification was based on a gallic acid calibration curve described by the equation y = 0.0045x + 0.0236, with a coefficient of determination (R2) of 0.9981.
The TFC of the oleoresin extracts was determined using the aluminum chloride colorimetric method with minor modifications, as described by Deniz et al. (2021). Briefly, 25 μL of each oleoresin extract or quercetin standard solution was mixed with 95% ethanol, 5 μL of aluminum chloride solution (10%, w/v), 5 μL of sodium acetate solution (1 M), and distilled water in microplate wells. The reaction mixtures were incubated at room temperature for 30 min, and absorbance was subsequently measured at 415 nm using a microplate reader (VersaMax Tunable Microplate Reader, Molecular Devices). TFC was expressed as milligrams of quercetin equivalents per gram of oleoresin (mg QE/g). The calibration curve was defined using the equation y = 1.6645x + 0.3578, with a coefficient of determination (R2) of 0.965.
Total carotenoid content (TCC) of the oleoresin samples was determined according to the method described by Madhusankha et al. (2023), with minor modifications. Briefly, 0.10 g of each oleoresin sample was dissolved in 10 mL of hexane, and absorbance was subsequently measured at 472 and 508 nm using a microplate reader (VersaMax Tunable Microplate Reader, Molecular Devices). The isochromatic red fraction (CR), yellow fraction (CY), and TCC (CT) were calculated using equations (6)–(8), respectively:
where CR represents the red isochromatic fraction, CY the yellow isochromatic fraction, and CT the TCC. A508 and A472 denote the absorbance values measured at 508 and 472 nm, respectively.
The DPPH radical-scavenging activity of the oleoresin samples was assessed using the method described by Pinto et al. (2021). The reference standard (gallic acid) and oleoresin samples were dissolved in ethanol and combined with a DPPH solution. Each well of a 96-well microplate was filled with 30 μL of oleoresin solution and 270 μL of an ethanolic solution containing DPPH (0.138 mg/mL). The plate was then incubated for 40 min at room temperature. Following incubation, a microplate reader (VersaMax Tunable Microplate Reader, Molecular Devices) was used to quantify the decrease in DPPH absorbance at 515 nm. Using gallic acid, a calibration curve with a linearity range of 6.25 to 50 μg/mL and an R2 = 0.9713 was obtained. Therefore, the radical-scavenging activity was computed using equation (9).
where Acontrol represents the absorbance of the DPPH solution (no extract added), and Asample represents the absorbance of the DPPH solution after reaction with the oleoresin extract.
The FRAP of the oleoresin extracts and reference standard (quercetin) was determined as previously reported (Erbiai et al., 2021). Briefly, oleoresin samples dissolved in 75% ethanol were mixed with 25 μL of phosphate buffer (pH 6.6) and 25 μL of potassium ferricyanide [K3Fe(CN)6] (1%, w/v). The mixture was pre-incubated at 50°C for 20 min, followed by the sequential addition of 25 μL of trichloroacetic acid (10%, w/v), 85 μL of distilled water, and 17 μL of FeCl3 solution (0.1%, w/v). Following a 30 min incubation at room temperature, absorbance was measured at 700 nm using a microplate reader (VersaMax Tunable Microplate Reader, Molecular Devices).
The CUPRAC of the oleoresin extracts and the reference standard (gallic acid) was determined using a modified method described by Ribeiro et al. (2011). Briefly, 25 μL of 10 mM copper(II) chloride, 25 μL of 7.5 mM neocuproine, 25 μL of 1 M ammonium acetate buffer (pH 7), 25 μL of the oleoresin sample, and 100 μL of distilled water were combined in each well of a 96-well microplate. The mixture was incubated at room temperature for 30 min, and absorbance was subsequently measured at 450 nm using a microplate reader (VersaMax Tunable Microplate Reader, Molecular Devices).
The metal-chelating activity of the oleoresin samples was determined using a modified method described by Madhusankha et al. (2023). Each oleoresin extract (20 μL) or reference standard (EDTA) was incubated with 2 mM FeCl₂ and 5 mM ferrozine solutions for 10 min at room temperature. The absorbance of the resulting ferrozine-Fe2+ complex was measured at 562 nm using a microplate reader (VersaMax Tunable Microplate Reader, Molecular Devices).
The percentage inhibition of complex formation was calculated using the following equation (10):
where Ablank represents the absorbance of the control (containing all reagents without the test sample), and Asample represents the absorbance of the extract or reference.
Crude shea butter (CSB) was prepared according to Korede et al. (2024), while the refining process was performed following the method described by Tavakoli et al. (2022). Approximately 1 kg of melted CSB at 65°C was treated with 4 mL (0.4% v/w of shea olein) of 85% orthophosphoric acid and homogenized using a high-speed hand mixer (Bosch ErgoMixx, Nazarje, Slovenia) for 2 min. The mixture was then centrifuged using a refrigerated centrifuge (5430R, Eppendorf, Hamburg, Germany) at 4,000 rpm for 30 min at 20°C to remove gums and other phospholipid materials. After degumming, CSB was fractionated into degummed shea olein and degummed shea stearin according to Hwang et al. (2021). A 500 mL portion of degummed shea olein at 50°C was mixed with 2.5 mL of 0.8 N NaOH for 5 min. The emulsion was transferred into a glass beaker and heated in a water bath (WBE601, Labcon, Maraisburg, South Africa) at 90°C for 10 min. Soap stock was separated from the oil by centrifugation (5430R, Eppendorf, Hamburg, Germany) at 4,000 rpm for 30 min at 20°C. The neutralized oil was washed with a 1% sodium chloride solution at a volume 3% greater than the free fatty acid content of the shea olein. This washing step was repeated, with centrifugation, to ensure effective removal of soap stock. The resulting shea olein was dried in an oven at 60°C to reduce its moisture content. Further refining was achieved by bleaching the shea olein at 85°C under vacuum using bentonite for 30 min. Bentonite was added at 2% (w/w) to ensure complete removal of color bodies. The mixture was centrifuged at 4,000 rpm for 20 min to separate the RBSO from the bleaching earth. The RBSO and other fractions were stored at −20°C for further analysis and application.
After oleoresin characterization (Section 2.3), Oleo 1 (17% ginger, 83% turmeric) and Oleo 2 (100% turmeric) exhibited higher yields and superior antioxidant and phytochemical properties than the other formulations (further details provided in the Results and Discussion section). Accordingly, these two oleoresins were prepared as described in Section 2.3 and incorporated into RBSO at concentrations of 100, 200, and 300 μg/g. Precisely measured amounts of Oleo 1 and Oleo 2 were dispersed in the RBSO and gently heated above the melting points of the respective oleoresins with continuous stirring at 200 rpm using a magnetic stirrer (C-Mag HS 7, IKA, Staufen, Germany). Once fully dissolved, the mixtures were cooled in a refrigerated bath maintained at 5°C for 30 min and then allowed to reach room temperature (25 ± 2°C). The treated shea olein samples were then stored at room temperature for at least 24 h prior to analysis.
The PV of the oil samples was determined in accordance with a standard method (AOAC, 2012). An oil sample (5 g) was weighed into a conical flask and dissolved in 30 mL of an acetic acid-chloroform mixture (2:1, v/v). Following this, saturated potassium iodide solution (0.5 mL) was added, and the mixture was gently shaken and left to react for 1 min. Distilled water (30 mL) and starch indicator (0.5 mL) were then introduced, and the liberated iodine was titrated with 0.01 N sodium thiosulfate until the endpoint was reached. A blank determination was performed under identical conditions.
The PV was calculated using the following equation (11):
where S represents the titer value of the sample minus the titer of the blank, and N represents the molarity of the sodium thiosulfate solution.
The p-AV of the oil samples was determined following a standard method (AOCS, 1995) with slight modifications, using a UV-visible microplate reader (VersaMax Tunable Microplate Reader, Molecular Devices) at 350 nm. A 0.25% (w/v) p-anisidine reagent was freshly prepared daily by dissolving 0.25 g of p-anisidine in 100 mL of glacial acetic acid, and its absorbance was confirmed to be below 0.2 prior to use. For analysis, approximately 0.1 g of oil was weighed into a test tube and dissolved in 5 mL of iso-octane. A 2.5 mL aliquot of the solution was transferred to a cuvette, and the absorbance was measured at 350 nm against pure iso-octane as a blank (AB1 for reagent blank and AS1 for sample). Then, 0.5 mL of p-anisidine reagent was added, the cuvette was gently mixed, and the mixture was incubated in the dark for 10 min before measuring the second absorbance (AB2 and AS2).
The p-anisidine value was calculated using the following equation (12):
where D represents the volume of iso-octane used to dissolve the oil sample (mL); AS1 represents the absorbance of the oil solution before reaction with p-anisidine; AS2 represents the absorbance of the oil solution after reaction with p-anisidine; AB1 represents the absorbance of iso-octane before reaction; AB2 represents the absorbance of iso-octane after reaction; and m represents the mass of the oil sample (g).
The conjugated dienes content of the samples was determined using the method described by Kūka et al. (2018). Briefly, approximately 100 mg of each oil sample was weighed into a test tube and dissolved in 50 mL of iso-octane. An aliquot (300 μL) of the solution was transferred to a 96-well microplate, and the absorbance was measured at 234 nm using a microplate reader (VersaMax Tunable Microplate Reader, Molecular Devices). A 1% methyl stearate solution in iso-octane was used as a blank. The concentration of conjugated dienes was calculated using the equation below (13):
where CD represents the concentration of conjugated dienes in the sample; A represents the absorbance of the sample in iso-octane; l represents the path length of the cuvette (1 cm); and ε represents the molar absorptivity of linoleic acid hydroperoxide (25,250 M−1·cm−1). The CD value of the oil sample was then calculated using equation (14):
where 5 × 10⁴ represents the factor accounting for the volume of iso-octane (50 mL) used to dissolve the oil sample, expressed in μL, and m represents the mass of the oil sample (g).
The TBARS content in the oil samples was measured according to Zeb and Ullah (2016) with slight modifications. Briefly, 50 mg of oil was homogenized in 1 mL of 50% glacial acetic acid at 50°C for 2 min and then cooled to room temperature. A 4.0 mM TBA solution was prepared by dissolving 57.66 mg of thiobarbituric acid in 100 mL of glacial acetic acid. Aliquots of 150 μL of the sample solution and 150 μL of TBA solution were added to microplate wells and incubated at 60°C for 60 min to develop a pink chromogen. The blank was prepared by mixing 150 μL of 50% acetic acid with 150 μL of TBA solution. For calibration, a 1 mM malondialdehyde (MDA) standard solution was prepared by dissolving 31.35 mg of MDA tetrabutylammonium salt in 100 mL of glacial acetic acid. Standard solutions at 0.2, 0.4, 0.6, and 0.8 mM were prepared by serial dilution. Aliquots of 150 μL of TBA solution were added to an equal volume of each standard in microplate wells, incubated, and processed identically to the samples. Absorbance was measured at 532 nm using a microplate reader (VersaMax Tunable Microplate Reader, Molecular Devices). A calibration curve of absorbance versus MDA concentration was used to determine TBARS, which were expressed as mmol MDA equivalents per gram of oil.
Oleoresin extraction for each ginger-turmeric formulation was performed independently in two separate batches, which served as biological (processing) replicates and experimental units. All analytical determinations were conducted in triplicate for each independent extract, and mean values were used for statistical analysis. Data are expressed as mean ± SD. One-way analysis of variance (ANOVA) was applied to evaluate the effect of formulation on the measured responses, and significant differences among means were determined using Tukey’s HSD post hoc test at p < 0.05. Statistical analyses were carried out using IBM SPSS Statistics version 27 (IBM Corp., Armonk, IL, USA).
3. Results and discussion
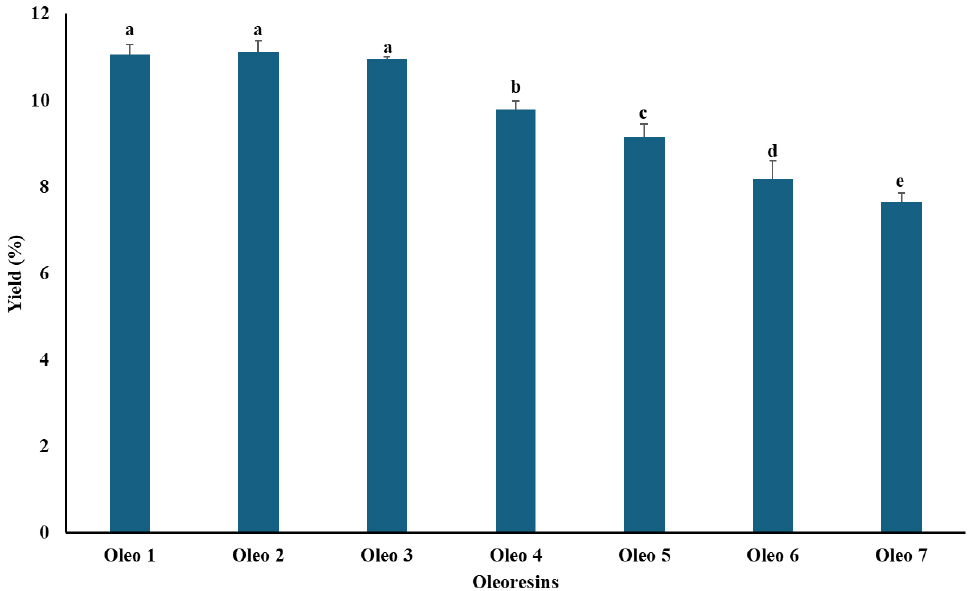
Oleoresin yield, expressed as the ratio of oleoresin obtained to the initial mass of ginger and turmeric powder, is presented in Fig. 1. Both spice type and mixing ratio markedly influenced oleoresin yield, which ranged from 7.61% to 11.14% across all samples. Oleo 2 produced the highest yield (11.14%), closely followed by Oleo 1 (11.09%), whereas Oleo 7 had the lowest yield (7.61%). In the mixed samples, oleoresin yield increased with increasing turmeric content. The yields obtained for Oleo 2 and Oleo 7 are comparable to those reported by Madhusankha et al. (2023), who recorded yields of 10.45% for ginger and 9.46% for turmeric oleoresins using ethanol as the extraction solvent. Oleoresin yield is known to depend on several factors, including the extraction solvent, extraction method, temperature, extraction time, and spice type (Chan et al., 2011). The higher yields observed in the mixed samples may be attributed to the batch extraction (maceration) method, in which prolonged contact between the solvent and plant material may enhance oleoresin recovery. In addition, turmeric contains relatively low levels of volatile oils; therefore, minimal volatile loss during heat treatment may have contributed to the higher yields observed in mixtures with higher turmeric content.
The color parameters of turmeric, ginger, and their mixtures (Table 1) differed significantly (p < 0.05) in lightness (L*), redness-greenness (a*), yellowness-blueness (b*), chroma (C*), hue angle (H*), total color difference (ΔE), and browning index (BI). Oleo 7 exhibited the highest lightness value (L* = 64.10), indicating a lighter color, likely due to pigment dilution in the blended oleoresin. In contrast, Oleo 5 and Oleo 6 had lower L* values (60.95 and 60.91, respectively), suggesting higher pigment concentration and darker coloration. These differences are consistent with reports that pigment composition and concentration strongly influence oleoresin lightness (Fernandes et al., 2024). Redness (a*) values were highest in Oleo 2 (6.43) and Oleo 5 (6.51), reflecting the dominance of curcuminoids and turmeric carotenoids that impart red-yellow hues (Li et al., 2024). In contrast, Oleo 7 had a negative a* value (−1.73), indicating a shift toward greenness, possibly due to chlorophyll derivatives or pigment masking effects in the blends. Yellowness (b*) was highest in Oleo 1 (25.13), consistent with the high curcumin content of turmeric oleoresins, which are characteristically yellow in color (Prasad et al., 2014). Chroma (C*), representing color saturation, was highest in Oleo 2 (26.32), indicating a more intense coloration. This observation aligns with Sharma and Bhat (2021), who reported that synergistic interactions between carotenoids and curcuminoids enhance chromatic intensity in blended oleoresins. Hue angle (H*) varied widely among samples, with Oleo 7 showing the most negative value (−45.05), corresponding to a greenish hue, and Oleo 4 exhibiting the highest positive value (18.65), indicating a shift toward yellow-red tones. These variations may be attributed to differences in carotenoid content and oxidative changes during processing (Wang et al., 2020).
Total color difference (ΔE) values indicated that Oleo 1 had the most visually distinct color (ΔE = 19.42), while Oleo 5 and Oleo 6 had the lowest values (13.66 and 13.67, respectively), suggesting less perceptible color variation. This highlights the role of blending in controlling color appearance through pigment dilution or synergistic masking. BI values were relatively uniform across all samples (0.31-0.33), indicating minimal browning during extraction. This trend is consistent with previous studies showing that antioxidant compounds in spice oleoresins may limit non-enzymatic browning and pigment degradation (Madhusankha et al., 2023). Taken together, these findings suggest that turmeric oleoresins enhance redness and yellowness, while ginger contributes to increased lightness and reduced color saturation. Pigment interactions and oxidative stability during blending may have played important roles in determining the final color characteristics, in agreement with Jiang (2022), who reported that oleoresin color depends on pigment concentration, chemical composition, and stability.
The TPC and TFC of oleoresins derived from ginger, turmeric, and their mixtures are presented in Table 2. Both parameters differed significantly among samples (p < 0.05), reflecting the influence of spice type and blending ratio on phytochemical composition. TPC values ranged from 17.17 to 68.30 mg GAE/g for Oleo 6 and Oleo 2, respectively. Similarly, TFC values varied widely, ranging from 0.69 to 18.73 mg QE/g for ginger-dominant Oleo 7 and turmeric-rich Oleo 1, respectively. The elevated TPC and TFC observed in turmeric-rich samples can be attributed to the predominance of curcuminoids and flavonoid-type polyphenols, including curcumin derivatives, catechins, quercetin, and kaempferol (Erdoğan and Erbaş, 2021; Subtain et al., 2023). These compounds possess conjugated aromatic structures with multiple hydroxyl and methoxy groups, which may enhance their reactivity in both the FC and AlCl3 colorimetric assays, resulting in higher phenolic and flavonoid readings (Erdoğan and Erbaş, 2021; Subtain et al., 2023). These findings align with previous reports on turmeric extracts and oleoresins, which have demonstrated high TPC and TFC values and strong antioxidant potential (Akter et al., 2019; Jayathilake et al., 2022). In contrast, ginger-dominant oleoresins (Oleo 4-7) exhibited lower TPC and TFC values. This may reflect the volatile nature of ginger bioactive compounds, such as gingerols, shogaols, and zingerone, which can be partially lost during processing, as well as their relatively lower degree of hydroxyl substitution, which may lead to reduced assay reactivity (Ghafoor et al., 2020). Nonetheless, although ginger oleoresins contribute fewer flavonoids, they possess complementary antioxidant mechanisms, including enzyme inhibition and synergistic interactions when blended with turmeric (Ajanaku et al., 2022; Trif et al., 2019).
Turmeric-rich oleoresins showed substantially higher carotenoid levels than ginger-rich samples (Table 2). Oleo 2 (100% turmeric) exhibited the highest concentrations of carotenes (CR, 1,809.62 μg/g), xanthophylls (CY, 1,385.48 μg/g), and total carotenoids (CT, 3,195.10 μg/g), followed by Oleo 1 (CT, 2,875.33 μg/g) and Oleo 3 (CT, 2,457.61 μg/g), which also contained high proportions of turmeric. The elevated carotenoid levels in Oleo 1-3 may be attributed to the abundance of curcuminoids and carotenoids, particularly β-carotene and xanthophyll derivatives, which contribute to the intense yellow-orange color and antioxidant capacity of turmeric oleoresins (Madhusankha et al., 2023). Teles et al. (2019) reported carotenoid levels of approximately 3,200 μg/g in turmeric extracts, comparable to the CT value obtained for Oleo 2. The high carotenoid content of turmeric-rich oleoresins supports their suitability as natural colorants and functional ingredients, as carotenoids can act as lipid-phase antioxidants, quenching singlet oxygen and potentially enhancing oxidative stability, while also being associated with provitamin A, immune-modulating, and anti-inflammatory benefits. In contrast, ginger-dominant oleoresins (Oleo 4-7) contained considerably lower total carotenoid levels (1,055.85-1,426.07 μg/g), reflecting the inherently low carotenoid content of ginger rhizomes. Ginger is primarily rich in phenolic compounds such as gingerols and shogaols, rather than carotenoids, which may explain the reduced carotenoid recovery in these samples (Ghafoor et al., 2020; Shaukat et al., 2023). Additionally, ginger pigments are more susceptible to thermal and oxidative degradation during extraction, whereas turmeric carotenoids exhibit greater stability under similar conditions (Ayustaningwarno et al., 2024; Zhang et al., 2021). Notably, turmeric-rich oleoresins not only exhibited greater color intensity, as reflected by higher chroma values (Table 1), but also showed greater antioxidant potential, likely due to carotenoid-mediated radical and singlet oxygen quenching as previously reported (Masyita et al., 2025; Saini et al., 2022). However, owing to the thermolabile nature of carotenoids, their effective application in food systems requires stabilization strategies, such as co-formulation with phenolic antioxidants or encapsulation, to minimize degradation during processing and storage (Arshad et al., 2025; Trif et al., 2019).
The antioxidant activities of ginger, turmeric, and their composite oleoresins (Table 3) differed significantly (p < 0.05) across DPPH, Fe2+ chelation, CUPRAC, and FRAP assays, reflecting differences in phenolic, flavonoid, and carotenoid composition as previously observed in the TPC and TFC results (Table 2). Oleoresins rich in turmeric (Oleo 1-3) consistently exhibited the highest antioxidant activities. DPPH radical-scavenging activity was greatest in Oleo 2 (84.44%), Oleo 1 (83.41%), and Oleo 3 (82.78%), values comparable to that of gallic acid and consistent with their higher TPC and TFC values (Table 2). This confirms that curcuminoids and flavonoid-rich polyphenols in turmeric are the primary contributors to hydrogen-donating and radical-scavenging capacity (Subtain et al., 2023). The values obtained in this study align with the inhibition percentage of 84.87% reported by Ezez and Tefera (2021). Furthermore, Yusufali et al. (2024) evaluated the physicochemical and sensory properties of turmeric-ginger blends and reported high DPPH inhibition (up to 85%) in turmeric-dominant extracts, attributing this to elevated curcumin levels that enhance electron transfer and radical quenching. Ginger-rich samples retained relatively high DPPH activity (68-72%), indicating the additive contribution of ginger phenolics and volatile compounds, although the greatest activity was observed at intermediate turmeric-ginger ratios (Zhou et al., 2022).
Fe2+ chelation activity showed a distinct pattern, with ginger-dominant oleoresins exhibiting stronger metal-binding capacity, particularly Oleo 7 (31.94%). This may be related to the structural flexibility and functional groups of ginger phenolics, which may favor metal coordination. Turmeric oleoresin (Oleo 2) displayed slightly lower chelation activity (26.24%), likely because of the more rigid planar structure of curcuminoids. These differences in chelation activity may reflect the ability of flavonoids and carotenoids to bind pro-oxidant metals (Ballester et al., 2023). The metal-chelating activity observed in this study was comparable to that reported by Tanweer et al. (2020) for ginger leaf extract (29.54%-35.16%), but was higher than that reported for ginger rhizome extract (13.86%-17.98%). Mixed oleoresins showed intermediate values, which may indicate possible competitive or antagonistic interactions between ginger and turmeric chelation sites.
CUPRAC and FRAP results closely followed the trends observed for TPC and TFC (Table 2). Oleo 2 and Oleo 1 exhibited the highest electron-donating and reducing capacities, highlighting the strong redox activity of turmeric curcuminoids associated with extended conjugation and keto-enol tautomerism. Ginger-dominant oleoresins showed comparatively lower reducing power, consistent with their lower phenolic and flavonoid contents. Collectively, the higher TPC and TFC values observed in turmeric-rich oleoresins (Table 2) are consistent with their higher antioxidant activity in DPPH, FRAP, and CUPRAC assays (Table 3), as flavonoids and curcuminoids act as effective hydrogen donors and redox-active compounds (Saini et al., 2022). Moreover, the combined presence of turmeric and ginger phytochemicals suggests complementary and synergistic antioxidant mechanisms, supporting the potential application of blended oleoresins as functional ingredients in antioxidant-enriched food systems (Masyita et al., 2025).
The oxidative stability of RBSO enriched with selected oleoresins (Oleo 1 and Oleo 2) was evaluated at concentrations of 100, 200, and 300 μg/g and compared with the synthetic antioxidant BHT (Table 4). Significant differences (p < 0.05) were observed across all oxidation parameters, indicating concentration-dependent antioxidant activity.
The anisidine values, which reflect the accumulation of secondary lipid oxidation products (mainly aldehydes), decreased significantly with increasing concentrations of both oleoresins (Table 4). At 100 μg/g, Oleo 1 and Oleo 2 had lower anisidine values than the control RBSO, indicating early inhibition of secondary oxidation. At 200 and 300 μg/g, both oleoresins showed markedly stronger inhibition, with values approaching those of BHT. This reduction is consistent with the higher TPC and TFC previously reported for Oleo 1 and Oleo 2, as phenolics and flavonoids are known to act as effective scavengers of alkoxyl and peroxyl radicals involved in secondary oxidation processes (Kaurinovic and Vastag, 2019). A similar reduction was reported by Morsy et al. (2022), who observed strong inhibition of aldehyde formation when refined olive oil was treated with lyophilized sesame coat extract at 600 mg/kg. In another study, ginger extracts exhibited concentration-dependent protection against hydroperoxide decomposition in palm olein, with protection comparable to that of BHT at concentrations of 400-800 ppm (Munyeke et al., 2025).
Conjugated diene values increased with antioxidant concentration, reflecting the formation and stabilization of early oxidation intermediates (Table 4). Oils treated with Oleo 1 and Oleo 2 showed higher conjugated diene values than the control, particularly at 200 and 300 μg/g (Table 4), which is consistent with the mechanism of chain-breaking phenolic antioxidants. This pattern may indicate that the oleoresins delayed the decomposition of hydroperoxides into secondary oxidation products, thereby prolonging the primary oxidation phase. This behavior is typical of phenolic-rich antioxidants and supports earlier findings from DPPH, FRAP, and CUPRAC assays (Table 3), which demonstrated strong radical-scavenging and reducing capacities for turmeric-rich oleoresins. Khan et al. (2023) reported that phenolic antioxidants can delay hydroperoxide decomposition, resulting in prolonged accumulation of primary oxidation intermediates, such as conjugated dienes, in oils rich in polyunsaturated fatty acids, particularly at higher concentrations.
The PVs revealed notable differences among the oleoresins. Oleo 2 consistently showed lower PVs than Oleo 1 at equivalent concentrations, particularly at 200 and 300 μg/g, indicating stronger inhibition of hydroperoxide formation (Table 4). This enhanced protection may be associated with the higher carotenoid content of Oleo 2 (Table 2), as carotenoids function as lipid-phase antioxidants that quench singlet oxygen and intercept lipid peroxyl radicals through their conjugated structures and oxygen-containing functional groups (Liu et al., 2025). In contrast, the higher PV of Oleo 1 at 300 μg/g may reflect pro-oxidant effects at elevated phenolic concentrations, a phenomenon previously reported for highly active polyphenols in lipid systems. This observation aligns with Rudrapal et al. (2023), who reported that polyphenols at high concentrations can initially appear pro-oxidant by rapidly reducing hydroperoxides, generating intermediate radicals. BHT maintained low PVs across concentrations, serving as a benchmark for antioxidant efficiency. The PVs of the oils remained within the maximum acceptable PV (≤ 10 meq O2/kg) according to Codex Alimentarius standards (Codex Alimentarius, 2015), indicating that the oil samples exhibited good oxidative stability under the conditions evaluated. Previous studies have further categorized the oxidation stability of vegetable oils based on the evolution of PV into low oxidation (3-5 meq O2/kg), moderate oxidation (10-12 meq O2/kg), and high oxidation (16-18 meq O2/kg) (Warner and Nelsen, 1996). Except for Oleo 1 at 200 μg/g and 300 μg/g, all oil samples exhibited some degree of oxidation.
The TBARS values, indicative of advanced lipid oxidation, were lowest in samples treated with Oleo 1 at all concentrations, particularly at 200 and 300 μg/g (Table 4). This may indicate effective suppression of lipid breakdown into MDA and related compounds. The strong TBARS inhibition observed for Oleo 1 is consistent with its balanced composition of phenolics, flavonoids, and ginger-derived metal-chelating compounds, which may collectively limit both radical propagation and metal-catalyzed oxidation. Oleo 2 showed slightly higher TBARS values, consistent with its lower Fe2+ chelation capacity observed earlier, highlighting the potential complementary antioxidant roles of ginger and turmeric phytochemicals.
4. Conclusions
Taken together, the oxidative stability results are consistent with the earlier compositional and antioxidant findings. The superior performance of Oleo 2 in reducing peroxide formation aligns with its higher TPC, TFC, carotenoid content, and strong DPPH, FRAP, and CUPRAC activities. Conversely, the effectiveness of Oleo 1 in limiting secondary oxidation (TBARS and p-anisidine values) may be associated with complementary interactions between turmeric curcuminoids and ginger phenolics, particularly their metal-chelating properties, as reflected by its higher Fe2+-chelating activity. These results suggest that antioxidant efficacy in lipid systems depends not only on TPC but also on the balance of radical-scavenging, metal-chelating, and lipid-phase antioxidant mechanisms.
This study demonstrated that ginger and turmeric oleoresins exhibit distinct but complementary antioxidant profiles, which may contribute to enhancing the oxidative stability of RBSO. Among the tested oleoresins, Oleo 2 (turmeric-rich) exhibited greater radical-scavenging and reducing activities, consistent with its high phenolic, flavonoid, and carotenoid contents, and was effective in limiting hydroperoxide formation. Oleo 1 (blended oleoresin) combined the radical-scavenging capacity of turmeric with the metal-chelating properties associated with ginger phenolics, which may contribute to its effectiveness in suppressing secondary oxidation products. These results highlight the potential of both Oleo 1 and Oleo 2 as multifunctional natural antioxidants: Oleo 2 for early-stage lipid protection and color/nutrient enrichment, and Oleo 1 for broader stabilization through complementary antioxidant mechanisms. Future research should focus on optimizing oleoresin blends, improving carotenoid stability, and evaluating functional and sensory performance in diverse food systems, paving the way for clean-label, health-promoting antioxidant ingredients. Long-term storage stability, thermal stability, and fatty acid composition are being evaluated in a related ongoing study to extend these findings to additional edible oils.


