

1. Introduction
The marine environment contains a wide variety of aquatic organisms and is an important source of nutrients and bioactive compounds required for human nutrition (Hamed et al., 2015). Fishery products, including fish, mollusks, and crustaceans, are major sources of n-3 polyunsaturated fatty acids, high-quality proteins, and minerals. They also provide bioactive compounds such as anserine, taurine, and astaxanthin, as well as vitamins A, D, K, and B-complex vitamins, thereby contributing to their nutritional value (Durazzo et al., 2022; Jamioł-Milc et al., 2021). These nutrients are associated with physiological benefits for cardiovascular, metabolic, and neurological health; therefore, fishery products are considered valuable food resources with nutritional and health-promoting potential (Hosomi et al., 2012). Seaweeds have also attracted attention as health-promoting food resources because they are low in fat and rich in vitamins, polyunsaturated fatty acids, and minerals (Peñalver et al., 2020). Seaweeds contain various bioactive compounds and antioxidant constituents, supporting their potential as food ingredients (Ganesan et al., 2019; Kumar et al., 2021). Owing to these nutritional and functional properties, the use of seaweed as a food ingredient has increased, and its value as a sustainable food resource in the food industry has been increasingly recognized (Leandro et al., 2020). In addition, seaweeds contain diverse bioactive compounds, such as fucoidans and phlorotannins, which further support their value as food resources (Gupta and Abu-Ghannam, 2011). According to the National Food and Nutrition Statistics (KHIDI, 2023), the average daily intakes of seaweeds and fishery products in Korea were 25.19 g and 88.15 g, respectively, in 2020, but decreased to 3.60 g and 41.81 g, respectively, in 2023, corresponding to reductions of approximately 85.7% and 52.6%. The substantial decline in fishery product consumption highlights the need to reevaluate the nutritional value of these foods and establish reliable baseline data on their nutrient composition.
B-complex vitamins comprise eight water-soluble vitamins that function as coenzymes in various metabolic processes, including cellular energy production and biosynthesis. These vitamins participate in diverse enzymatic reactions and play important roles in the maintenance of normal physiological functions and metabolic homeostasis (Hanna et al., 2022; Kennedy, 2016). As B-complex vitamins are not synthesized in sufficient amounts in the body, continuous dietary intake is required (Lee et al., 2023). Among these, pantothenic acid (vitamin B5) participates in various biochemical pathways, including fatty acid, amino acid, and carbohydrate metabolism (Czumaj et al., 2020; Depeint et al., 2006; Liang et al., 2021). Although pantothenic acid deficiency is relatively rare, insufficient intake may induce hepatic fat accumulation and metabolic disorders and has been associated with growth retardation, weight loss, dermatitis, dyslipidemia, and neurological abnormalities (Shichkin, 2025; Wang et al., 2024). Biotin (vitamin B7) serves as a cofactor for several carboxylases and plays an essential role in the metabolism of glucose, amino acids, and fatty acids (Agrawal et al., 2016; Depeint et al., 2006). Biotin deficiency is uncommon in healthy adults but may occur under certain metabolic conditions or following the use of certain drugs. Biotin deficiency can lead to metabolic abnormalities, dermatitis, and hair loss, and severe cases can be accompanied by neurological symptoms (Avery, 2019; Zempleni et al., 2009). Although pantothenic acid and biotin are essential vitamins for maintaining normal human metabolism, systematic information on their concentrations in fishery foods distributed in Korea remains limited. While the Korean Food Composition Table provides nutrient data for a wide range of foods, the pantothenic acid and biotin contents of diverse fishery products available in Korea have not been sufficiently characterized. In particular, information on differences in the contents of these vitamins among raw, cooked, and processed seaweed products remains limited. Hagan and Anyangwe (2023) reported that the vitamin content of seaweeds is strongly affected by species, season, and habitat conditions. These variations highlight the need for systematic quantitative analyses of diverse fishery products to establish reliable nutrient composition data. Accordingly, this study aimed to validate an analytical method and determine the pantothenic acid and biotin contents of fish, shellfish, seaweed, and processed seafood products distributed in Korea.
2. Materials and methods
The fishery food samples used in this study were provided between 2023 and 2025 by the Rural Development Administration (RDA). The samples included fish and shellfish products, seaweed, and processed seafood products. They were classified according to the food type, processing status, and cooking treatment before analysis. A total of 59 samples were analyzed, including 27 fish and shellfish samples and 32 seaweed samples. The designations “area 1,” “area 2,” and “area 3” indicate different collection areas designated by RDA. For processed and commercial products, designations A, B, and C were used to distinguish different products within the same product category. Each sample was analyzed separately without pooling with other samples. A Standard Reference Material (SRM), SRM 3252, used for analytical quality control was obtained from the National Institute of Standards and Technology (NIST, Gaithersburg, MD, USA). A commercial infant formula (Imperial Dream XO, Namyang Co., Seoul, Korea) was used as an in-house quality control (IHQC) sample. All other solvents and reagents were of analytical grade.
For pantothenic acid analysis, the extraction solution was prepared by dissolving 2.7 g of potassium phosphate monobasic (KH2PO4) in tertiary-distilled water. The pH was adjusted to 2.1 using phosphoric acid, and the final volume was adjusted to 1 L. The mobile phase, KH2PO4:acetonitrile (ACN) = 95:5 (v/v), was prepared by dissolving 6.7 g of potassium phosphate monobasic in tertiary-distilled water. The pH was adjusted to 3.5 using phosphoric acid, and the final volume was adjusted to 1 L. The resulting potassium phosphate concentration was approximately 50 mM. The extraction solution and mobile phase were filtered under reduced pressure before high-performance liquid chromatography (HPLC) analysis.
For biotin analysis, the extraction solution was prepared by dissolving 10.38 g of sodium phosphate monobasic and 9.007 g of sodium phosphate dibasic in tertiary-distilled water. The pH was adjusted to 7.0 using 2 M sodium hydroxide, prepared by dissolving 40 g of sodium hydroxide in tertiary-distilled water and adjusting the final volume to 500 mL, and the final volume of the extraction solution was adjusted to 1 L. The resulting sodium phosphate concentration was approximately 0.15 M. The mobile phase was prepared as 0.1% phosphoric acid by dissolving 1.2 mL of 85% phosphoric acid in 1 L of tertiary-distilled water, followed by filtration under reduced pressure.
For pantothenic acid analysis, homogenized samples were weighed into 50 mL conical tubes. The sample mass was 1-3 g for fish, shellfish, and their products and 0.5-3 g for seaweeds. The sample mass was adjusted according to the sample type, physical form, characteristics, and pantothenic acid content reported for comparable food items in the RDA food composition data. For the first extraction, 20 mL of 20 mM KH2PO4 extraction solution (pH 2.1) was added to each sample, followed by sonication at 40°C for 20 min. The extract was centrifuged at 2,862 ×g for 10 min at room temperature, and the supernatant was collected using Whatman No. 2 filter paper (ADVANTEC, Toyo Roshi Kaisha, Ltd., Tokyo, Japan). The remaining residue was re-extracted with 20 mL of 20 mM KH2PO4 extraction solution (pH 2.1), followed by sonication at 40°C for 20 min. The second extract was centrifuged at 2,862 ×g for 10 min at room temperature, and the supernatant was collected using Whatman No. 2 filter paper. The filtrates obtained from the first and second extraction steps were combined and thoroughly mixed. A total of 40 mL of the extraction solution was used for each sample, with 20 mL used for each extraction step. No additional dilutions or volume adjustments were performed before the HPLC analysis. The combined extract was filtered through a 0.2-μm syringe filter and transferred to an HPLC vial for analysis.
For biotin analysis, homogenized samples were weighed into 50 mL conical tubes. The sample mass ranged from 1 to 3 g for fish, shellfish, and their products and from 0.2 to 3 g for seaweeds. For certain seaweed samples that exhibited restricted flow through the immunoaffinity column, the sample mass was reduced to as low as 0.2 g. The immunoaffinity column cleanup procedure was based on the method reported by Joseph et al. (2016), with some modifications. For extraction, 25 mL of 0.15 M phosphate buffer was added to each sample, and the sample was extracted in an autoclave at 121°C for 25 min. After cooling to room temperature, an additional 25 mL of 0.15 M phosphate buffer was added, resulting in a total volume of 50 mL. The extract was centrifuged at 2,862 ×g for 10 min at room temperature and filtered through Whatman No. 2 filter paper. The immunoaffinity column was equilibrated at room temperature for 30 min, after which the storage buffer inside the column was completely removed. The column was then washed with 5 mL of phosphate-buffered saline (PBS) before sample loading. A 10-mL aliquot of the clear extract was loaded onto an immunoaffinity column. The column was washed with 5 mL PBS, followed by 5 mL of tertiary-distilled water, and the residual liquid was completely removed from the column. Biotin was eluted with 4 mL of HPLC-grade methanol. The methanol eluate was concentrated at 70°C under a stream of nitrogen. The residue was reconstituted in 0.5 mL of tertiary-distilled water and transferred to an HPLC vial for analysis.
Quantitative analyses of pantothenic acid and biotin were performed using an HPLC system (Chromaster 5000 series, Hitachi, Tokyo, Japan). Pantothenic acid was analyzed using a YMC-Pack ODS-AM column (250 × 4.6 mm, 5 μm, YMC Co., Ltd., Kyoto, Japan), whereas biotin was analyzed using a Kinetex Phenyl-Hexyl column (150 × 4.6 mm, 2.6 μm, Phenomenex Inc., Torrance, CA, USA). Both analytes were detected using a UV detector. The HPLC conditions are listed in Table 1.
Pantothenic acid content was determined according to the Food Code of the Ministry of Food and Drug Safety (MFDS, 2024). For quantitative analysis, calcium pantothenate standard solutions were prepared at eight concentration levels ranging from 0.039 to 5 μg/mL. Standard solutions were analyzed using HPLC, and a calibration curve was constructed. The peak area of each sample solution was substituted into the calibration equation to calculate the pantothenic acid concentration in the test solution. The pantothenic acid content was calculated using the following equation, considering the sample weight and dilution factor:
where S is the pantothenic acid concentration in the test solution (μg/mL), a is the total volume of the test solution (mL), and b is the dilution factor. The values 219.23 and 238.27 represent the molecular weights of pantothenic acid and calcium pantothenate, respectively.
For biotin analysis, a stock standard solution of biotin was prepared at 9.6 μg/mL by dissolving the biotin standard in tertiary-distilled water. The stock solution was serially diluted with tertiary-distilled water to prepare eight standard solutions in the concentration range of 0.015-0.960 μg/mL. Each standard solution was analyzed by HPLC, and a calibration curve was constructed. The peak area of each sample solution was substituted into the calibration equation to determine the biotin concentration in the test solution. The biotin content was calculated based on the method reported by Joseph et al. (2016), with modifications, using the following equation:
where S is the biotin concentration in the test solution (μg/mL), a is the total extraction volume (50 mL), and b is the concentration factor (20), calculated as the ratio of the volume before and after concentration (10 mL/0.5 mL).
To ensure the reliability of the analytical methods used in this study, method validation was performed according to the AOAC Guidelines for Single-Laboratory Validation of Chemical Methods for Dietary Supplements and Botanicals (AOAC, 2002). The validation parameters included linearity, sensitivity, selectivity, accuracy, and precision. Linearity was evaluated using calibration curves constructed from the peak areas of standard solutions at different concentrations and expressed as the coefficient of determination (R2). The limits of detection (LOD) and quantification (LOQ) were determined at signal-to-noise ratios (S/N) of 3 and 10, respectively. Selectivity was evaluated by comparing the chromatograms of the standard solutions and SRM 3252 to confirm the separation of the target peaks. Accuracy was assessed by analyzing SRM 3252 and calculating the recovery (%) based on the certified and measured values. Precision was evaluated using the IHQC sample through repeated analyses and was expressed as repeatability and reproducibility. The observed precision results were compared with the expected precision criteria described by AOAC (2002). The recovery results were evaluated according to the expected recovery ranges specified by AOAC (2016).
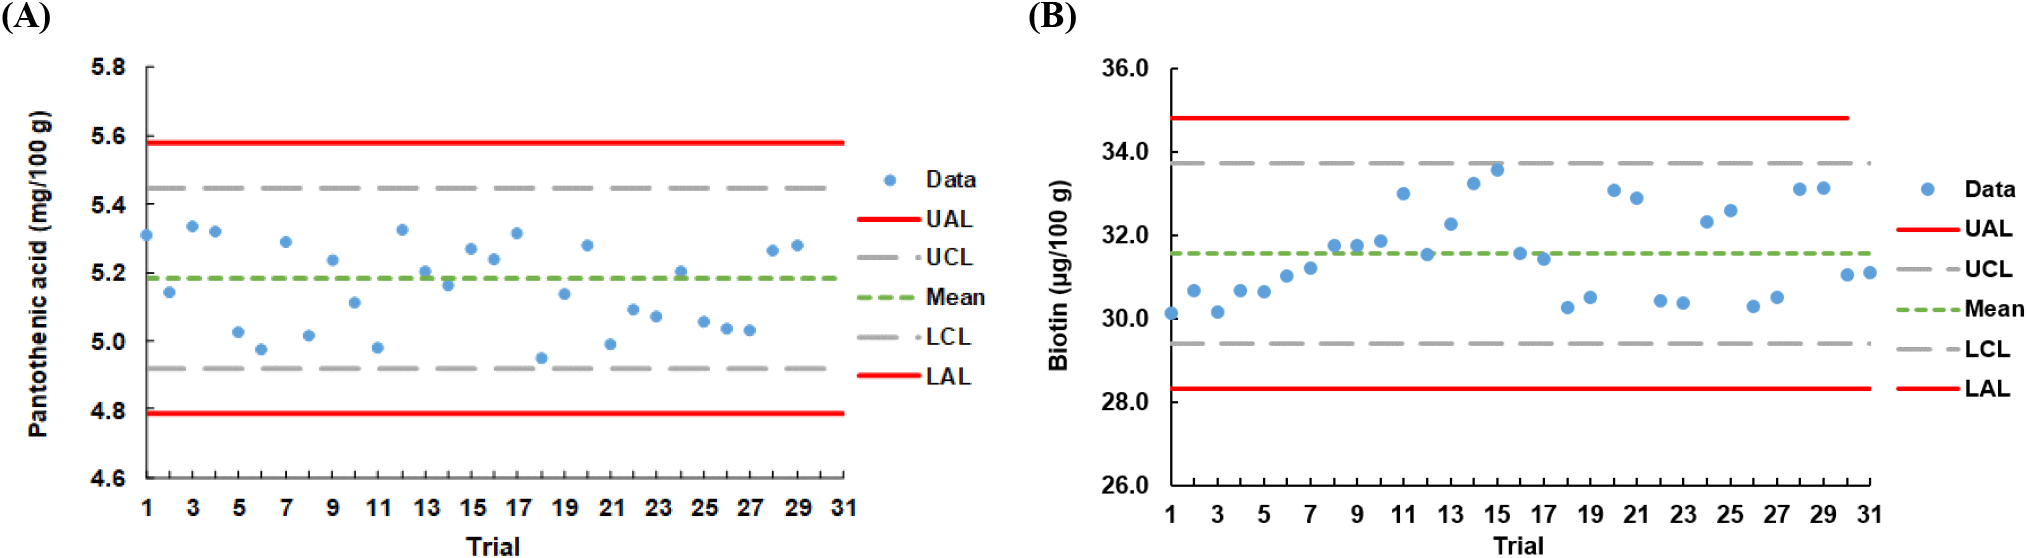
IHQC was performed to monitor the accuracy and stability of the analytical procedures continuously. A commercial infant formula was used as the IHQC sample. To prepare the quality control (QC) chart, the infant formula was independently extracted and analyzed more than 10 times. The mean and SD were calculated for each analyte. Based on these values, the mean ± 2 × SD and mean ± 3 × SD were set as the upper and lower control lines (UCL and LCL) and the upper and lower action lines (UAL and LAL), respectively. During sample analysis, the IHQC sample was analyzed together with all test samples, and the results were recorded on a QC chart to monitor analytical quality. The control and action limits are defined as follows:
All analytical results for pantothenic acid and biotin were obtained in triplicate and expressed as the mean ± SD. The statistical analyses were performed using the Statistical Analysis System (SAS) version 9.4 (SAS Institute Inc., Cary, NC, USA). Significant differences in vitamin content among the samples were evaluated using one-way analysis of variance. Differences among treatment means were determined using Duncan’s multiple range test at a significance probability of p < 0.05.
3. Results and discussion
In this study, linearity, sensitivity, selectivity, accuracy, and precision were evaluated to validate the analytical methods for pantothenic acid and biotin. Linearity was assessed by constructing calibration curves using the concentrations of the standard solutions and the corresponding peak areas obtained by HPLC and was expressed as R2 (Table 2). The calibration curves for pantothenic acid and biotin were y = 54.86397413x - 3,777.20217 and y = 801,727.2933x + 1355.0689, respectively. The R2 values were 0.9996 and 1.0000, indicating excellent linearity. The LOD and LOQ values used to evaluate analytical sensitivity were 0.036 μg/mL and 0.101 μg/mL, respectively, for pantothenic acid and 0.007 μg/mL and 0.017 μg/mL, respectively, for biotin (Table 2). In the study by Vyas et al. (2025), the reported LOD and LOQ values for pantothenic acid were 0.938 and 2.843 ppm, respectively, whereas those for biotin were 1.25 and 3.79 ppm, respectively. Compared with these values, the LOD and LOQ values obtained in the present study were lower, suggesting that the analytical method provided sufficient sensitivity for the quantification of pantothenic acid and biotin in the tested samples.
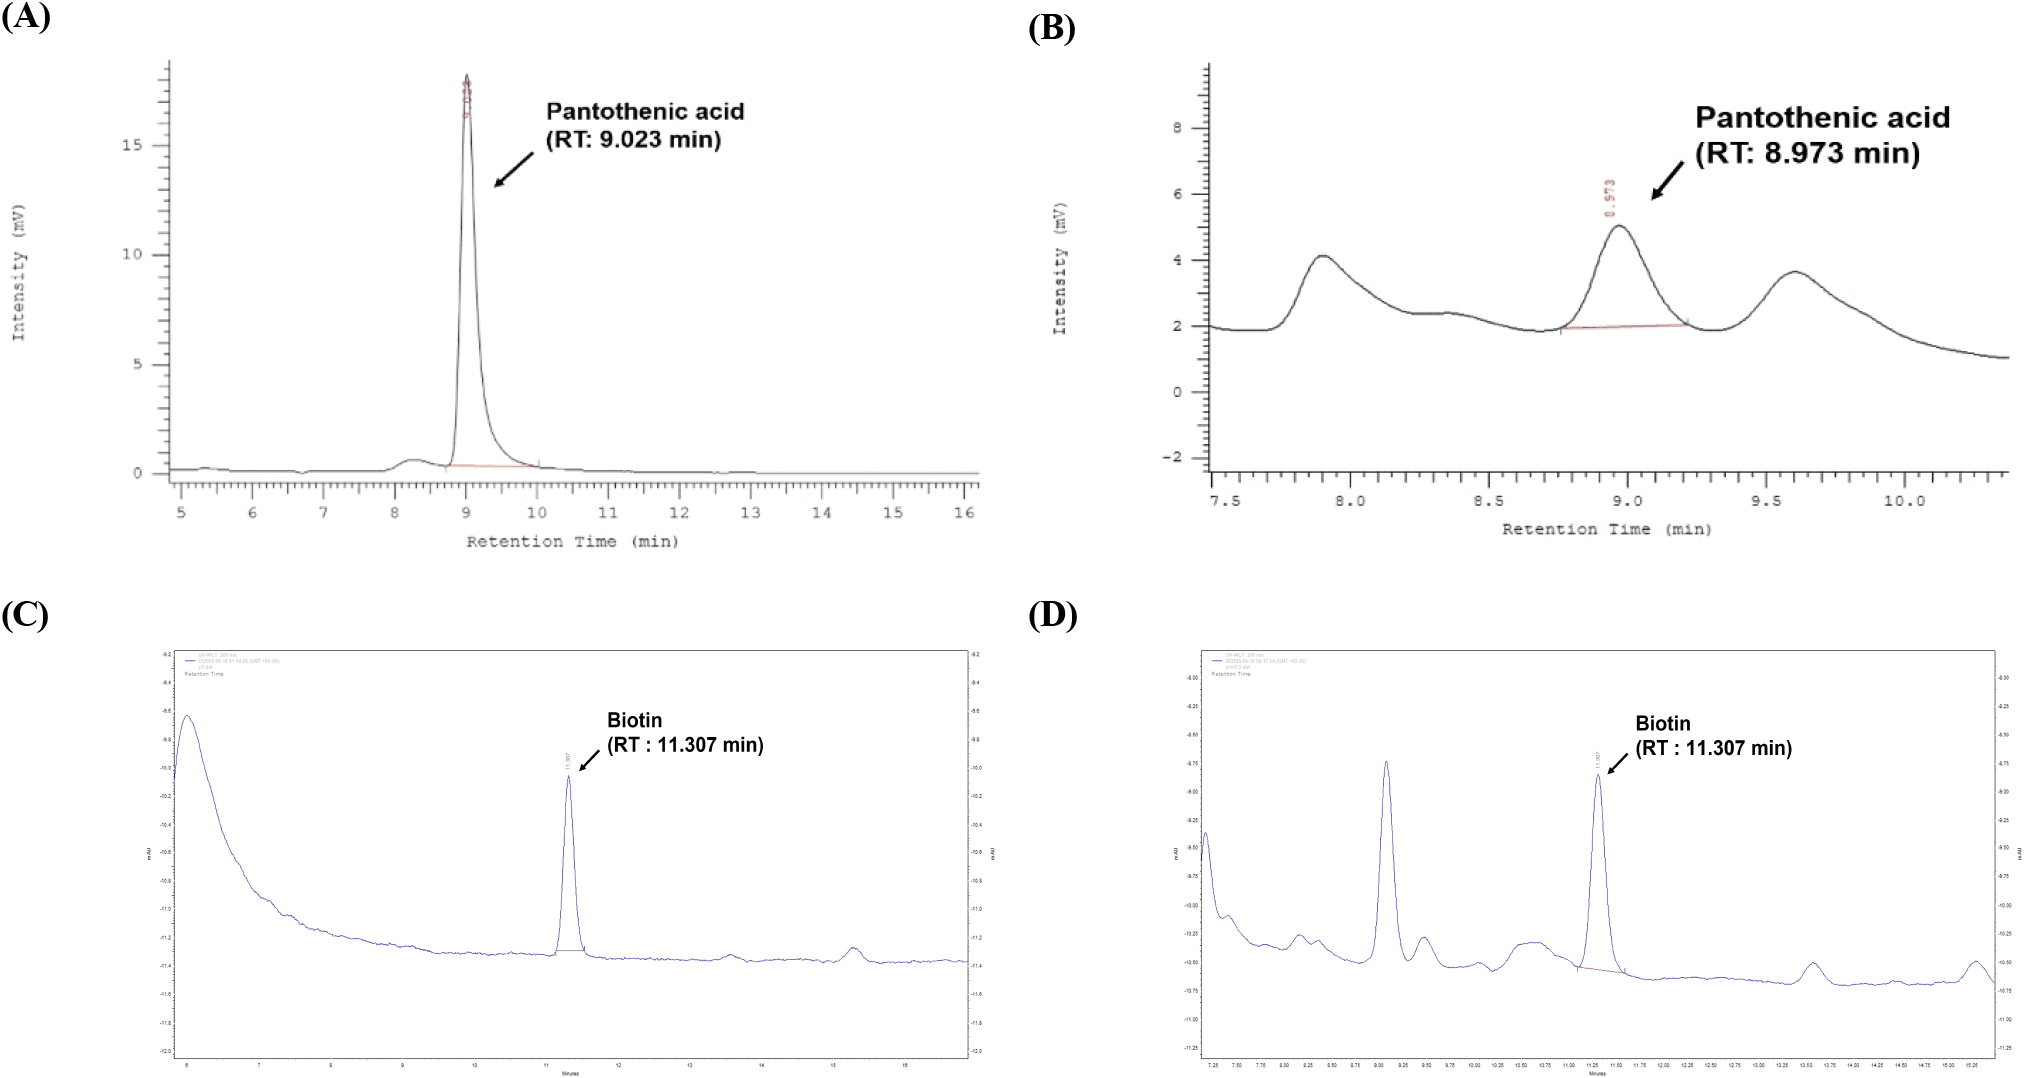
To evaluate selectivity, chromatograms of the pantothenic acid and biotin standard solutions were compared with those of SRM 3252 sample (Fig. 1). Both analytes were detected as single peaks at retention times corresponding to those observed for the SRM 3252, confirming separation without apparent interference from other compounds. These results indicate that the analytical method used in this study provided good selectivity for the target compounds. Accuracy was evaluated using SRM 3252 (Protein Drink Mix, Table 3). For pantothenic acid, the certified value was 150 ± 12 mg/kg, and the measured value was 153.96 ± 0.96 mg/kg, corresponding to a recovery of 102.64%. For biotin, the certified value was 443 ± 19 μg/100 g, and the measured value was 434.22 ± 4.01 μg/100 g, corresponding to a recovery of 98.02%. Both analytes satisfied the expected recovery ranges specified by the AOAC (2016), confirming the accuracy of the analytical methods.
Precision was evaluated in terms of repeatability and reproducibility using a commercial infant formula as the IHQC sample. The relative standard deviations (RSDs) for repeatability and reproducibility were 1.396% and 0.638%, respectively, for pantothenic acid and 1.819% and 3.799%, respectively, for biotin (Table 4). The observed repeatability RSDs were lower than the expected values based on the analyte concentration specified in AOAC (2002), indicating good precision of the analytical methods. Additionally, a QC chart was prepared using the IHQC sample to ensure the continued reliability of the analytical procedures. All the analytical values were within the UCL, LCL, UAL, and LAL ranges (Fig. 2). These results indicate that the analytical methods used in this study showed acceptable performance for the quantification of pantothenic acid and biotin in the tested samples.
The pantothenic acid and biotin contents of fish, shellfish, and their products are shown in Table 5. Pantothenic acid was not detected in some samples; however, its content ranged from 0.0581 to 0.8091 mg/100 g wet weight (ww). The highest pantothenic acid content was observed in fish paste sausage with cheese, at 0.8091 mg/100 g ww. Among the anchovy samples, medium-sized raw anchovies from area 3 showed the highest pantothenic acid content, at 0.5670 mg/100 g ww. In contrast, small raw anchovies from area 1 showed the lowest content, of 0.3854 mg/100 g ww, and pantothenic acid was not detected in large raw anchovies from area 1 or in large anchovy broth. Biotin was detected in all samples, with the highest content observed in abalone rice porridge at 9.2505 μg/100 g ww. Among the anchovy samples, small raw anchovies from area 2 showed the highest biotin content, at 3.9901 μg/100 g ww, whereas large anchovy broth showed the lowest content, at 0.1953 μg/100 g ww. Fish sauce and fish paste sausages also contained relatively high levels of biotin, with values of 2.5257 μg/100 g ww and 1.8795-2.1550 μg/100 g ww, respectively. Overall, pantothenic acid was either not detected in some samples or was present at relatively low levels, whereas biotin was detected in all samples. In the anchovy samples, the biotin content differed according to size and collection area, even within the same species. Small anchovy samples tended to have a relatively high biotin content. These differences may be related to sample size, collection area, habitat conditions, and biological characteristics. Herawati et al. (2018) reported that the nutritional composition of fish is affected by environmental and biological factors and may vary depending on biological characteristics such as species, age, and sex. The processing conditions during cooking and food manufacturing are also known to affect the content of water-soluble vitamins. Pantothenic acid and biotin are known to be stable under near-neutral conditions at approximately pH 7, and biotin, in particular, is regarded as relatively stable under heat treatment. However, because both vitamins are water soluble, they may leach into the cooking water when water contact increases during cooking (Reddy and Love, 1999). Hrubša et al. (2022) reported that pantothenic acid content decreases by 15-50% in meat during moist-heat cooking, such as boiling, and that the pantothenic acid content in fish also decreases depending on the cooking method. In addition, Uran and Gokoglu (2014) applied various cooking methods to anchovies and reported that changes in nutritional composition varied according to the cooking method, indicating that cooking affects the nutritional quality of foods. Similarly, Miglio et al. (2008) explained that cooking influences the nutritional and physicochemical characteristics of foods and that changes in nutrient composition may differ depending on the cooking method and food type. Differences in pantothenic acid and biotin contents have also been observed in processed products, such as tuna fish sauce, canned chili tuna, and abalone rice porridge. Măzărel et al. (2025) reported that the nutritional composition of foods can be affected by the type and proportion of raw materials, the manufacturing process, and cooking method, and that the retention of water-soluble vitamins may vary depending on heating and processing conditions. Therefore, the differences in pantothenic acid and biotin contents observed in this study may reflect the combined effects of raw material characteristics, ingredient formulation, and cooking or processing conditions.
The pantothenic acid and biotin contents of seaweeds are listed in Table 6. Pantothenic acid was detected in dried, soaked, blanched, and fried brown kelp products, with values ranging from 0.0339 to 1.3323 mg/100 g ww. In seaweed fulvescens and sea lettuce, pantothenic acid was detected only in the raw samples from area 1, at 0.1051 mg/100 g ww and 0.1134 mg/100 g ww, respectively, but was not detected in the blanched samples. In the case of sea mustard, pantothenic acid was not detected in dried sea mustard samples; however, it was detected in sea mustard bu-gak and sea mustard twi-gak at 0.3053 mg/100 g ww and 0.0603-0.5320 mg/100 g ww, respectively. In contrast, pantothenic acid was not detected in the dried sea mustard samples or in the raw and blanched hijiki samples. Overall, the pantothenic acid content of the seaweeds varied considerably depending on the sample type and processing conditions. Biotin was detected in most seaweed samples, with the highest content found in raw sea lettuce from area 1, at 9.3512 μg/100 g ww. This was followed by dried sea mustard from area 1 and dried sea mustard from a commercial brand, with contents of 5.3267 μg/100 g ww and 3.4891 μg/100 g ww, respectively. On the other hand, the lowest biotin content was observed in blanched seaweed fulvescens from area 1, at 0.3209 μg/100 g ww. Differences in biotin content were observed among seaweed samples
subjected to soaking, boiling, and blanching. In particular, lower biotin content was observed in blanched sea lettuce than in the corresponding raw sample. Biotin was not detected in sea mustard twi-gak B or brown kelp twi-gak A and C, whereas sea mustard twi-gak A and brown kelp twi-gak B contained 0.5650 μg/100 g ww and 1.0853 μg/100 g ww, respectively. In addition, laver bu-gak and brown kelp bu-gak contained 2.4185 μg/100 g ww and 1.0849 μg/100 g ww of biotin, respectively. These results suggest that the presence and content of biotin may differ depending on the product, even among processed products prepared from the same raw seaweed material. Padonou et al. (2023) reported that water-soluble B vitamins may leach into cooking water or be lost via evaporation during soaking and thermal processing and that vitamin loss tends to increase with increasing heating time and processing temperature. Duan et al. (2018) found that the contents of water-soluble vitamins, including vitamin B1, vitamin B2, niacin, and folic acid, changed significantly depending on the cooking method when mackerel was cooked by baking or frying. In addition, Panayotova et al. (2026) suggested that changes in nutrient composition may differ according to the cooking method and heating conditions, even within the same fishery product. Yang et al. (2023) reported that different heat treatments applied to kelp resulted in differences in the retention of bioactive compounds and quality characteristics depending on the cooking method. These previous findings provide context for the variation in pantothenic acid and biotin contents observed among the processed seaweed samples in the present study. Because bu-gak and twi-gak products differ in ingredient composition and manufacturing processes, the observed vitamin contents of these products are interpreted as product-specific observations rather than direct estimates of processing-induced losses. Holdt and Kraan (2011) reported that the nutrient content of seaweeds, including vitamins, varies depending on the season, production area, and environmental conditions. Rickman et al. (2007) suggested that the nutrient retention and content in the same food may differ according to the cultivar, production area, maturity, and processing conditions. In the present study, differences in pantothenic acid and biotin contents were observed among samples within the same seaweed group and among processed products made from the same raw material. These differences may be associated with the production environment, raw material characteristics, ingredient formulations, and manufacturing processes. Twi-gak products are prepared from seaweeds, glutinous rice paste, edible oil, and seasonings and undergo drying and frying processes. Therefore, differences in the manufacturing processes and formulations may have contributed to the variation in nutrient content among the products.
4. Conclusions
This study validated an HPLC method for the determination of pantothenic acid and biotin and investigated their contents in fish, shellfish, seaweed, and processed seafood products distributed in Korea. The method showed acceptable linearity, accuracy, and precision, indicating its suitability for the quantitative analysis of both vitamins in the tested samples. The pantothenic acid and biotin contents varied considerably depending on the food type, processing status, and cooking treatment. Differences in the measured vitamin content were observed among seaweed samples subjected to soaking, blanching, or boiling, as well as among processed products prepared from similar raw materials. Therefore, these results are presented as product-specific observations, as variations in the measured vitamin content may reflect differences in sample characteristics, processing conditions, and moisture content. These findings provide baseline data for expanding national food composition databases and evaluating the nutrient composition of fishery foods distributed in Korea.


