
1. Introduction
Spices are natural ingredients that have been used since ancient times to enhance the flavor and aroma of foods. A wide variety of cuisines rely on spices and spices are valued for their flavor-enhancing properties as well as their potential health-promoting, antimicrobial, antioxidant, and anticancer activities (Baky et al., 2024; Wang et al., 2023). Furthermore, culinary herbs (e.g., onion, garlic, coriander) have influenced the eating habits of many people, and are known to facilitate exchanges between different cultures (Kaefer and Milner, 2008). Food culture is influenced by climatic and environmental conditions, dietary habits, and social interactions. These factors are closely related and contribute to the development of distinct food cultures among countries and regions (Nam et al., 2010). Specifically, East Asia occupies an important position in the global spice trade due to its geographical and economic advantages (Wang et al., 2023).
Korean perilla (Perilla frutescens), commonly referred to as perilla, is an annual herb in the Lamiaceae family (Ha et al., 2012; Jun et al., 2014). The leaves are particularly popular in Korea, where they are consumed either fresh or in pickled form. Owing to their distinctive aroma and refreshing taste, they are consumed with a variety of foods, including meat, rice, and flour, and are used as a flavoring agent in sweets, sauces, and condiments (Seo and Baek, 2009). In addition to being consumed as a food, perilla leaves are also attracting interest in their potential health-promoting properties, including immunomodulatory and antioxidant activities (Jun et al., 2014; Yang et al., 2012). In China, coriander (Coriandrum sativum) is extensively consumed; the plant is widely cultivated locally and throughout Asia, which is the main source of its production worldwide (Laribi et al., 2015). Coriander is an annual leafy vegetable belonging to the Apiaceae family. The flavor of coriander is perceived as spicy, bitter, or pungent by different individuals, while others who strongly dislike coriander have described it as having an unpleasant soap-like aroma (Eriksson et al., 2012; Mauer and El-Sohemy, 2012). The plant is consumed for its health benefits in some parts of China (Song et al., 2020; Yang et al., 2012). It is rich in vitamin C and dietary fiber, which contribute to its health benefits, including improving appetite and insomnia. It has been reported to possess antioxidant and antimicrobial properties (Beyzi et al., 2017; Kaufmann et al., 2022). Shiso (P. frutescens var. crispa) is a popular culinary herb in Japanese cuisine and is frequently consumed both as a pickled and fresh leafy vegetable (Cho et al., 2024; Nam et al., 2019). The stems, leaves, and fruit are extensively used to treat allergic diseases, bronchial diseases, indigestion, and insomnia (Kimura and Taniguchi, 2021; Wang and Lee, 2016).
Flavor is an important factor influencing food choice (Biswas and Szocs, 2019), and people’s perception of different volatile compounds in culinary herbs may contribute to variations in their perceived aroma characteristics (Dongmo et al., 2024). Differences in volatile composition may also contribute to the unique volatile compounds contained in culinary herbs. Therefore, comparative analysis of culinary herbs commonly consumed in Korea, China, and Japan may provide insights into their distinctive aroma-related chemical characteristics. However, the volatile compounds of Korean perilla leaves, coriander, and shiso, three favorite spice vegetables in Korea, China, and Japan, respectively, have not been directly compared (Mauer and El-Sohemy, 2012; Spence, 2023). Therefore, it is necessary to identify the main volatile compounds that characterize the aroma profiles of these culinary herbs.
Various extraction methods have been used for proper sample treatment prior to the collection of the volatile compounds in spices, including simultaneous steam distillation (SDE) (Liu et al., 2017), solvent extraction (SE) (Wu et al., 2024), microwave-assisted extraction (MAE) (Hiranvarachat et al., 2015), supercritical carbon dioxide extraction (SCE) (Dima et al., 2016), and solid-phase microextraction (SPME) (Wei et al., 2022). The SPME technique is widely used for the analysis of volatile compounds due to its high sensitivity, operational simplicity, and high reproducibility (Zhao and Eun, 2021). Unlike other extraction methods, it is eco-friendly as it does not require solvents and has a shorter processing time because it does not require a pretreatment (Abdulra’uf and Tan, 2015; Baky et al., 2024; Zhao and Eun, 2021). The effectiveness of SPME can be realized by optimizing variables such as SPME fiber type, sample weight, adsorption time, and salt amount (Acquaticci et al., 2024). In addition to the SPME, a multivariate statistical approach known as full factorial design (FFD) is a useful analytical method for identifying key factors and optimizing the behavior of complex systems by clearly revealing interactions between factors (Triaux et al., 2019). The identified main factors can be optimized by applying the Box-Behnken design (BBD) of response surface methodology (RSM) to derive optimal conditions (Koonani and Ghiasvand, 2024; Li et al., 2024), which can effectively set up the optimal experimental conditions for SPME.
In this study, we aimed to analyze the volatile compounds in Korean perilla, coriander, and shiso leaves to compare their volatile profiles and characterize differences in their aroma-related chemical composition. First, the three main factors were selected by FFD, and the optimal experimental conditions were derived using BBD. Second, based on the optimal experimental conditions, volatile compounds in the Korean perilla, coriander, and shiso leaves were analyzed qualitatively and semi-quantitatively using headspace solid-phase microextraction-gas chromatography-mass spectrometry (HS-SPME-GC-MS). Finally, multivariate statistical analyses were performed to confirm the main components and similarities of each spice vegetable.
2. Materials and methods
Sodium chloride and alkane standard mixture (C10-C40) used for retention index (RI) calculation were purchased from Sigma-Aldrich (St. Louis, MO, USA). Hexadecane was purchased from Sigma-Aldrich and used as an internal standard (IS). SPME fibers (75 μm CAR/PDMS, 65 μm PDMS/DVB, and 50/30 μm DVB/CAR/PDMS) were purchased from Sigma-Aldrich. Other chemicals used in this study were of analytical grade.
Korean perilla, coriander, and shiso leaves used in this study were cultivated in various regions of South Korea from September to October 2024 under controlled conditions of 25 ± 2°C and a 12-h light cycle. This study analyzed only samples cultivated in Korea due to limited sample availability, which limits the scope of interpretation. Each selected sample was categorized into one of four groups according to the place of cultivation, and all were purchased from easily accessible retailers. Each sample was washed after removing the roots and stems and dried in a forced-air oven (Daihan Scientific, Wonju, Korea) until the moisture content was less than 10%. The dried samples were ground and passed through a 500-μm mesh sieve (Chunggyesanggongsa, Gunpo, Korea). The resulting powders were stored at −20°C until analysis. Information on the varieties and cultivars of each selected sample is provided in Table 1.
The dried powdered sample was placed in a 22-mL headspace glass vial (Supelco Inc., Bellefonte, PA, USA), followed by the addition of 10 mL of distilled water, a constant amount of NaCl (0-1 g), and 50 μL of hexadecane (0.773 g/mL) as an IS. The vial was sealed with a silicone/Teflon septum (Supelco Inc.). The sealed vial was equilibrated at 60°C, with agitation at 350 rpm for 30 min after reaching the set temperature; then a conditioned SPME fiber was inserted to adsorb the volatile compounds in the spice. The SPME fiber was then introduced into the GC-MS injection port and thermally desorbed at 300°C for 6 min prior to GC-MS analysis.
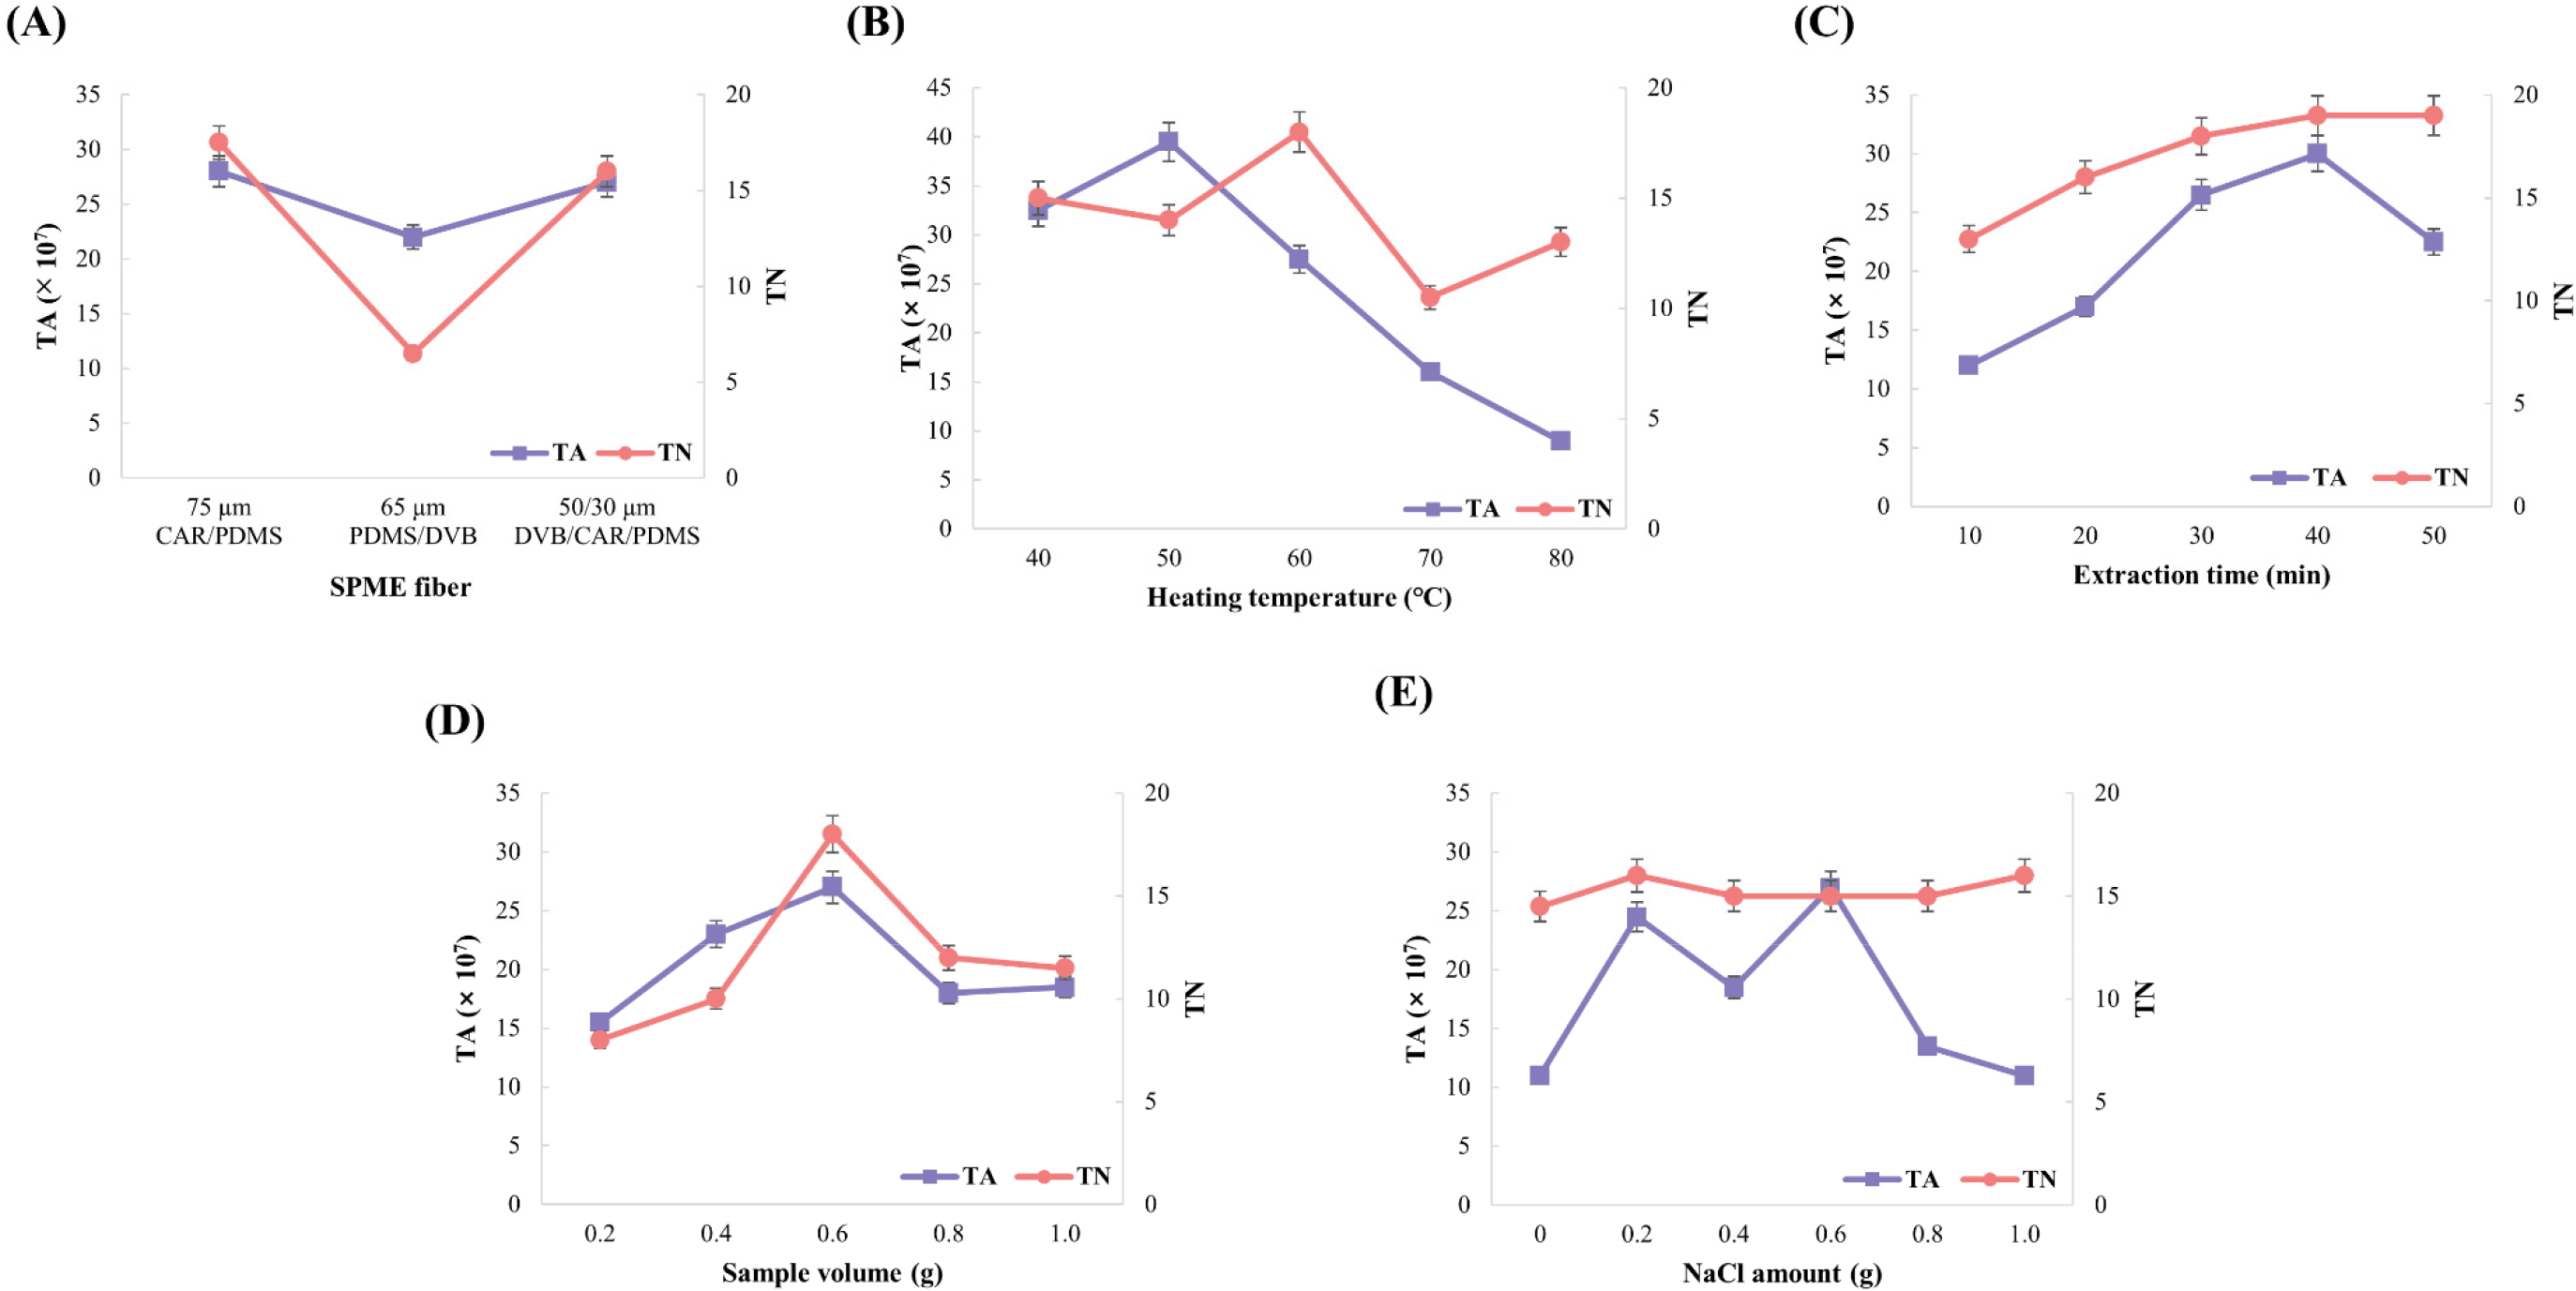
Before performing FFD, the effects of five factors (SPME fiber type, drying temperature, sample weight, adsorption time, and NaCl amount) on the total number (TN) and total area (TA) were analyzed according to the HS-SPME procedure. The experiment was a single-factor test to determine the optimal range of each factor, and the factors and levels are presented in Table 2.
Four factors, except SPME fiber, were subjected to FFD. According to the FFD, samples were repeated three times at each level and an additional five times at the center point for a total of 53 replicates, with each factor coded as high (+1), low (−1), and randomized. The factors and levels of the FFD are shown in Table 3. Based on the FFD analysis, we selected three major contributors to HS-SPME efficiency among the four factors.
| Optimization | −1 | Center point | +1 |
|---|---|---|---|
| Drying temperature (°C) | 40 | 60 | 80 |
| Adsorption time (min) | 10 | 30 | 50 |
| Sample weight (g) | 0.2 | 0.6 | 1.0 |
| NaCl amount (g) | 0.2 | 0.6 | 1.0 |
In BBD, each of the three main factors (drying temperature, adsorption time, and sample weight) identified from the FFD results were coded at three levels (−1, 0, and +1) to derive the optimal conditions for the reaction (Anoraga et al., 2024). The NaCl amount evaluated in the FFD step was not included in the BBD model. Overall, 15 BBD runs were performed (Table S1). The dependent variables were TN and TA, which were measured in triplicate for each sample. Each extraction and GC-MS analysis was performed in triplicate under identical conditions within 24 h to ensure reproducibility. In the Box-Behnken design, three replicates were conducted at the central point to verify statistical consistency. The coefficient of variation (CV) among replicates was maintained below 5%, confirming analytical reproducibility.
Each volatile component obtained by employing SPME was analyzed by applying GC-MS (PerkinElmer Clarus 680 Gas Chromatograph/Clarus 600T Mass Selective Detector, PerkinElmer, Waltham, MA, USA). An Elite-5MS column (60 m × 0.25 mm × 1 μm film thickness; PerkinElmer) was used for chromatographic separation. Helium (99.99%) was used as the carrier gas, with a consistent flow rate of 1.0 mL/min. The oven temperature was initially maintained at 40°C for 5 min, then increased to 140°C at a rate of 10°C/min and maintained for 2 min. The temperature was then increased to 170°C at a rate of 2°C/min, then increased to 250°C at 15°C/min, and maintained for 5 min. The inlet temperature was 300°C, and the analysis was performed in split mode (1:50). The ionization voltage was 70 eV, and the m/z range was 35-500 m/z.
The volatile peaks of each sample were identified by comparison with the RI (Kovats index) recorded in the NIST 17 Mass Spectral Library. The formula for RI calculation was taken from a previous report (Babushok, 2015), and only compounds with RI values in the database were adopted (Babushok, 2015). Furthermore, compound identification was confirmed when the NIST mass spectral match score was ≥ 80, and the retention index (RI) deviation from literature values was within ± 20 units. The detected volatile compounds were expressed as internal standard-equivalent concentrations (micrograms per gram of dry weight, μg/g DW) using a semi-quantitative procedure. Due to the absence of calibration curves for individual compounds, these values do not represent absolute concentrations, but relative estimates based on the internal standard. The semi-quantification was performed by dividing the peak area of each volatile component by the peak area of the IS and multiplying the ratio by the initial concentration of the IS. The variability among replicates was within ± 10%, ensuring analytical reliability. Possible uncertainties arising from matrix effects and response-factor variations were considered in data interpretation.
Excel 2016 software was used for processing the data for volatile component analysis. Minitab ver. 14.12 (Minitab, Inc., State College, PA, USA) was used for FFD and BBD. Multivariate statistics were performed using R software 4.0.3 (R Foundation for Statistical Computing, Vienna, Austria) and the SIMCA14.1 software package (Umetrics, Umea, Sweden).
3. Results and discussion
Five factors potentially affecting HS-SPME extraction efficiency (SPME fiber type, drying temperature, sample weight, adsorption time, and NaCl amount) were evaluated using single-factor experiments with TN and TA as response indicators, and the optimal range of each factor was successfully obtained. Fig. S1 shows the results of the single-factor test.
SPME fiber is a non-numerical variable whose adsorption properties are determined by the type of coating on the fiber. Three SPME fibers with different coating characteristics were exposed to the headspace of the sample, and their adsorption efficiencies were compared. As shown in Fig. S1A, the 75 μm CAR/PDMS fiber showed the best performance with a significantly higher TN (18) and TA (29.44 × 10⁷) than the 65 μm PDMS/DVB fiber (TN: 6, TA: 21.22 × 10⁷) and the 50/30 μm DVB/CAR/PDMS fiber (TN:16, TA: 27.39 × 10⁷). The 75 μm CAR/PDMS fiber provides high extraction efficiency for volatile compounds and has been used in many studies analyzing volatile compounds in food (Francisco et al., 2020; Manousi et al., 2020; Nam et al., 2019). To maximize HS-SPME extraction, the 75 μm polar CAR/PDMS fiber was used in this study.
Drying temperature can affect the volatile composition and sensory quality of vegetables and is known to promote the production of volatile compounds (Yang et al., 2016). To analyze the effect of drying temperature on the volatile composition analyzed by HS-SPME-GC-MS, five different drying temperatures were set. As shown in Fig. S1B, as the temperature increased, the TN first decreased and then increased, reaching its highest value at 60°C, followed by another decrease and increase. Conversely, the TA increased with increasing drying temperature up to 50°C and subsequently decreased. These results indicate that drying temperature influenced both the number and relative abundance of volatile compounds detected. This concurs with the results of a previous study that showed that TN increased as the drying temperature increased to the optimum temperature (Sánchez-Cabrera and Pino, 2011). Therefore, 60°C was selected as the optimum drying temperature in this study. The oven-drying process may alter the original volatile composition through thermally induced formation of furans and pyrroles and partial degradation of aldehydes, which represents a limitation of the present study. Future studies comparing fresh and dried samples are needed to evaluate the effects of drying on the volatile profiles of Korean perilla, coriander, and shiso.
Adsorption time is a factor that requires careful optimization to accurately quantify volatile compounds. Fig. S1C shows that both TA and TN increased initially, but TA decreased when the adsorption time exceeded 40 min, and TN plateaued from 40 to 50 min. This is a decrease in the amount of previously adsorbed material and is likely due to competition for the adsorption and desorption of volatile compounds on the SPME fiber. Therefore, 40 min was the most desirable adsorption time.
The sample amount is a factor that affects the number and concentration of volatile compounds in the sample. Large sample amounts can adversely affect the release of volatile compounds (Metrani et al., 2021), so the analysis was performed with 0.2 to 1 g of sample. As shown in Fig. S1D, both TA and TN initially increased as the sample weight increased, reached a maximum at 0.6 g, and then decreased. Therefore, a sample weight of 0.6 g was selected as the optimal condition.
By increasing the ionic strength of a liquid sample through the addition of small amounts of NaCl, the solubility of polar organic compounds in water is reduced so that the SPME fiber can adsorb more analytes, thus improving the response value of volatile compounds. However, if the amount exceeds the optimal amount, it interferes with the detection of volatile compounds (Wei et al., 2021). Regardless of the amount of NaCl added (0, 0.2, 0.4, 0.6, 0.8, and 1.0 g), the TN remained constant; conversely, the TA reached a maximum when a NaCl amount of 0.6 g was used (Fig. S1E). Therefore, this result confirmed that the addition of 0.6 g of NaCl was suitable.
The FFD was designed based on the optimal range of each factor obtained through a single factorial design, with TN and TA as response indicators. The significance of each factor and the interaction between factors were identified using analysis of variance (ANOVA). ANOVA results include the sum of squares of deviations, degrees of freedom (DF), mean square of deviations, F-value, and p-value for the linear and quadratic term models (Table S2). Fig. 1 shows a Pareto chart of the main factors in the FFD design. The bar lengths in this chart are proportional to the influence that each factor or interaction has on the response values. ANOVA revealed that the factors’ effects could be ranked as follows: drying temperature (A) > adsorption time (B) > sample amount (C) > NaCl amount (D) (for the TN response; Fig. 1A) and B > C > D > A (for the TA response; Fig. 1B).
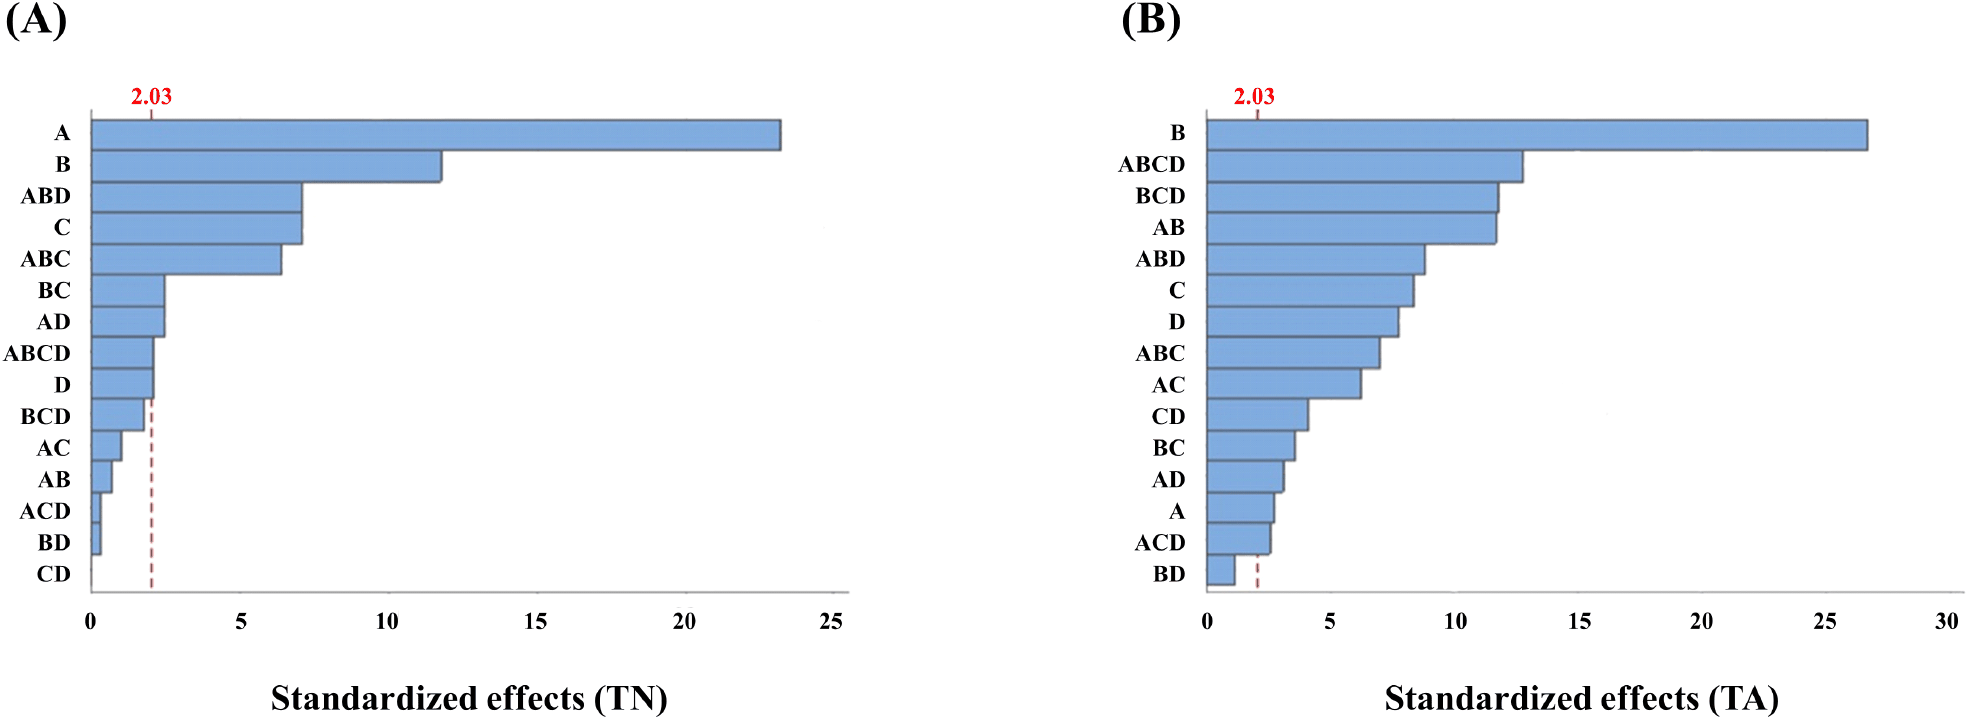
For TA, most of the interactions between the factors were significant except for the interaction of adsorption time with NaCl amount. This means that the interactions among drying temperature, adsorption time, sample amount, and NaCl amount affect the TA response value. Conversely, the TN response value was more affected by the single-factor effects than the interaction effects between factors. While the single effect of drying temperature was highly significant for the TN, it was relatively less significant for the TA. Adsorption time and sample amount showed consistent significance for both responses. The NaCl amount had a low F-value compared to other factors, and the interaction of NaCl with other factors was mostly insignificant. The negligible impact of NaCl was likely due to the low abundance of water-soluble volatile compounds in the matrix. Consequently, the amount of NaCl is not suitable as a main factor due to its consistently low influence on TA and TN. Therefore, drying temperature, adsorption time, and sample amount were determined to be the main factors of the reaction, and the amount of NaCl was fixed at 0.6 g, which showed the highest efficiency in the single-factor test.
RSM evaluates the relationships between multiple independent variables and one or more response variables and is effective in finding the optimal conditions for extraction by describing the relationships between the factors and responses (Liu et al., 2019). The optimal conditions were identified using BBD-RSM, which statistically interprets the interaction between factors and responses and has the advantage of optimizing experimental conditions with a minimum number of experiments (Yang et al., 2022). BBD was based on the results of the FFD analysis, and the degree to which each factor contributes to the response was evaluated using quadratic regression models and ANOVA.
The analysis showed that the p-value, R2, adjusted-R2, and lack-of-fit p-value of the TN and TA models were < 0.0001, 0.9960, 0.9888, and 0.6148, and < 0.0001, 0.9912, 0.9754, and 0.1664, respectively (Table 4). Although the p-values of some quadratic terms in the TN and TA models were not statistically significant above 0.05, the lack-of-fit test was not significant, indicating that the quadratic models fit the data well. This confirms the validity of the experiment, and we conclude that both models are statistically valid and adequately describe the experimental data. Furthermore, the following regression equation was obtained from the ANOVA analysis of the BBD. This equation can be used to describe the relationship between the main factors (drying temperature, adsorption time, and sample weight) and the response variables (TN and TA):
The effects and interaction of drying temperature, adsorption time, and sample amount shown by the BBD ANOVA statistics were visualized using three-dimensional response surface plots generated from the fitted BBD-RSM models (Fig. 2). The analysis was performed with one factor held constant while the values of the other two factors were varied. Fig. 2A-C show the effect of each factor on the TN, and Fig. 2D-F show the effect of each factor on the TA.
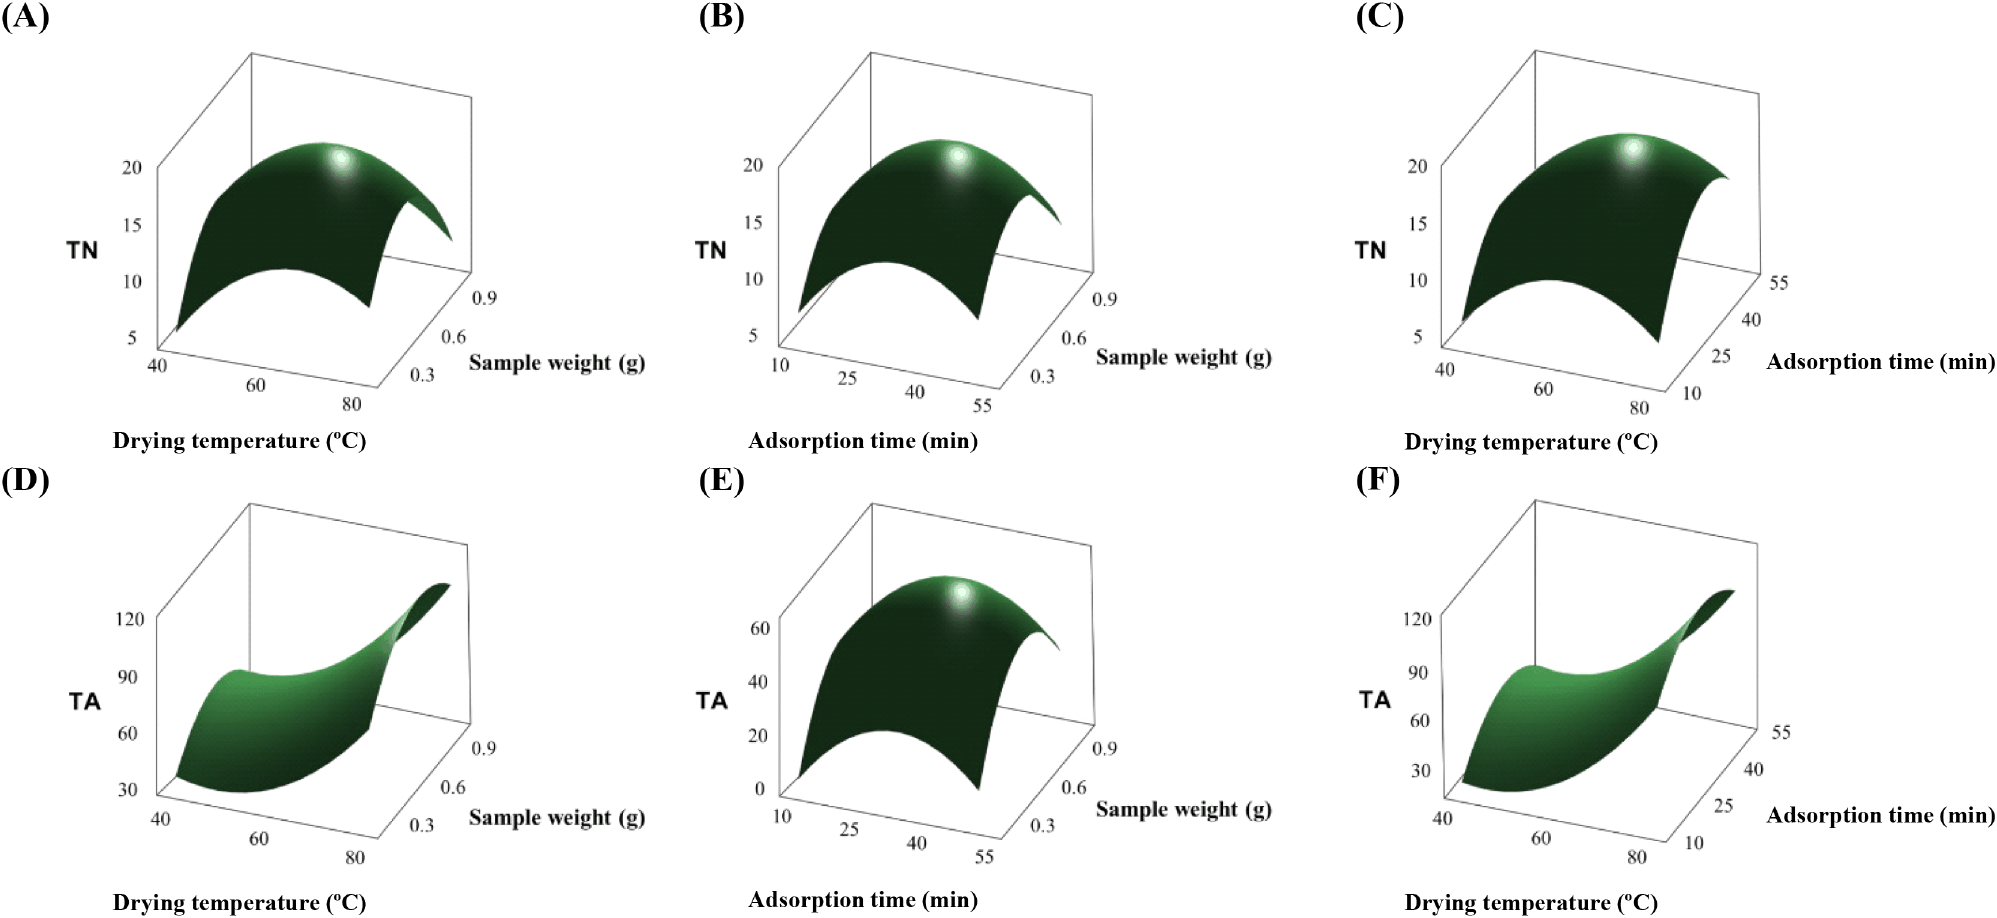
Fig. 2A reveals that the TN increased with increasing drying temperature and sample amount when the adsorption time is fixed at 30 min. When the drying temperature reached 65°C and the sample amount exceeded 0.6 g, TN showed a decreasing pattern. This indicates that TN decreases below a threshold point. When the drying temperature was fixed at 60°C, TN increased with increasing adsorption time and sample amount up to 35 min and 0.6 g, respectively, and then decreased thereafter (Fig. 2B). Finally, TN increased rapidly and then decreased as the drying temperature and adsorption time increased when the sample amount was fixed at 0.6 g (Fig. 2C). As shown in Fig. 2D, TA tended to increase with increasing drying temperature when the adsorption time was fixed at 30 min. However, it decreased when the sample amount exceeded 0.9 g, indicating that a high drying temperature could increase the TA, but it decreased when the sample amount exceeded a certain level. Fig. 2E shows that when the drying temperature was held constant at 60°C, the TA increased with the increase of adsorption time and sample amount and then decreased when the sample amount was above 0.6 g. Fig. 2B shows that the adsorption time and sample amount interacted to affect TN and TA in a similar fashion. Fig. 2F shows that when the sample amount was fixed at 0.6 g, TA increased as the adsorption time increased to 55 min but decreased thereafter. Drying temperature increased the TA as it approached 80°C, suggesting that higher temperature may be a factor in increasing the TA.
Simultaneous optimization of TN and TA using the fitted BBD-RSM models yielded predicted optimal conditions of a drying temperature of 76.3636°C, an adsorption time of 33.8384 min, and a sample amount of 0.6040 g. For practical implementation, these samples were rounded to 76°C, 34 min, and 0.6 g, respectively, and were selected as the optimized conditions for experimental validation.
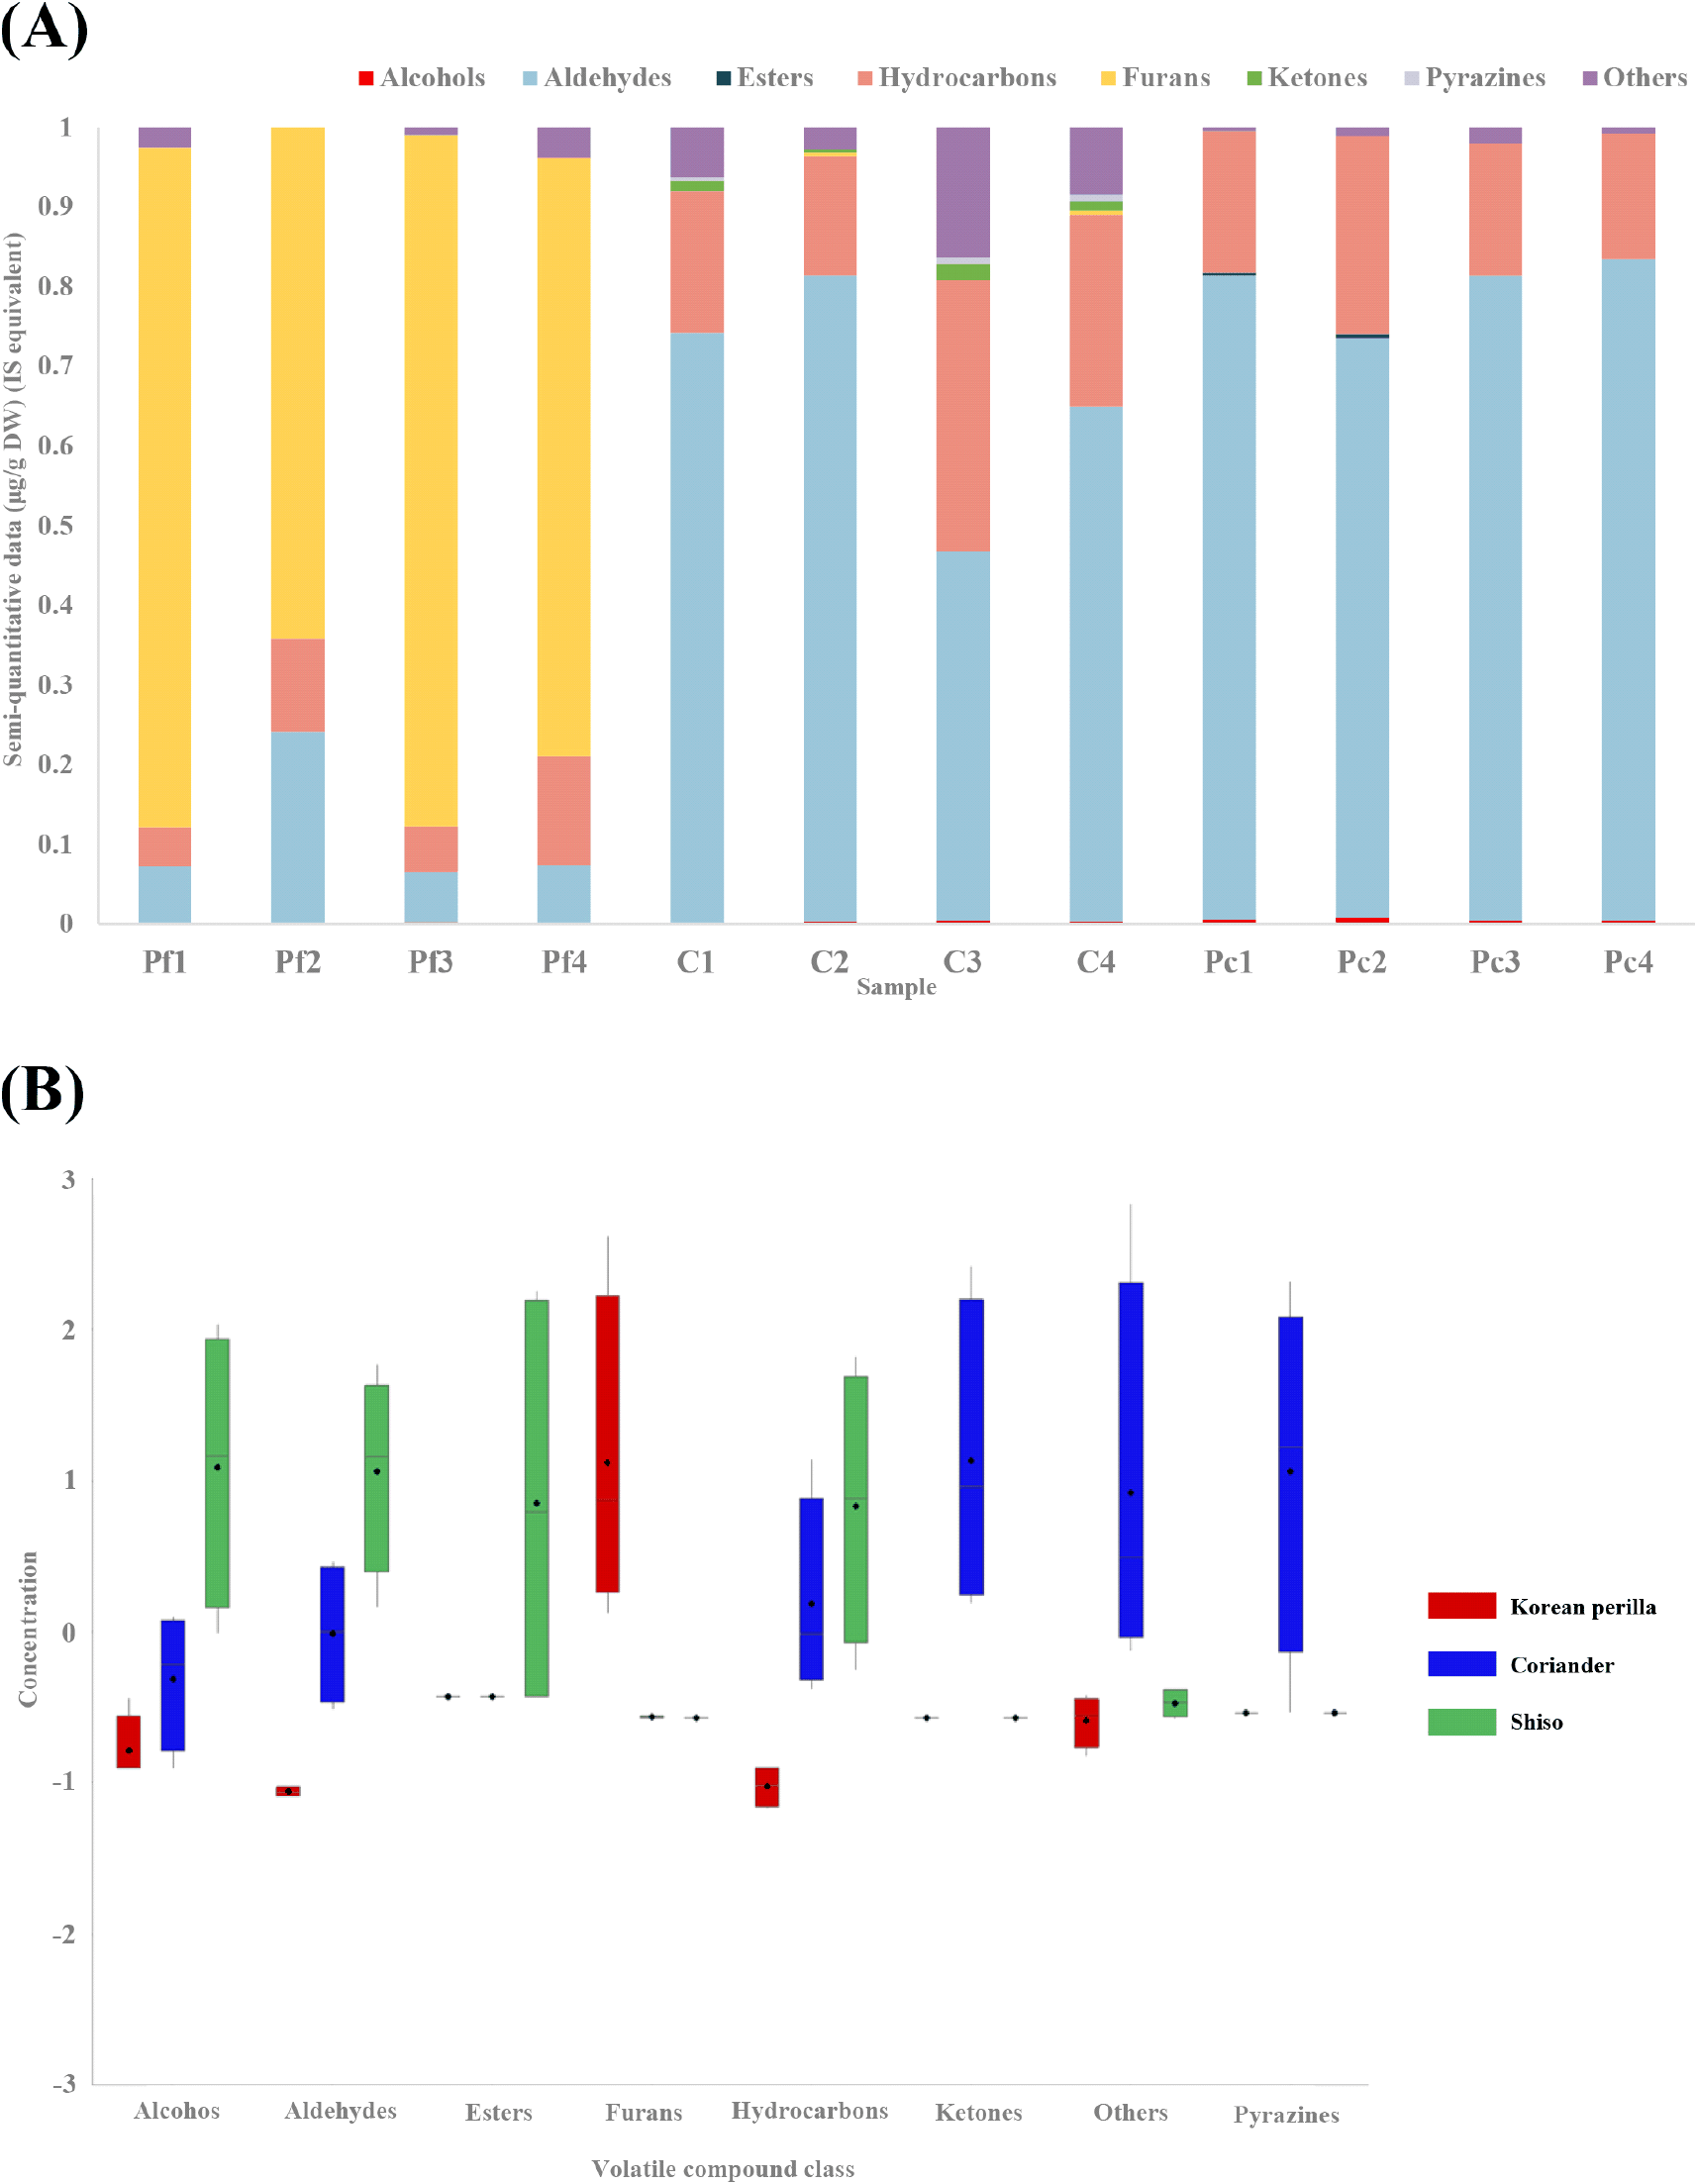
Volatile compounds in Korean perilla, coriander, and shiso leaves were analyzed using HS-SPME-GC-MS. The identified volatile compounds may be characteristic of the three plant species and contribute to their distinct aroma profiles. However, the relatively high drying temperature applied during sample preparation may have partially contributed to the formation of certain furans and aldehydes through thermal or oxidative processes. Among the 51 volatile compounds identified, there were 2 alcohols, 20 aldehydes, 1 ester, 21 hydrocarbons, 3 furans, 1 ketone, 1 pyrazine, and 2 others (Table S3). There were different amounts of volatile compounds in each sample, including 22 in Korean perilla leaves (1 alcohol, 7 aldehydes, 11 hydrocarbons, 2 furans, and 1 other substance), 35 in coriander (1 alcohol, 16 aldehydes, 14 hydrocarbons, 1 furan, 1 ketone, 1 pyrazine, and 1 other substance), and 37 in shiso (2 alcohols, 12 aldehydes, 1 ester, 20 hydrocarbons, and 2 other substances). Thirteen substances were common to each sample, including 4 aldehydes (3-methyl-butanal, 2-methylbutanal, benzaldehyde, and benzeneacetaldehyde), 8 hydrocarbons (1-heptene, 1-octene, octane, and 1-nonene, nonane, 1-decene, decane, and 3-methyl-pentadecane), and 1 other substance (dimethyl sulfide). (Table S3). Quantitative analysis of the volatile compounds detected in each sample revealed that the major compounds in Korean perilla were furans (77.81%), followed by aldehydes (11.25%) and hydrocarbons (9.03%). In coriander and shiso, however, the major compounds were aldehydes (66.49% and 79.34%, respectively), followed by hydrocarbons (22.74% and 18.72%, respectively) (Fig. 3A).
Among the volatile compounds, several representative aroma-related compounds were also observed for each herb. The current results are based on relative semi-quantitative comparisons. Future studies must perform absolute quantification of major volatile compounds such as perillaldehyde and decanal using authentic standards to improve analytical accuracy.
Benzaldehyde, which accounted for the highest content in all samples among the four aldehydes detected, is an aromatic aldehyde produced by the decomposition of amino acids (Cecchi et al., 2018). It is mainly used in perfumes and cosmetics and provides sweet flavors such as almond and cherry (Aljaafari et al., 2022). Every plant produces benzaldehyde or its metabolite benzyl alcohol and its derivatives. Furthermore, benzaldehyde occurs in apples, almonds, apricots, and cherry kernels as a diglucoside called amygdalin, from which it can be liberated by glucosidase-driven hydrolysis (Aliyazicioglu et al., 2015). Benzaldehyde, which was detected in all samples, was likely produced from the hydrolysis of glucosidases in the plant, and the differences in concentration between samples were likely due to differences in the type and content of glucosides contained in each sample.
Eight hydrocarbons were detected in the Korean perilla leaves (6.16%), coriander (18.31%), and shiso (8.22%). Hydrocarbons are known to have a high odor threshold (OT) and, therefore, do not contribute much to food flavor (Zhu et al., 2022). Alkanes have near-odorless properties and do not cause strong odors in food. However, they can indirectly alter food flavor by interacting with other volatile compounds (Rajhi et al., 2022; Wang et al., 2016). Based on the results of this study, it is likely that nonane, decane, octane, and 3-methyl-pentadecane exert a negligible effect on the flavor of spiced vegetables in practice due to the low percentage of each sample. Furthermore, alkenes have a characteristic strong odor and contribute significantly to the overall flavor of the food (Wang et al., 2016). However, the percentages of alkenes in each sample were very low (< 1%), and their contribution to the actual flavor of the spice is thought to be limited.
Dimethyl sulfide accounted for 1.79% of the volatile compounds in Korean perilla leaves, 8.24% in coriander, and 0.82% in shiso. Dimethyl sulfide is an organosulfide compound produced when the amino acid S-methylmethionine is degraded during food storage or heat treatment (Scherb et al., 2009). Dimethyl sulfide is a volatile compound found in various foods, including soy milk, soybeans, and truffles, and the compound is known to add a strong, pungent flavor and impart distinctive odors, such as seaweed or boiled cabbage (Culleré et al., 2013; Morisaki et al., 2014; Scherb et al., 2009). In this study, dimethyl sulfide was possibly generated during the high-temperature drying of all samples. However, the amount of dimethyl sulfide generated appears to be relatively low and is unlikely to significantly affect the flavor of the spice vegetables, except for coriander. Future studies should integrate OAV and GC-O analyses to identify aroma-active volatile compounds and combine these data with consumer panel evaluation to confirm their sensory impact.
Overall, Korean perilla was characterized by a high relative abundance of furans despite having fewer detected volatile compounds than coriander and shiso. In Korean perilla, the major volatile components were 2-hexanoylfuran, benzaldehyde, and benzeneacetaldehyde. Furans, which are found in large amounts in Korean perilla leaves, are formed mainly by thermal decomposition and sugar-amino acid interactions. Caramel, sweet, fruity, and nutty flavors are associated with furans, and the flavor of Korean perilla leaves is believed to originate from furans (Wailzer et al., 2016). Dimita et al. reported that 2-hexanoylfuran was detected as a major component of Korean perilla leaves (Dimita et al., 2022), which is consistent with the results of this study. Furthermore, the semi-quantitative analysis showed that 2-hexanoylfuran accounted for 80.92% of the total volatile compound composition of Korean perilla leaves. This is an increase from the 56% content reported in previous studies, possibly due to differences in growing regions and experimental standards. Therefore, it can be interpreted that 2-hexanoylfuran contributes significantly to the formation of the main flavor of Korean perilla leaves (Dimita et al., 2022).
Coriander was characterized by a relatively high abundance of aldehydes together with hydrocarbons, dimethyl sulfide, and smaller amounts of ketones and pyrazines. Among the detected compounds, decanal, 2-dodecenal, and benzaldehyde were the predominant volatiles. The predominance of aldehydes observed in the present study is consistent with previous reports describing aldehydes as major volatile constituents of coriander (Shahwar et al., 2012; Wei et al., 2024). Aldehyde volatile compounds have a low OT value and can significantly affect food flavor, even at low concentrations. They can produce grassy or fruity flavors at low concentrations but unpleasant off-flavors at high concentrations (Qi et al., 2022). Therefore, some consumers may perceive unpleasant flavors in coriander due to the high amounts of aldehydes. Nonanal, decanal, undecanal, and dodecanal, which were found to be the major volatile compounds in coriander by PCA, are particularly identified as contributing to the overall flavor of coriander. Decanal (18.17%), the most abundant compound in coriander, has sweet, floral, soapy, and citrusy aromas that contribute to the unique flavor of coriander. Dodecanal (5.60%), an aldehyde-like substance, has been associated with the soapy odor characteristics of coriander and has a low OT, so higher concentrations are likely to have a greater impact on the aroma perceived by consumers (Sa et al., 2023). Undecanal (1.21%) has already been reported as a component detected in coriander (Wei et al., 2024), whereas nonanal (0.53%) has not. Undecanal has a relatively high OT for contributing rose or wood-like aromas (Yu et al., 2021) and may exert a negligible effect on coriander flavor. Nonanal is a component with citrus, herbal, and floral-like aromas. It has been detected in various plants, including borage, fig, and green tea, and contributes to the distinctive flavors of these plants. Nonanal compounds play an important role in the overall flavor of plants, even when present in small amounts due to their low OT (Amanpour et al., 2019; Gan et al., 2024; Yao et al., 2021). Therefore, citrus and soapy notes contribute to the overall flavor of coriander, and some fruity and herbal notes are likely to be perceived as well. Wei et al. also identified citrus and soap as the strongest aromas of coriander (Wei et al., 2022), which would support the findings of this study.
No furans were detected in shiso, whereas aldehydes and hydrocarbons were relatively abundant. Hydrocarbons, such as 1-heptene, 1-octene, octane, 1-nonene, 1-decene, and decane, were detected. Additionally, more volatile compounds were detected in shiso than Korean perilla and shiso was characterized by relatively high abundances of perillaldehyde, benzaldehyde, and limonene. These compounds have previously been associated with characteristic odor properties of shiso and related Perilla frutescens materials. Linalool, one of the main volatile compounds in shiso, gives it a bitter taste and imparts orange- and lemon-like aromas (Cho et al., 2024). Linalool also has antibacterial and anti-inflammatory properties. It is extracted from natural resources and widely used in perfumes, cosmetics, and soaps (Hoshino et al., 2020). In the present study, linalool showed a relatively low abundance (0.17%), which is consistent with previous studies (Cho et al., 2024).
(E)-2-Hexenal is commonly associated with green and grassy odor characteristics and has been reported as a major volatile compound in the leaves of P. frutescens. (E)-2-Hexenal was detected as the major volatile compound in the leaves of P. frutescens and was found to be a key component in determining the organoleptic properties of perilla leaves (Seo and Baek, 2009). Therefore, it is likely that (E)-2-hexenal, the main component of shiso, imparts a fresh grassy flavor to shiso and influences consumer flavor perception. Perillaldehyde, which was identified as the main component of shiso, accounted for a high percentage of the total volatile compounds (33.37%). This is consistent with a previous study (Kimura and Taniguchi, 2021) that found perillaldehyde is the main volatile compound in shiso. Perillaldehyde contributes to the functional properties of shiso and is used as an ingredient in Chinese medicine for its detoxification effects (Taira et al., 2021). Perillaldehyde compounds are produced by the monoterpene synthetic pathway and are mainly characterized by herbaceous and spicy flavors; hence, perillaldehyde compounds are likely to impart these flavors to shiso (Lee and Shin, 2024; Lu et al., 2017).
1-Dodecene is a linear alkene; this compound does not contribute significantly to the food matrix and is, therefore, thought to have less influence on flavor (Moran et al., 2022). To our knowledge, 1-Dodecene has been rarely reported as a volatile compound in shiso. It was detected in this study at a low level (0.34%), suggesting that it likely contributes little to shiso flavor.
PCA is a multivariate statistical analysis that reduces the dimensionality of a dataset by transforming correlated variables into a smaller number of orthogonal principal components (PCs) while retaining as much of the original variation as possible (Jin et al., 2023; Li et al., 2022). In this study, PCA was performed to visualize the differences and similarities among the samples based on volatile profiles. Fig. 4A shows the correlations among the samples, and Fig. 4B shows the relationship among the 51 volatile compounds and the samples. PC1 and PC2 explained 76.0% of the total variance in the data (49.2% for PC1 and 26.8% for PC2). The distribution of the samples and volatile compounds is depicted in the biplot of PC1 and PC2 in Fig. 4A. Korean perilla leaves were located in the second quadrant, coriander was in the third quadrant, and shiso was widely distributed in the first and fourth quadrants, indicating that the three spices tend to be grouped separately. PC1 was primarily associated with terpenoid compounds such as perillaldehyde, linalool, and limonene, which differentiated perilla and shiso by their characteristic citrus and mint-like aromas. In contrast, PC2 was mainly driven by aldehydes and esters (e.g., nonanal, decanal, and hexyl acetate), reflecting the herbaceous and fatty notes of coriander. Subsequently, a hierarchical clustering analysis (HCA) was performed on the volatile compound composition of the plant samples. Fig. 4C shows the HCA analysis map, which efficiently identified relationships between samples and patterns of volatile compounds. Red indicates a high value, blue indicates a low value, and the matrix of 12 samples (4 of each sample) and 51 volatile compounds describes the heterogeneity among samples. Pf1-4, C1-4, and Pc1-4 exhibited a clustered structure with a similar grouping pattern, which suggested that they were interrelated and similar. This was consistent with the score plot results of the PCA. Moreover, furans were clustered with Korean perilla leaves, aldehydes with coriander, and aldehydes and hydrocarbons with shiso, which was the same as the results of the quantitative analysis of volatile compounds in each sample in Section 3.2. The heatmap pattern further revealed that the characteristics of volatile compounds of each herb were strongly associated with their respective sample cluster. For example, 2-hexanoylfuran was highly enriched in Korean perilla samples, while aldehydes such as decanal and dodecanal were strongly associated with coriander. In contrast, Shiso samples were closely related to terpenoid compounds such as perillaldehyde and linalool as well as several hydrocarbons, highlighting the distinctive volatile profiles of the three herbs. These results are consistent with studies on the volatile compounds in Korean perilla (Dimita et al., 2022), coriander (Shahwar et al., 2012), and shiso leaves (Sa et al., 2023), which concluded that each volatile compound plays an important role in the organoleptic properties of the crop.
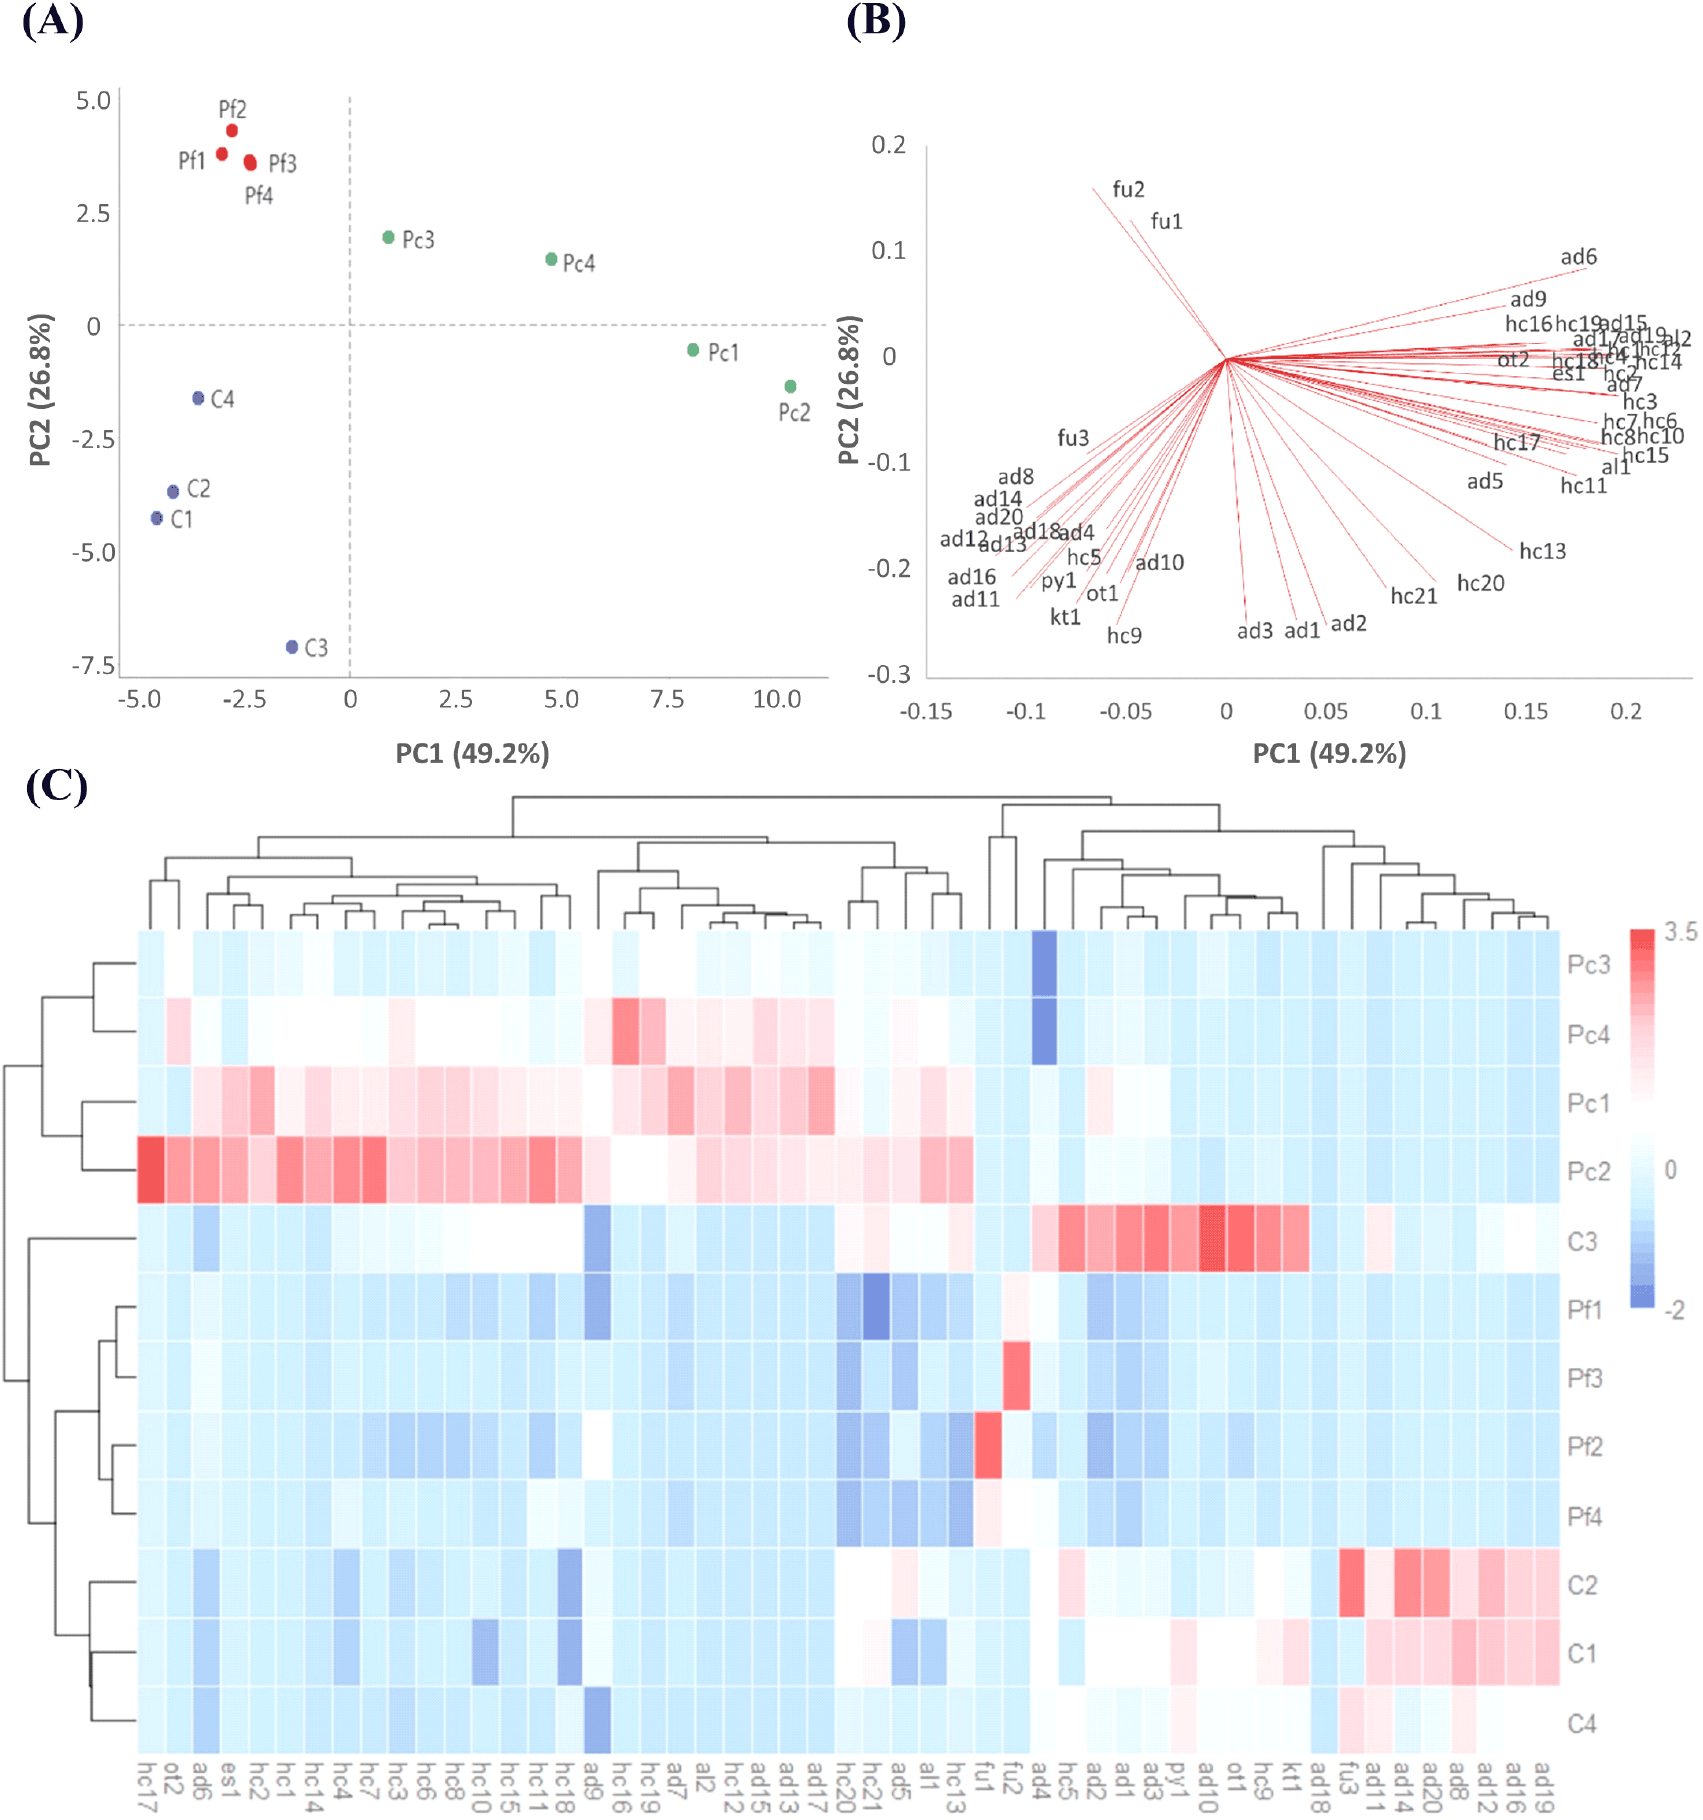
The loading plot further identified the compounds most strongly associated with the separation of the three species. As shown in Fig. 4B, the compound fu2 (2-hexanoylfuran) was associated with Korean perilla leaves, and components such as ad11 (nonanal), ad12 (decanal), ad16 (undecanal), and ad19 (dodecanal) were associated with coriander. In quadrants 1 and 4, components such as al2 (linalool), ad6 [(E)-2-hexenal], ad15 (perillaldehyde), hc3 (1-heptene), and hc15 (1-dodecene) were highly associated with shiso. The volatile compounds that are uniquely detected or highly abundant in each sample play an important role in distinguishing the corresponding spices. Therefore, PCA and HCA results indicated that each sample was successfully separated, and the volatile compounds that are the main components of each spice were visually identified and comprehensively evaluated.
Koreans have been reported to show a preference for relatively sweeter flavors compared to Chinese and Japanese (Zhang et al., 2025). A study has shown that Koreans are particularly positive about nutty flavors (Kim et al., 2020), and these characteristics may be associated with the widespread consumption of Korean perilla leaves, which produce sweet flavors like nuts and caramel. Coriander is another ingredient with a strong preference gap. Its fresh, herbal, and citrusy aroma is cited as a reason for its preference, while those with an aversion to coriander avoid it because they perceive it as having an unpleasant soap scent (Eriksson et al., 2012). These perceptions may be associated with the presence of volatile compounds in coriander that produce citrusy and soapy aroma characteristics. In China, where coriander is viewed positively, it is used in various dishes; conversely, in countries where it is not favored, such as Japan, it is used very infrequently or not at all (Spence, 2023). This difference may be related to long term dietary exposure and cultural familiarity with coriander. In South Korea, coriander is also not well known and generally not favored. In Japan, umami, described as “salty,” “savory,” and “delicious,” is considered the essence of taste and has long been preferred (Gotow et al., 2021). Plant-derived sweetness and umami are important factors that positively influence consumer preferences (Behrens, 2024). Shiso, with its herbal aroma and slight bitterness and sweetness, is used in a variety of dishes, including sushi, pickles, and furikake, and its unique flavor enhances the umami of Japanese cuisine (Mouritsen and Styrbæk, 2020). In this context, shiso may contribute to the flavor profile of Japanese cuisine, which is often associated with umami-related characteristics.
4. Conclusions
In this study, HS-SPME-GC-MS was used to characterize and compare the volatile compounds of Korean perilla, coriander, and shiso, which are major culinary herbs in Korea, China, and Japan, respectively. HS-SPME conditions were systematically evaluated using single-factor experiments and a FFD, followed by optimization using a BBD within response surface methodology. Under optimized conditions, a total of 51 volatile compounds were identified, and differences in their relative abundances among the three plant species were evaluated semi-quantitatively. PCA and HCA revealed distinct patterns in the volatile profiles of Korean perilla, coriander, and shiso and identified volatile compounds associated with the differentiation of each species. Korean perilla was characterized by a high relative abundance of 2-hexanoylfuran, coriander by several aldehydes, including decanal and dodecanal, and shiso by compounds including perillaldehyde. Collectively, the identified compounds help to characterize the differences in volatile profiles among the three herbs. The established volatile profiles provide valuable information for the development of herb-based processed foods and customized flavor compositions according to regional preferences. These findings may provide useful baseline information for future studies exploring sensory perception and consumer responses to these herbs. However, this study is limited by the use of semi-quantitative analysis and the absence of sensory or consumer testing, which constrains direct correlation between chemical composition and perceived aroma. Future studies incorporating absolute quantification using authentic standards, GC-olfactometry, odor activity values (OAVs), and appropriately designed sensory evaluations would help clarify the relationships among volatile composition, aroma perception, and consumer responses to these herbs.