

1. Introduction
Bread is a staple food consumed globally due to its affordability, convenience, and versatility (Zafar et al., 2020). It is the most consumed floury product in the world (Ananda et al., 2024) and is typically made from hard wheat (Oyeyinka and Bassey, 2025). Wheat-based breads, including white and whole meal, are commonly eaten in several parts of the world including Australia, Europe and North America (Lockyer and Spiro, 2020). White wheat and whole-meal flour are significantly different in composition, with the former produced primarily from the endosperm, while the latter retains all parts of the grain. This makes whole-meal richer in dietary fiber, antioxidants, and micronutrients such as B vitamins and iron (Carcea et al., 2019). Consumption of whole meal-based foods may contribute significantly to the intake of bioactive compounds, such as dietary fiber and antioxidants, which are associated with a reduced risk of several chronic diseases (Ciccoritti et al., 2017). Despite these health benefits, the consumption of whole wheat bread remains low across all age groups in the UK (DEFRA, 2024). Studies suggest that this is largely due to its sensory drawbacks. Whole meal breads are often described as having a denser texture, reduced loaf volume, and a darker crumb and crust compared to white bread (Awulachew, 2020).
The presence of bran particles interferes with the formation of a strong gluten network, which is essential for dough expansion and gas retention during proofing (Li and Wu, 2024). Additionally, the coarser texture and more bitter flavor of whole wheat bread contribute to lower consumer acceptance, particularly among younger consumers who prefer the sweeter taste and lighter texture of white bread (Bakke and Vickers, 2007). According to this study, sensory preferences are a barrier to whole wheat bread consumption, but ingredient or processing modifications can improve liking of whole wheat bread to the level of refined bread (Bakke and Vickers, 2007). The impact of bran on sensory properties is not peculiar to bread alone, but other foods made from whole-meal wheat such as pasta. A previous study showed that fractionation of whole meal flour using sieves of different aperture sizes (300 and 112 μm) produced pasta with good antioxidant and improved sensory properties (Oyeyinka et al., 2021). An earlier study on the impact of flour particle size, i.e., finer fractions (< 75 and 75-118 μm) and coarser fractions (118-150 and > 150 μm) showed that finest fractions (< 75 μm) of flour showed stronger quality gluten and better loaf volume compared to coarser fractions (Sakhare et al., 2014). Furthermore, while some report have demonstrated that reducing bran particle size can improve loaf volume and texture (Lai et al., 1989; Moder et al., 1984), others reported that finer particles may increase density and darken the bread (Hemdane et al., 2016; Zhang and Moore, 1999). While previous studies have examined flour particle size effects on bread and pasta quality, little is known about how intermediate sieve-based fractions (< 250 μm and < 500 μm) influence both the functional and bioactive properties of whole wheat flour (Triticum aestivum). This study fills this gap by characterizing multiple flour fractions, providing insights for improving nutritional quality and processing performance in bran-enriched breads. Hence, understanding the functional and nutritional characteristics of different flour fractions is critical to optimizing their use in baking. Key properties such as water and oil absorption capacity, bulk density, and water activity influence dough handling and bread structure. Similarly, the color of the flour and its antioxidant composition can impact both the nutritional value and visual appeal of the final product. Therefore, this study aims to characterize four types of flour, white flour, whole-meal flour, and two bran-rich fractions (< 250 μm and < 500 μm), by evaluating their functional, physical, and nutritional properties. The goal was to identify flour fractions with improved processing performance and potential for use in higher-fiber bread formulations that are more acceptable to consumers. The results will form the basis for selecting suitable flour types for subsequent bread-making trials.
2. Materials and methods
Wheat flour (Triticum aestivum) including brown wheat flour (BWF) and white wheat flour (WWF) were purchased from Tesco Groceries, Holbeach, United Kingdom and analyzed as received without additional fractionation. Flour (250 g per batch) was passed through each sieve (Endecotts, London UK), and the material passing through the 500 μm sieve was collected as the < 500 μm fraction (coarse bran-rich fraction). The material passing through the 250 μm sieve was collected as the < 250 μm fraction (medium bran-rich fraction). All fractions were collected in Ziplock bags and used immediately for analysis. It should be noted that the < 250 μm fraction is a subset of the < 500 μm fraction. This approach was chosen to examine the functional and nutritional properties of flour progressively enriched in finer particles and bran content. The composition of the flour including moisture, fat, ash and fiber was determined using standard methods (AOAC, 2006). Protein content was determined using the DUMAS method and a Nitrogen conversion factor of 6.25, while the carbohydrate was calculated by difference [100 -(ash + protein + fiber + fat + moisture)].
The color of the flour samples was measured using a bench-top colorimeter (Model A60-1014-593, Hunter Associates Laboratory, Reston, USA). The instrument was calibrated using a standard white tile prior to measurement. Color was evaluated based on the CIE Lab color space, where L* represents lightness (ranging from 0 = black to 100 = white), a* represents the red-green axis (positive = red, negative = green), b* represents the yellow-blue axis (positive = yellow, negative = blue) (Falade and Oyeyinka, 2015).
Bulk density of the flour samples was determined using a 100 mL graduated measuring cylinder as previously reported (Oyeyinka et al., 2019). The loose bulk density (LBD) was measured by first weighing the empty cylinder, then gently filling it with flour without tapping or compressing and recording the weight of the filled cylinder. To determine the packed bulk density (PBD), the same cylinder containing the flour was tapped 50 times on a flat surface to allow the flour to settle and compact. The new volume was recorded, and the LBD and PBD were calculated as shown below.
The water absorption capacity (WAC) and oil absorption capacity (OAC) of the flour samples were determined following the method described by Falade and Oyeyinka (2015). For WAC, 1 g of flour was accurately weighed into a centrifuge tube and mixed with 10 mL of distilled water. The mixture was vortexed briefly and allowed to stand at room temperature for 30 min to ensure full hydration. The samples were then centrifuged at 2,900 ×g for 30 min using a refrigerated centrifuge (Model K241R, Centurion Scientific Ltd., Chichester, UK). The supernatant was carefully decanted, and the WAC was calculated and expressed as:
For OAC, the procedure was the same as for WAC, except that 10 mL of sunflower oil was used in place of distilled water. After centrifugation, the unabsorbed oil was removed, and the OAC was similarly calculated and expressed as grams of oil absorbed per gram of flour.
The water activity (aw) of the flour samples was measured using an AquaLab water activity meter (Model 4TE, Meter Group Inc., Pullman, USA), following the method described by Salinas et al. (2012). The device was allowed to warm up for 20 min and calibrated using distilled water before measurement. Approximately 75% of a clean sample container’s volume was filled with each flour sample, which was then placed into the instrument. Water activity values were recorded directly from the digital display once reading stabilized.
Total flavonoid content (TFC), total phenolic content (TPC), antioxidant activity using 2,2-diphenyl-1-picrylhydrazyl (DPPH) and 2,2′-azino-bis(3-ethylbenzothiazoline-6-sulfonic acid) (ABTS) assays, as well as the quantification of targeted phenolic compounds, were performed following the method of Kewuyemi and Adebo (2024). Bioactive compounds were extracted by mixing flour samples with 80% aqueous methanol containing 1% hydrochloric acid (HCl). The mixture was vortexed (K-550-GE, Scientific Industries, Inc., NY, USA) and then sonicated in a water bath ultrasonicator (Argolab AU-220, Carpi, Italy) for 1 hour. The extract was centrifuged at 2,900 ×g for 10 min at 4°C using an Eppendorf 5702R centrifuge (Hamburg, Germany). The resulting supernatant was filtered and used for subsequent analyses, as described in the following subsections.
The TFC of the flour extracts was determined by mixing 10 μL of sample extract with 2.5% sodium nitrite (NaNO2), 1.25% aluminium chloride (AlCl3), and 2% sodium hydroxide (NaOH) in a 96-well microplate. Quercetin was used to generate the calibration curve, and absorbance was measured at 450 nm using a microplate SmartReader™ 96 (MR-9600, Accuris Instruments, Benchmark Scientific Inc., Edison, USA). TFC was expressed as milligrams of quercetin equivalents (mg QE) per gram of sample.
The TPC was determined by mixing 10 μL of the extract with 50 μL of diluted Folin-Ciocalteu’s reagent and 7.5% sodium carbonate (Na2CO3), in a 96-well microplate. Gallic acid was used as the standard, and the plate was incubated at room temperature for 30 min. Absorbance was then read at 750 nm using the same microplate reader. TPC was expressed as milligrams of gallic acid equivalents (mg GAE) per gram of sample.
The ABTS radical scavenging activity of the flour extracts was evaluated by mixing the sample extract with the ABTS working solution in a 96-well microplate and incubated at room temperature for 30 min. Absorbance readings of the reaction mixture and the blank were taken at 734 nm using a microplate SmartReader™ 96 (Accuris Instruments, USA). The percentage inhibition of the ABTS radical was calculated using the recorded absorbances.
The DPPH radical scavenging activity was assessed following the method described by Sadh et al. (2017) with slight modifications. A 0.1 mM DPPH working solution was prepared by dissolving 4 mg of DPPH in 100 mL of methanol. To determine antioxidant activity, 200 μL of the sample extract was mixed with 2 mL of the DPPH solution and incubated in the dark at room temperature for 30 min. The reduction in DPPH absorbance was measured at 517 nm using an Eppendorf BioSpectrometer kinetic (Eppendorf AG 6136), with methanol as the blank.
where A = absorbance of the blank and A1 = absorbance of the extract.
Targeted phenolic compounds, including flavonoids (quercetin, apigenin, luteolin) and phenolic acids (chlorogenic acid, trans-ferulic acid, p-coumaric acid, and sinapic acid), were identified and quantified using an ultra-high-performance liquid chromatography system equipped with a photodiode array detector (UHPLC-PDA; Shimadzu, Kyoto, Japan). Quantification was based on standard calibration curves and expressed as μg/g of sample. The chromatographic separation was performed following previously established conditions, including the use of a specified analytical column and a binary solvent system comprising Phase A: Milli-Q water with 0.10% formic acid, and Phase B: a mixture of acetonitrile (49.95%), methanol (49.95%), and formic acid (0.10%) under a gradient elution program (Kewuyemi et al., 2024).
Flour samples were prepared in two biological replicates, and all analyses were performed in triplicate. Data were analyzed using one-way analysis of variance (ANOVA) with SPSS statistical software (version 21.0, IBM Corp., Armonk, NY, USA). Mean differences were separated using Duncan’s multiple range test at a 95% confidence level (p < 0.05). To explore data structure and identify patterns or outliers, unsupervised principal component analysis (PCA) was conducted using SIMCA-P software (version 13.0, Umetrics AB, Umeå, Sweden).
3. Results and discussion
The color attributes (L*, a*, and b*) of the flour samples differed significantly (p < 0.05) among the various fractions and flour types (Table 1). The lightness value (L*) was highest in white flour (92.38), followed by the < 250 μm fraction (91.83), while the < 500 μm fraction (90.99) and the whole meal flour (86.55) were darker, indicating higher bran content. The redness (a*) values ranged from 0.33 to 1.82, with whole meal flour exhibiting the highest a* value, likely due to phenolic compounds concentrated in the bran. The < 500 μm fraction (0.79) was redder than the < 250 μm fraction (0.33) and white flour (0.33), indicating that coarser particles retain more bran-associated pigments. Yellowness (b*) was greatest in the < 250 μm fraction (10.85), marginally higher than white flour (10.60) and the < 500 μm fraction (10.23), while the whole meal flour had the lowest b* value (9.40). A recent study by Madhumathi et al. (2025) also associated lower L* and higher a* values with the presence of bran in flour blends indicative of higher level of fiber in the flour samples. According to these authors, fractionation of flour seems to be a good strategy in producing flour with unique composition that appeals to consumers and delivers the necessary amount of nutrients (Madhumathi et al., 2025). The color data in this study thus demonstrate that flour color is strongly influenced by particle size and composition, with lighter, finer fractions potentially more acceptable to consumers, while darker, whole-meal flour remain richer in bran-associated pigments.
WWF, white wheat flour; BWF, brown wheat flour; < 500 μm, coarse bran-rich fraction; < 250 μm, medium bran-rich fraction.
The water activity (aw) of the flour samples was slightly impacted by fractionation (Table 1), however, all samples exhibited low aw values (< 0.6), indicating good shelf stability. According to Agba et al. (2024), aw represents the amount of available water in food that supports microbial growth and drives chemical and enzymatic reactions. BWF demonstrated the greatest stability due to its comparatively lower aw.
The proximate composition of the flour samples is presented in Table 1. Fractionation significantly influenced the ash, fat, fiber, protein and carbohydrate, but had no effect on the moisture content of the samples. In general, carbohydrates, followed by protein were the major nutrients in the flour samples. Ash, fiber, moisture and fat contents were generally low. The low levels of moisture indicate a longer shelf-life. Furthermore, the low-fat content in the flour samples suggests low level of germ, which can indicate greater stability as foods rich in fats can negatively affect the stability of food products (Saini et al., 2024).
The carbohydrate content of the white WWF was the highest, while the BWF showed the lowest value. Although the BWF had the lowest level of carbohydrate, it had the highest fiber content, which was higher (2-4 times) than < 250 μm fraction, 500 μm fraction and the WWF. This may be due to retention of bran and germ, which are rich in non-starch polysaccharides. The significant differences among the fractions demonstrate the influence of particle size and processing on fiber retention. The influence of the fiber on functionality is further discussed below. In terms of protein composition, WWF showed significantly higher protein than BWF and the fractionated samples (Table 1). The protein observed in this study is within the range (10.73−1.15%) reported in the literature (Bressiani et al., 2017; Ma et al., 2020; Saini et al., 2024; Wang et al., 2017). Flour with bigger particles (< 500 μm), had significantly higher protein (13.81%) than < 250 μm flour (13.22%), suggesting that protein content decreased with particle size. Earlier researchers also reported a decrease in protein content with size reduction (Ahmed et al., 2015; Ahmed et al., 2016; Hanif et al., 2014). Ahmed et al. (2016), for example, reported lower protein content (7.54%) for flour with smaller particle fraction (74 μm) compared to fraction without sieving (8.4%). Cai et al. (2023) also found that the protein content of wheat flour decreased with decreasing particle size and attributed this observation to the excessive endosperm breakage during milling. The protein content of wheat flour is a critical factor, as it influences not only the nutritional value of the final product but also its baking performance. A previous study associated higher protein content to increased bread volume (Oyeyinka and Bassey, 2025), and other authors reported significant positive correlations between protein content, swelling index, and loaf volume (Barak et al., 2013). These results highlight the potential to tailor flour functionality and nutritional quality by selecting specific milling fractions, with coarser and whole grain flours providing higher fiber content for health-promoting applications.
The functional properties of the flour samples assessed in this study included LBD, PBD, WAC, and OAC, as presented in Table 1. WAC varied significantly (p ≤ 0.05) among the samples, although fractionated flours exhibited similar ability to absorb water. BWF exhibited the highest WAC, likely due to its higher fiber content (Table 1). OAC varied significantly among the flours, with < 500 μm fraction showing lowest ability to absorb oil, while < 250 μm fraction and WWF showed similar OAC. BWF showed intermediate OAC values among the flour samples. Differences in OAC may be due to variation in protein content and possibly the presence of hydrophobic amino acids, which enhance oil-binding capacity. Previous studies associated higher protein levels with increased oil absorption due to their enhanced lipophilic properties (Bolade et al., 2009; Walde et al., 2005).
The LBD of the WWF was higher than that of BWF, reflecting its more uniform particle size and lower fiber content, which facilitate closer particle packing. In contrast, PBD values were similar between the two samples (Table 1). Fractionation of BWF < 250 μm and < 500 μm fractions with LBD comparable to the parent BWF, suggesting that particle size reduction alone had minimal impact on flour aeration. Both fractions exhibited similar LBD and PBD, except for the < 250 μm fraction, which showed a slightly higher PBD than the BWF. This is likely attributable to the smaller particle size, which allows tighter packing and reduced interparticle voids. These observations indicate that bulk density is influenced by both flour composition and particle size, with fiber content primarily affecting LBD, while PBD reflects the efficiency of particle packing.
Fractionation of BWF significantly affected its TPC and TFC as reported in Table 2. The < 500 μm fraction (3.17 mg GAE/g) and BWF (3.26 mg GAE/g) exhibited the highest phenolic concentrations, which was approximately double those of the < 250 μm fraction and WWF. These differences were statistically significant (p < 0.05), indicating that particle size and composition strongly influenced the distribution of phenolic compounds. The higher TPC observed in the coarser fraction and BWF may be attributed to the localization of phenolic acids within the bran and aleurone layers of the wheat kernel (Section 3.6). In contrast, the finer fraction and WWF, composed mainly of endosperm, showed substantially lower TPC. Similar trends have been reported by Yu et al. (2013), who observed TPC values of 1.16-1.55 mg FAE/g in refined flours compared to 2.10 to 2.35 mg FAE/g in whole wheat flours. These findings demonstrate that flour fractionation can enrich phenolic compounds by concentrating bran-rich particles within coarser fractions.
WWF, white wheat flour; BWF, brown wheat flour; < 500 μm, coarse bran-rich fraction; < 250 μm, medium bran-rich fraction.
TFC, total flavonoid content; TPC, total phenolic content; ABTS, 2,2′-azinobis-(3-ethylbenzothiazoline-6-sulfonic acid); DPPH, 2,2-diphenyl-1-picrylhydrazyl.
The TFC of the flour samples showed a similar trend to the TPC values (Table 2). The highest TFC values were recorded in the BWF (1.76 mg QE/g) and < 500 μm fraction (1.68 mg QE/g), whereas the < 250 μm fraction (1.42 mg QE/g) and WWF (1.31 mg QE/g) had significantly lower concentrations (p < 0.05). The enrichment of flavonoids in the coarser fraction may be attributed to the retention of pericarp and aleurone tissues during sieving, which are known to be rich in flavonoid glycosides and other polyphenolic compounds (Suchowilska et al., 2020). In contrast, the finer < 250 μm fraction, composed mainly of starchy endosperm particles, displayed reduced flavonoid levels similar to those of WWF. These results reinforce the relationship between flour particle composition and bioactive compound content, emphasizing that fractionation can serve as an effective method for modulating the nutritional and functional quality of wheat flour.
The ABTS assay showed the highest radical scavenging activity in BWF (22.90%), followed by WWF (19.97%), with the < 250 μm and < 500 μm fractions slightly lower (19.13 and 18.29, respectively). The higher ABTS activity in BWF likely reflects is higher TPC and TFC (Table 2), as phenolic and flavonoid compounds are effective electron donors that neutralize ABTS+ radicals. The moderate ABTS inhibition in the finer fraction reflects the lower phenolic and flavonoid content due to removal of bran-rich particles.
Similarly, DPPH radical scavenging activity was highest in BWF (88.59%) and the < 500 μm fraction (88.38%), whereas the < 250 μm fraction and WWF were slightly lower (87.53% and 87.74, respectively). The trend observed in DPPH inhibition mirrors that of TPC and TFC, suggesting that phenolic and flavonoid compounds are major contributors to the radical scavenging capacity. The slight reduction in antioxidant activity in the finer fractions reinforces the relationship between flour composition and bioactive content (Table 2).
The overall phenolic profile of the flour samples showed that BWF contained the highest levels of phenolic compounds (328.35 μg/g), which was significantly higher than the < 500 μm (2 times higher), WWF (approx. 3 times higher), and the < 250 μm fraction (approx. 5 times higher) (Table 2). Among the phenolics, trans-ferulic acid was the predominant compound, presumably contributing substantially to the total phenolic content, whereas minor compounds such as chlorogenic acid and quercetin were present at much lower levels. The higher concentrations of phenolic compounds in BWF and the < 500 μm fraction explain their elevated TPC and TFC values (Table 2).
These compositional differences were reflected in the antioxidant activities measured by the ABTS and DPPH assays (Table 2). BWF and the < 500 μm fraction, both enriched in bran-associated phenolics, exhibited the strongest radical scavenging capacities, whereas the < 250 μm fraction and WWF showed lower activity. Earlier studies by Li et al. (2022) showed that free phenolic compounds were substantially higher in superfine wheat bran compared to coarse, medium, or fine wheat bran flours. This variation was also reported by these authors to affect the release properties of phenolic compounds after digestion (Li et al., 2022). Thus, the variation in phenolic compounds observed in this study may reflect compositional differences related to bran particle size and could influence their bio-accessibility when consumed. Future research assessing the release properties of the phenolic compounds in foods, such as baked products from the fractionated flours used in this study, may be required.
Pearson correlation analysis revealed a significant positive relationship between the targeted phenolic compounds, antioxidant, total phenolic and total flavonoids of the flour samples (Table 3). The trans-ferulic acid (R2 = 0.678), quercetin (R2 = 0.719), p-coumaric acid (R2 = 0.602), luteolin (R2 = 0.656), and sinapic acid (R2 = 0.679), showed strong correlations with ABTS radical scavenging capacity, compared to chlorogenic acid (R2 = 0.505) and apigenin (R2 = 0.478), which displayed moderate associations. Ferulic acid, being the predominant phenolic compound in wheat and accounting for 70-90% of the total phenolic acids, appears to be the primary contributor to ABTS antioxidant activity. These correlations confirm that phenolic compounds play a major role in determining the antioxidant potential of wheat flour.
Significant positive correlations were also observed between DPPH activity and all measured phenolic compounds, with generally higher coefficients (0.763 ≤ R2 ≤ 0.905) than those for ABTS, further supporting the dependence of DPPH scavenging on phenolic composition. TPC correlated positively with DPPH (R2 = 0.846) and with individual phenolics, including chlorogenic acid (R2 = 0.787), trans-ferulic acid (R2 = 0.683), quercetin (R2 = 0.706), apigenin (R2 = 0.751), p-coumaric acid (R2 = 0.818), luteolin (R2 = 0.770), and sinapic acid (R2 = 0.681). TFC also showed significant positive correlations (p ≤ 0.05) with chlorogenic acid (R2 = 0.558), trans-ferulic acid (R2 = 0.468), quercetin (R2 = 0.618), apigenin (R2 = 0.594), p-coumaric acid (R2 = 0.593), luteolin (R2 = 0.545), and sinapic acid (R2 = 0.467). These trends indicate that the antioxidant potential of wheat flour is largely determined by its phenolic and flavonoid composition, particularly compounds concentrated in the outer kernel layers.
Overall, the results demonstrate that particle-size fractionation and flour type strongly influence phenolic composition, TPC, TFC, and antioxidant activity, with BWF and coarser fractions consistently showing the highest functional potential, while finer fractions and WWF are comparatively depleted in bioactive compounds. These bioactive compounds have been reported to regulate and suppress reactive oxygen species-mediated pathological conditions (Chen, 2016; Pandi et al., 2022). For example, administration of ferulic acid capsules (500 mg twice daily for six weeks) to hyperlipidemic patients resulted in improved lipid profiles, along with significant reductions in oxidized low-density lipoprotein cholesterol, oxidative stress, and inflammatory biomarkers (Bumrungpert et al., 2018). Our results agree with earlier researchers where trans-ferulic acid reportedly dominated the phenolic compounds found in wheat flour (Borrelli et al., 2023; Gawlik-Dziki et al., 2017; Santos et al., 2022; Vaher et al., 2010). These results confirm that flour fractionation influences the phenolic and flavonoid composition, TPC, TFC, and antioxidant activity, directly fulfilling the study’s objective of assessing how particle size affects the functional and nutritional quality of whole grain wheat flour.
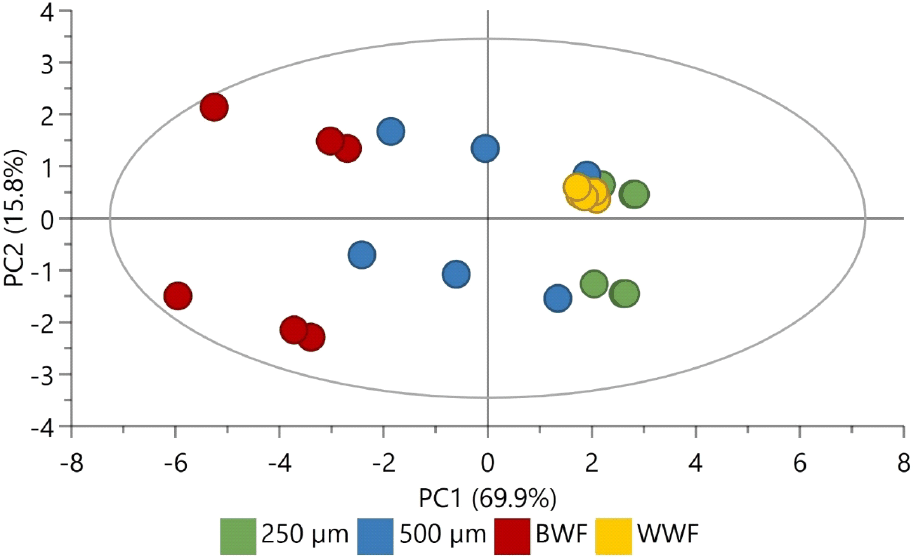
To further understand the impact of fractionation on the phenolic acid composition of the wheat flours, PCA was conducted. The results showed that the first two principal components (PC1 and PC2) together explained 85.7% of the total variance (Fig. 1), with PC1 accounting for 69.9% and PC2 for 15.8%. The PCA score plot based on phenolic compound concentrations effectively differentiated the flour samples according to their overall phenolic profiles. BWF samples were clearly separated on one side of the plot, reflecting their distinct phenolic composition dominated by higher levels of trans-ferulic, sinapic, and p-coumaric acids. Most < 500 μm fraction replicates clustered with BWF, indicating that this fraction largely retains bran-associated phenolics and exhibits a phenolic profile similar to the coarse flour. However, two replicates of the < 500 μm fraction positioned closer to WWF and the < 250 μm fraction, likely reflecting partial heterogeneity within the fraction or potential analytical variability, which may be considered minor outliers. The < 250 μm fraction clustered closely with WWF, consistent with its lower phenolic content. The PCA pattern aligns closely with the TPC, TFC, and antioxidant assay results shown in Table 2. Samples clustering with BWF, including most < 500 μm replicates, exhibited the highest total phenolic and flavonoid contents and the strongest ABTS and DPPH radical scavenging activities. Conversely, samples positioned near WWF and the < 250 μm fraction showed lower TPC, TFC, and antioxidant capacity. This consistency between univariate and multivariate analyses reinforces the conclusion that antioxidant potential in wheat flours is largely determined by phenolic composition, particularly the compounds concentrated in bran-rich fractions, while minor heterogeneity in fractionated samples can lead to slight variation in phenolic content and functional properties. These results demonstrate that particle-size fractionation strongly influences the phenolic composition and antioxidant potential of wheat flour, with BWF and coarser fractions exhibiting higher bioactive content, while finer fractions and WWF are comparatively reduced.
4. Conclusions
This study demonstrates that flour fractionation significantly influences the phenolic composition, antioxidant potential, and functional properties of wheat flour. BWF consistently exhibited the highest total phenolic and flavonoid contents, as well as the strongest ABTS and DPPH radical scavenging activities, reflecting its bran-rich composition. Fractionated flours, particularly the < 500 μm fraction, retained substantial phenolic content and antioxidant activity, whereas the finer < 250 μm fraction and WWF were comparatively depleted. Phenolic acids, especially trans-ferulic acid, predominated in all samples and correlated strongly with TPC, TFC, and antioxidant activities, highlighting their central role in the functional potential of wheat flour. Principal component analysis further confirmed distinct clustering of samples according to flour type and particle size, illustrating the impact of fractionation on phenolic profiles. Overall, these findings indicate that targeted flour fractionation can enhance the nutritional and functional quality of whole grain wheat flour without complete removal of bran, offering a practical approach to develop healthier baked products. Future studies should investigate the application of fractionated flours in bread and other baked goods, focusing on dough rheology, texture, sensory quality, and the retention of bioactive compounds during processing. Additionally, exploring the effects on protein content, starch digestibility, and overall nutrient bioavailability will provide a more comprehensive understanding of how fractionation influences both functional and nutritional performance in whole grain-based foods.


