
Introduction
Milling is the process of removing the hull and bran from rice using a threshing machine and producing polished rice through a cleaning process. The degree of milling indicates the extent of milling by weight and the milling ratio (or milled/brown rice ratio) indicates the weight percentage of milled rice to brown rice. Although variations exist depending on the breed or cultivation region of rice, starch generally accounts for 75-80% of the rice grain by weight (Ahn and Ha, 2010; Lee, 2013). The outer layer of the grain consists of 7-8% protein, 1-3% fat, and vitamins and minerals (Lee et al., 2011). Therefore, the degree of milling is closely related to the quality of rice, and the fat and ash contents in the outer layer decrease as the degree of milling increases (Chun et al., 2012). Rice ‘Nuruk’ is a fermentation agent containing enzymes that can saccharify starch and is produced by inoculating steamed rice, which is a starch source, with fungi from a pure culture (Kwon et al., 2013). For fermented alcoholic beverages made from grain, the starch in the grain is converted into sugar and an alcoholic beverage is produced through the fermentation of such sugars. In this process, diastatic enzymes produced from microorganisms or grain are required; a primary source of such enzymes is ‘Nuruk’. Hence, ‘Nuruk’ may be the most important factor that determines the fermentation efficiency and quality of alcoholic beverages (Park and Chung, 2014).
As described above, there are generally numerous components other than starch in the outer layer of the grain such as protein, fat, and ash. Studies have reported that these components promote the growth of mold and yeast in addition to adding color to alcoholic beverages, wherein the chromaticity depends on the degree of milling (Chun et al., 2012; Kim et al., 2004). Because the degree of milling affects the quality of rice, variations in this process are likely to cause in the growth rate of microorganisms or the enzymatic activities, thereby affecting the quality of the ‘Nuruk’. We hypothesized that the products of the mold vary depending on the conditions of ‘Nuruk’ fermentation. Such produces can thus affect the quality of alcoholic beverages. Therefore, in this study, we manufactured rice ‘Nuruk’, a fermentation agent that can affect the quality of alcoholic beverages, using different degrees of milling and examined the quality characteristics of the rice ‘Nuruk’.
Materials and methods
Odaemi (a rice variety) produced at the Galmal Nonghyup general rice facility in Cheolwon, Gangwondo was used in this study. Polished Odaemi (moisture content: 12.68±0.16%) was used as a reference (brown rice is used as a reference for the general milling ratio), and the rice was milled at 10% (milled rice percentage (MRP) 90%), 30% (MRP 70%), and 50% (MRP 50%) using the rice milling unit (Type 80824, Satake Corporation, Hiroshima, Japan). Here, the degree of milling was calculated as follows: degree of milling = {1 − (milled rice/polished rice)} × 100 (%). The MRP was calculated as follows: MRP = (milled rice / polished rice) × 100 (%) (Liu et al., 2015). Rice ‘Nuruk’ (Aspergillus oryzae) was produced using mold starter A. oryzae (20×109/g, moisture content less than 10%, 30 saccharogenic power (SP)) (Chung Moo Fermentation Co., Woolsan, Korea). The reagents used in this study were of special-grade.
Five kilograms of each milled rice sample was thoroughly washed and soaked in water for different durations. The soaking duration was determined based on investigations on the water absorption rate of rice depending on the degrees of milling. Next, the rice was drained for 1 h, placed in a preheated cooker (MS-30, Yaegaki Food & System Inc., Himeji, Japan), and then steamed for 1 h. After steaming, the rice was cooled to 50°C, and 0.01% A. oryzae starter (compared to the amount of rice) was aseptically inoculated into the riece and mixed well for sufficient absorption. The samples were then incubated for 43 h in an incubator (VS-1203PFHLN, Vision Scientific, Co., Ltd., Daejeon, Korea) (35°C, 98% relative humidity). Throughout incubation, the samples were turned over at 13, 15, 21, and 27 h to lower the temperature of the samples and improve mixing. After incubation, the ‘Nuruk’ was evenly spread out at room temperature (25°C) and dried for 1 h.
The moisture contents of rice and rice ‘Nuruk’ following different degrees of milling were measured using a moisture analyzer (AND MX-50, AND Company Ltd., Tokyo, Japan). To measure the starch values of rice with different degrees of milling based on a previously reported procedure (Kim et al., 2011), 1 g of each ground sample was mixed with 300 mL of water and 15 mL of concentrated hydrochloric acid (35%). This mixture was steamed at 100°C for 2-3 h in an autoclave. The samples were then cooled with cold water, and the pH was adjusted to 4.3-4.5 using 20% NaOH; the total volume of each sample was then adjusted to 500 mL. This sample was referred to as the saccharification liquid and was used to measure the reducing sugar content using a modified dinitrosalicylic acid (DNS) method (Luchsinger and Cornesky, 1962). Next, 3 mL of the DNS reagent was added to 1 mL of the diluted saccharification liquid. This mixture was then heated for 5 min in a water bath (B-490, BUCHI, Flawil, Switzerland) and then quickly cooled. Subsequently, 5 mL of distilled water was added to this sample, and the absorbance was measured at 550 nm using a UV-visible spectrophotometer (JP/UV-2450, Shimadzu, Kyoto, Japan). The sugar content was determined from a standard curve obtained as described above using glucose (Sigma-Aldrich Co., St. Louis, MO, USA) as a reference. After the reducing sugar content was measured, the starch value was calculated as follows (Editors of brewing society of Japan, 1993).
The general components of rice and rice ‘Nuruk’, such as ash, crude fat, and protein as well as vitamin B2 and minerals (Fe and Mn), in the samples subjected to different degrees of milling were analyzed using the general test methods outlined in the Korean Food Standards Codex (KFDA, 2015). The ash content was analyzed by the dry heat incineration method using muffle furnace at 550°C. The crude fat content was measured by the Soxhlet method using diethyl ether after grinding the samples. The crude protein content was measured by the Kjeldahl method. All analyses were repeated thrice.
The increase in the moisture content of the rice samples subjected to different degrees of milling was analyzed according to a procedure described by Kim and Jeon (1996). First, 50 g of each rice sample was soaked in water at room temperature (25°C) and hydrated at a constant interval. The samples were then rolled on filter paper (No.1, Advantec Co., Ltd., Tokyo, Japan) to remove water from the surface, and the resulting increase in weight was measured.
First, 20 g of rice ‘Nuruk’ was placed in a 200 mL Erlenmeyer flask, to which 100 mL of distilled water was then added. The flask was sealed with plastic wrap and at room temperature (25°C) for 3 h with occasional mixing for extraction. The sample was then filtered using filter paper (No.2, Advantec Co., Ltd., Tokyo, Japan), and the filtrate was used for the following experiment. The pH of the filtrate was measured using a pH meter (Orion 3 Star Benchtop pH meter, Thermo Fisher Scientific Inc., Waltham, MA, USA), and the acidity was measured based on the volume (in mL) of 0.1 N NaOH used to titrate 10 mL of the filtrate until the color of the sample changed to light green (Editors of Brewing Society of Japan, 1993). To measure the amino acidity, 10 mL of the filtrate was added to a flask and titrated against 0.1 N NaOH until the color changed to light pink. Next, 5 mL of a neutral formalin solution was added to restore the original color of the sample. Again, 0.1 N NaOH was added until the light pink color appeared, and the total amount of titrating solution used was determined. The soluble solid content (°Brix) was measured using a digital refractometer (PR-201, Atago Co., Tokyo, Japan). The reducing sugar content was measured using a modified DNS method.
Enzymes were extracted from rice ‘Nuruk’ as follows. To 10 g of rice ‘Nuruk’, 50 mL of 10 mM acetic acid buffer (pH 5.0) containing 0.5% NaCl was added and shaken occasionally at room temperature (25°C) for 3 h for extraction. The mixture was filtered using filter paper (No. 5C, Advantec Co., Ltd., Tokyo, Japan), and the filtrate was diluted and used as enzymatic activity samples (Editors of Brewing Society of Japan, 1993).
The activities of α-amylase, glucoamylase, and acidic protease of rice ‘Nuruk’ with different degrees of milling were measured using an analytical method described in the foodtnotes of the National Tax Agency analytical method (Editors of Brewing Society of Japan, 1993; Kim et al., 2010).
First, 2 mL of a 1% starch (Wako Pure Chemical Industrial, Ltd., Osaka, Japan) solution was preheated at 40°C for 5 min, and then 0.1 mL of the enzyme solution was added. Next, 0.1 mL of the mixer was removed at 0 min (T0) and after 30 min (T30), each of these samples was added to 10 mL of an iodine solution (Iodine, Sigma Chemical Co., St. Louis, MO, USA). The penetration ratio (T%) of the mixture was determined at 670 nm using a UV-visible spectrophotometer. The enzyme activity was calculated using the following equation.
First, 1 mL of a 2% starch (Wako Pure Chemical Industrial, Ltd., Osaka, Japan) solution was preheated with 0.2 mL of a 0.2 mol sodium acetate buffer at 40°C for 5 min. Then, 0.1 mL of the enzyme solution was added. The sample was activated at 40°C for 20 min. Then, 0.1 mL of a 1 N sodium hydroxide solution was added to stop the reaction. After 30 min, 0.1 mL of 1 N HCl (Junsei Chemical Co., Tokyo, Japan) was added to neutralize the solution. The content of glucose was measured using a modified DNS method. The enzyme activity was calculated using the following equation.
First, 1.5 mL of a casein solution was preheated with 1.0 mL of pH 3.0 Mcllvaine buffer at 40°C for 5 min. Next, 0.5 mL of the enzyme solution was added, and the solution was activated at 40°C for 60 min. Then, 0.1 mL of 0.4 M trichloroacetic acid was added to stop the reaction, and the precipitate was removed. Afterward, 1 mL of this reaction solution was reacted with 5 mL of 0.4M Na2CO3 and 1 mL of a phenol reagent at 40°C for 30 min to produce a color change. Then, the absorbance of each sample at 660 nm was measured. As a control, the enzyme solution was added immediately before the addition of 0.1 mL of 0.4 M trichloroacetic acid. The solution was then allowed to react, and the absorbance was measured as described above. The difference in the absorbances of the test solution and the control solution was y (μg), which was obtained from a calibration curve of tyrosine. The enzyme activity was calculated using the following equation.
All data were measured in triplicate and expressed as the mean±SD. For the statistical analysis, SPSS (version 12.0, SPSS, Inc., Chicago, IL, USA) was used to perform one-way ANOVA. When significant differences between samples were detected, Duncan’s multi-range test was performed at α = 0.05. Additionally, correlation analysis, and paired t-test were performed to analyze the correlation between samples.
Results and discussion
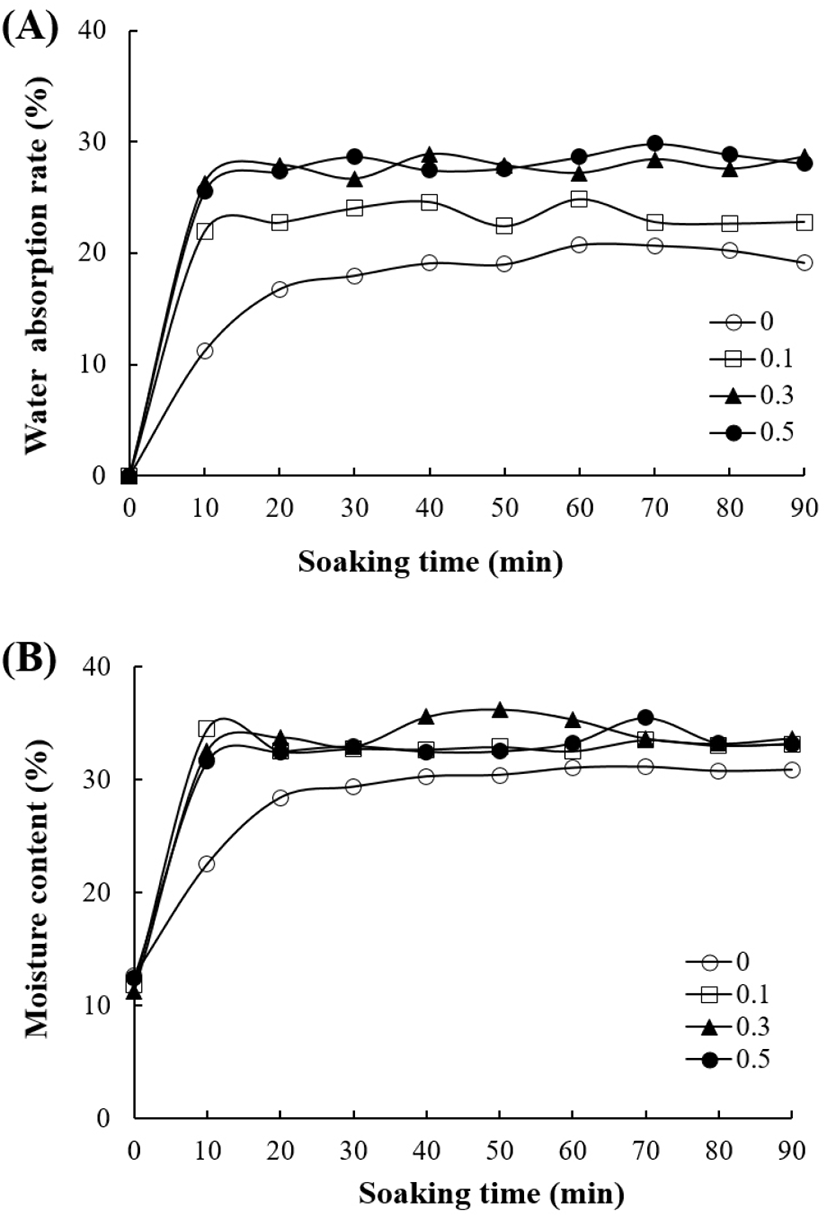
An important step in making ‘Nuruk’ is the optimal production of useful enzymes by the mold starter. Hence, controlling the moisture content in steamed rice is crucial (Jeong, 2012). Moisture content of 35-38% is desirable in steamed rice. To obtain steamed rice with desirable moisture content, rice (moisture content: 12.5%) must be soaked in water until the water absorption rate reaches 25%. Therefore, to determine the soaking time before producing rice ‘Nuruk’, the water absorption rate and moisture content of rice with different degrees of milling were measured until equilibrium was reached (Fig. 1). The hydration of the rice samples exhibited variations depending on the degree of milling. When soaked in water at 25°C, polished rice without milling reached equilibrium within 20 min with a moisture content of 30%. The other treatment groups typically reached equilibrium after 10 min of soaking. The moisture contents of such groups were also higher than that of polished rice without milling. In particular, rice with 50% milling had a higher moisture content than the other treatment groups after 10 min of soaking. Similar to the results from a study by Mok et al. (1983), who examined the hydration properties of barley with different degrees of milling and reported that the hydration rate increased as the degree of milling increased, our results suggest that milling affects the water absorption rate and time of rice. Thus, the water soaking time in the water was set to 20 min for polished rice without milling and 10 min for the other treatment groups.
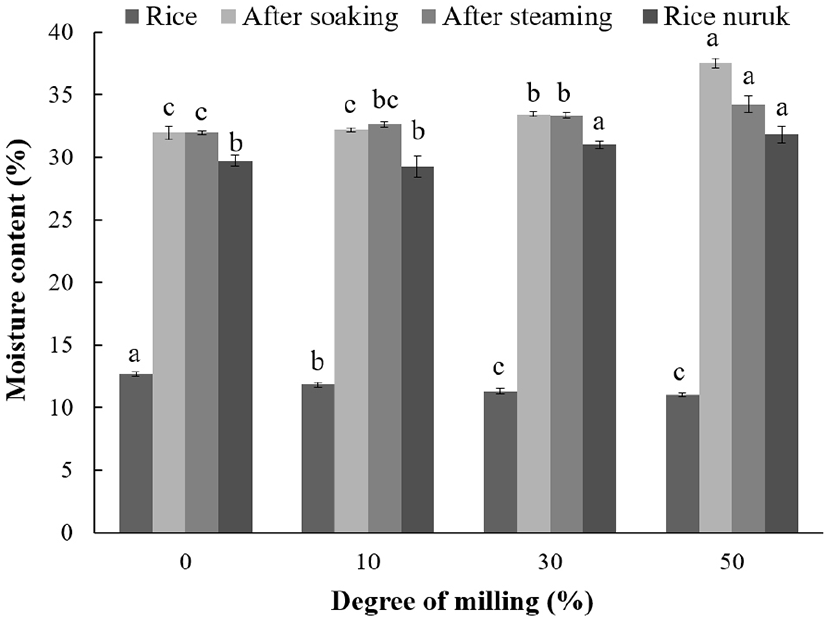
The moisture content of rice with different degrees of milling ranged from 11.04% to 12.68%, with the moisture content significantly decreasing as the degree of milling increased (Fig. 2). By contrast, the moisture contents of ‘Nuruk’ after soaking in water for a set duration ranged from 31.99% to 37.47%, and the moisture content after steaming ranged from 31.79% to 34.27% depending on the degree of milling. These results indicated a significant increase in the moisture content as the degree of milling increased. Particularly, the moisture content of steamed rice is important because the moisture content is associated with the proliferation of mold and enzyme production in ‘Nuruk’. A previous study (Bae, 2008) reported that mold proliferation becomes challenging when the water content in steamed rice is low. However, when the water absorption rate of steamed rice is higher than 24%, the growth rate is not affected (Bae, 2008). We found that excessive moisture content reduced the enzyme production in steamed rice. This may be because the increase in glucose during steaming inhibits the production of hydrolytic enzymes. Therefore, to obtain ‘Nuruk’ with high activity, controlling the moisture content of steamed rice is important, and proper control of the moisture content of steamed rice begins in the soaking step. The experimental results revealed that the moisture content of the steamed rice was within the range wherein the growth rate of mold is unaffected.
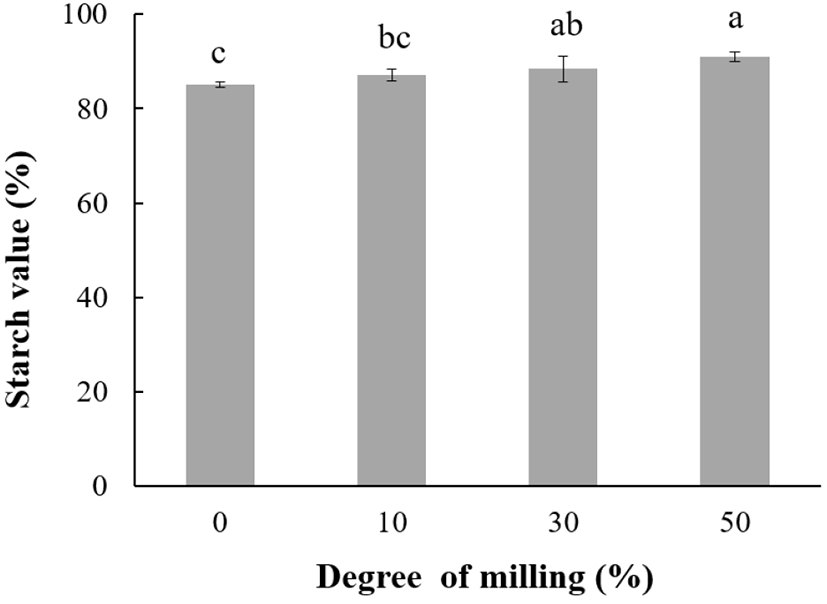
The starch value, which is the mass of starch in 100 g of a sample, accounts for sugars, dextrin, and starch. A higher starch content indicates higher production of sugar components and is associated with a higher alcohol yield in alcohol fermentation (Kim et al., 2011; Lee et al., 2013). The starch values of rice with different degrees of milling were analyzed to determine the effect of milling on the properties of ‘Nuruk’. The starch values of the samples ranged from 85.13% to 90.99% and increased as the degree of milling increased. Regression analysis and one way ANOVA, revealed that the degree of milling significantly affected the starch value (p<0.05) (Fig. 3). We calculated that when the degree of milling was increased by 1%, the starch content increased by 1.887% with an explanatory power of 71.8% (according to correlation data between the starch value and the degree of milling, data not shown).
Our results were in agreement with those of Kim and Jeon (1996) which determined that the general components such as protein, ash, and fat decreased as the degree of milling of rice increased, because such components are mostly distributed in the outer layer of rice. A study by Ke (1966) analyzed the changes in the components of rice depending on the degree of milling and determined that the contents of nutrients decreased as the degree of milling increased. Analysis of the components in rice ‘Nuruk’ with different degrees of milling showed that all components, other than crude fat, significantly decreased as the degree of milling increased. The crude fat and iron contents differed from the contents of the other components depending on the degree of milling (Table 1). As shown by the paired t-test to compare the components of rice and rice ‘Nuruk’ depending on the degree of milling, the crude protein content significantly decreased for all treatments groups. Crude fat showed significant differences only for 0% milled ‘Nuruk’, which was not milled, whereas crude ash showed significant differences for 30% and 50% milled ‘Nuruk’ (data not shown). This result is likely because Aspergillus used these components for growth, which would account for the difference between the amounts of these components in rice and ‘Nuruk’.
The pH was the lowest (5.32) in rice ‘Nuruk’ with 0% milling and highest (5.98) in rice ‘Nuruk’ with 30% milling. This result indicated that there is no correlation between the degree of milling and pH. There was also no clear trend in the acidity with respect to the degree of milling (Table 2). The soluble solid and reducing sugar increased as the degree of milling increased, such values were correlated with the starch values in rice with different degrees of milling (correlation coefficient: 0.825, Table 3). The acidity generally decreases upon milling and correlates with the protein content in rice. (Baek et al., 2011). In this study, however, the acidity did not seem to be correlated with the protein content in rice.
During proliferation, A. oryzae obtains nutrients required for proliferation from steamed rice. Therefore, A. oryzae secretes various enzymes such as starch-degrading enzymes, proteases, and lipases (Bae, 2008). The main enzymes involved in brewing include α-amylase, glucoamylase, and acidic protease. Thus, the activity of each enzyme was analyzed according to the degree of milling. α-Amylase is an enzyme that liquefies the starch in steamed rice during brewing. When the starch in steamed rice does not dissolve, many lees are generated (Bae, 2008). The α-amylase activity of the 10% milled rice ‘Nuruk’ is presumed to have resulted from an experimental error, and the α-amylase activity of the rice ‘Nuruk’ with a higher degree of milling was decreased (Fig. 4). Glucoamylase is also known as a diastatic enzyme because it breaks the non-reducing end group of the starch α-1,4 bond to yield glucose; yeast then converts glucose into alcohol via fermentation, which is as an important indicator for evaluating ‘Nuruk’ (Bae, 2008). The glucoamylase activity was highly affected by the degree of milling, and significantly decreased as the degree of milling increased (Fig. 4). Acidic protease hydrolyzes proteins and produces low-molecular weight watersoluble peptones. This imparts a pleasant taste and promotes the saccharification of rice starch (Jeong, 2012). In addition, acidic protease degrades proteins and produces alcoholic beverages with five balanced flavors. L-glutamic acid is a flavor component present in natural food products and contributes to the overall flavor of food. Aspartic acid is an amino acid that produces a sour taste, and its Na dissociates in aqueous solutions to produce an umami taste similar to that of L-glutamic acid. Furthermore, arginine, leucine, tyrosine, and phenylalanine have been reported to produce a bitter taste, but this taste may be favorable for the flavor of alcoholic beverages. Thus, the flavor of alcoholic beverages arises from the combination of amino acids with five flavors (Lee et al., 1991). Moreover, acidic protease is required for diastatic enzymes to be in a state that enables them to act on the starch of steamed rice (Bae, 2008). Acidic protease is an essential enzyme for brewing. Analysis of acidic protease enzymatic activities in rice ‘Nuruk’ with different degrees of milling (Fig. 4) showed that although there was no clear trend with respect to the degree of milling, ‘Nuruk’ produced from 30% milled rice showed the highest enzymatic activity. Hence, such a high expression of acidic protease may be associated with a component contained in 30% milled rice.
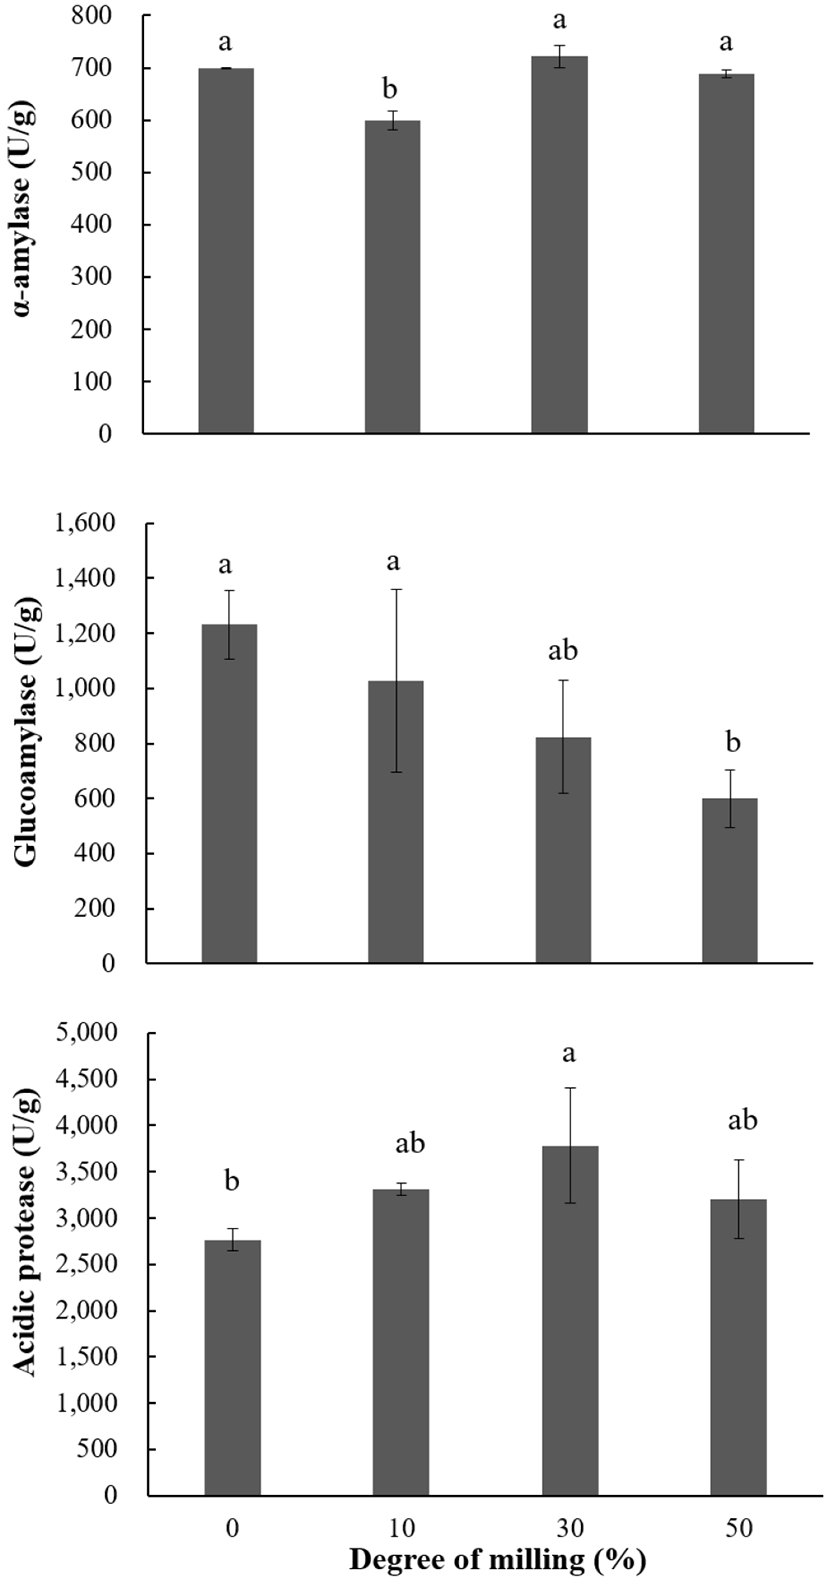
Analysis of the correlation between the moisture content of steamed rice and the enzymatic activity revealed that the activity of glucoamylase significantly decreased as the moisture content of the steamed rice increased (Table 3). This result is likely because hydrolytic enzymes produced by Aspergillus sp. were inhibited as the amount of glucose increased in the steamed rice (Bae, 2008). As shown in Table 3, the correlation coefficient between the reducing sugar content and the moisture content of steamed rice was 0.860, suggesting a close correlation. This result indicates the level of glucose increased as the moisture content of steamed rice increased. In addition, the activity of glucoamylase decreased as the starch value of rice increased, whereas the activity increased as the crude protein content in rice increased. The activity of acidic protease showed a negative correlation with the crude lipid content of rice.