Introduction
Aronia (Aronia melanocarpa) is a deciduous shrub belonging to the Rosaceae family, which grows in the northeastern part of North America, and is also known as the black chokeberry (Tolic et al., 2015; Wu et al., 2004). Recently, aronia has been cultivated in eastern European countries, Russia and Korea, and its cultivation and yield are gradually increasing (Domarew et al., 2002; Hwang and Thi, 2016). Aronia is known to have a higher content of polyphenols, phenolic acids, proanthocyanidins, anthocyanins, flavonols and flavanones than the other berries (Koponen et al., 2007; Slimestad et al., 2005; Wu et al., 2004). Aronia is known to have excellent in antioxidant activity, and is highly effective in preventing arteriosclerosis, cardiovascular disease, cancer and diabetes (Girones-Vilaplana et al., 2012; Hellstrom et al., 2010; Jakobek et al., 2012). Like other general fruits and vegetables, aronia may have different physiologically active substances, or exhibit antioxidant activity based on the cultivation environment such as temperature, rainfall, and sunshine in the cultivation area or during the cultivation period (Jeong et al., 2016; Tolic et al., 2015).
As aronia cannot be harvested all year long and has a strong sour and astringent taste as compared to other berries, research is being conducted to add it to various processed foods in the form of lyophilized powder or extract, instead of eating raw fruits (Hwang and Thi, 2014). Aronia cultivation is increasing, and research shows that ingestion of aronia is beneficial to health, adding aronia to various foods such as juice, yogurt, rice cakes, and cookies (Hwang and Hwang, 2015; Lee and Choi, 2016; Nguyen and Hwang, 2016). Although the development and demand for processed products containing aronia is increasing, few studies have been conducted to compare the antioxidant contents of aronia growing regions. In addition, consumer interest in physiological activity and antioxidant efficacy in aronia cultivation area is increasing. At point where Korea cultivation of aronia is rapidly increasing, we wanted to compare bioactive contents and antioxidant activities of Korea and Polish aronia, which accounts for more than 80% of the global market. In this study, we compared the contents of bioactive substances and antioxidant activities of three aronia plants cultivated in three different regions of Korea, and three aronia powders imported from Poland. These results were intended to be used as basic data for making functional products by adding aronia, in the future.
Materials and methods
Folin-Ciocalteu’s phenol reagent, catechin, gallic acid, 2,2-diphenyl-1-picrylhydrazyl (DPPH) radical, Tris-HCl, 2,2’-azino-bis-3-ethylbenzothiazoline-6-sulfonic acid (ABTS), nicotinamide adenine dinucleotide (NADH), and p-methyl styrene (PMS) were purchased from Sigma Chemicals (St. Louis, MO, USA). Anthocyanin and polyphenol standards for high performance liquid chromatography analysis were purchased from Extrasynthese (Genay, France) and Sigma Chemicals, respectively. HPLC grade water, methanol, acetonitrile, and trifluoroacetic acid (TFA) were purchased from Fisher Scientific Inc. (Fair Lawn, NJ, USA). All chemicals used were of analytical grade.
Three sets of freeze-dried powder made from whole aronia (A. melanocarpa), with the skin and seeds of the Nero varieties harvested in 2017 in Korea and Poland, were purchased from a local market. Each freeze-dried powder was extracted with 25 times volume of water or 80% ethanol. Water extraction was performed at 25 and 80°C, and 80% ethanol extraction was performed at 25 and 80°C for 2 h to compare antioxidants and antioxidant effects according to extraction solvent and extraction temperature. Then, the samples were extracted by filtering the mixture through a Whatman #2 filter paper (Whatman International Ltd., Maidstone, UK) with a vacuum filter; this process was repeated three times. The extracted filtrate was then evaporated using a rotary evaporator (EYELA, Tokyo, Japan) under reduced pressure, at 40°C. The extracts were freeze-dried in a freeze-drier (Ilshin, Seoul, Korea), finely ground with a cooled mortar and pestle to a particle size < 1.0 mm, and kept in air-tight plastic bags at −20°C until analysis.
For determination of total polyphenol content, the FolinCiocalteu’s phenol reagent was used (Waterhouse, 2002). Briefly, 200 μL of the appropriately diluted sample was mixed with 400 μL of 2% 2 N-Folin-Ciocalteu’s phenol reagent. After 3 min at room temperature (RT), 800 μL of 10% Na2CO3 was added and mixed. Next, the mixture was kept in the dark by covering with aluminum foil at RT for 1 h. After vortexing, the absorbance was measured at 750 nm using a microplate reader (Infinite M200 Pro, Tecan Group Ltd., San Jose, CA, USA). Gallic acid was used as a calibration standard, and the results were expressed as gallic acid equivalents (GAE) per gram dry weight (mg GAE/g).
The total flavonoid content of the ethanolic extract of aronia was measured using the method described by Woisky and Salatino (1998) with slight modifications. Briefly, 500 μL of the sample was mixed with 30 μL 5% NaNO2 and allowed to react for 6 min at RT. Next, 60 μL 10% AlCl3·6H2O was added, and the mixture was continuously mixed at RT for 6 min followed by the addition of 200 μL of 1.0 M NaOH. Finally, 110 μL distilled water was added and mixed. The absorbance of the colored flavonoid-aluminum complex was measured immediately at 510 nm using a microplate reader. Catechin was used as a calibration standard, and the results were expressed as catechin equivalents (CE) per gram dry weight (mg CE/g).
Powdered samples (100 mg) were weighed; 5 mL methanol containing 0.1% formic acid was added to the mixture, followed by vortex mixing for 1 min. The mixture was centrifuged for 5 min, and the top layer was transferred to another glass tube. The aqueous layer was extracted with another 5 mL of methanol containing 0.1% formic acid. The extraction was performed 3-4 times until aronia extracts were colorless. The methanolic fractions were combined and evaporated to dryness in a rotary evaporator (EYELA, Tokyo, Japan). The residue was dissolved again in extraction solvent obtaining an appropriate concentration for HPLC analysis, and a 10 μL volume was injected. The anthocyanins were separated using a C18 Zorbox SB column (4.6×250 mm, 5 mm particle size, Agilent Technologies Inc., Santa Clara, CA, USA).
The solvent system employed was (A) water with 5% formic acid and (B) acetonitrile with 5% formic acid. The samples were separated according to the following gradient: A/B=95/5 (0-5 min), 90/10 (8 min), 85/15 (13-18 min), 80/20 (25 min), 70/30 (28-32 min), 95/5 (35-40 min) at a flow rate of 0.8 mL/min. The peaks were detected using a UV detector at 520 nm (Waters Co., Milford, MA, USA).
The DPPH radical scavenging activity of 80% ethanolic extract of aronia was determined using the method described by Cheung et al. (2003), with slight modifications. First, 192 μL solution of 50 μM DPPH was mixed with 48 μL diluted sample in a 4:1 (v/v) ratio. After leaving the mixture in the dark, covered with aluminum foil at room temperature for 30 min, a control consisting of 48 μL distilled water in 192 μL of 50 μM DPPH, or 48 μL of 94% ethanol in 192 μL of 50 μM DPPH was used for the samples. The decolorization of DPPH was read at 517 nm using a microplate reader. The DPPH radical scavenging activity was calculated according to the following equation:
Where, Acontrol is the absorbance of the control reaction (containing all reagents except for the test compound) and Asample is the absorbance of the test compound.
The ABTS radical scavenging activity of aronia extract was determined using the method described by Re et al. (1999), with slight modifications. First, ABTS was dissolved in distilled water to obtain a 7 mM concentration. The ABTS radical cation was produced by reacting the ABTS stock solution with 2.45 mM K2S2O8 (at a ratio of 2:1) in the dark, covered with aluminum foil for 24 h before use. The ABTS reagent was diluted with 94% ethanol to obtain an appropriate absorbance (0.17±0.03), which was measured at 734 nm. Then, 950 μL of the ABTS reagent was mixed with 50 μL of several concentrations of the tested samples. After leaving the mixture in the dark, covered with aluminum foil at room temperature for 10 min, the absorbance at 734 nm was measured using a microplate reader. Each sample was measured in triplicate, and the percentage (%) inhibition was calculated using the following equation:
Where, Acontrol is the absorbance of the control reaction (containing all reagents except for the test compound) and Asample is the absorbance of the test compound.
The Fe3+ reducing power of the extracts was determined using the method of Oyaizu (1986) with slight modification. Various concentrations of the samples (0.25 mL) were mixed with 0.25 mL of phosphate buffer (0.2 M, pH 6.6) and 0.25 mL of potassium hexacyanoferrate (III) [K3Fe(CN)6, 1% (w/v)]. The mixture was incubated at 50°C in water bath for 20 min, and the reaction was stopped by adding 0.25 mL of trichloroacetic acid (TCA) solution (10%, w/v); the mixture was centrifuged at 3,000 rpm for 10 min. The supernatant (0.5 mL) was mixed with 0.5 mL of distilled water and 0.1 mL of ferric chloride (FeCl3) solution (0.1%, w/v) for 10 min. The reducing power was determined by measuring the absorbance at 700 nm with a microplate reader (Infinite M200 Pro, Tecan Group Ltd., San Jose, CA, USA).
All the results are presented as means±SD. Statistical analyses were performed using the statistical analysis system, Statistical Package for the Social Sciences (SPSS Inc., Chicago, IL, USA). Data were compared using one-way analysis of variance; p<0.05 was considered significant.

Results and discussion
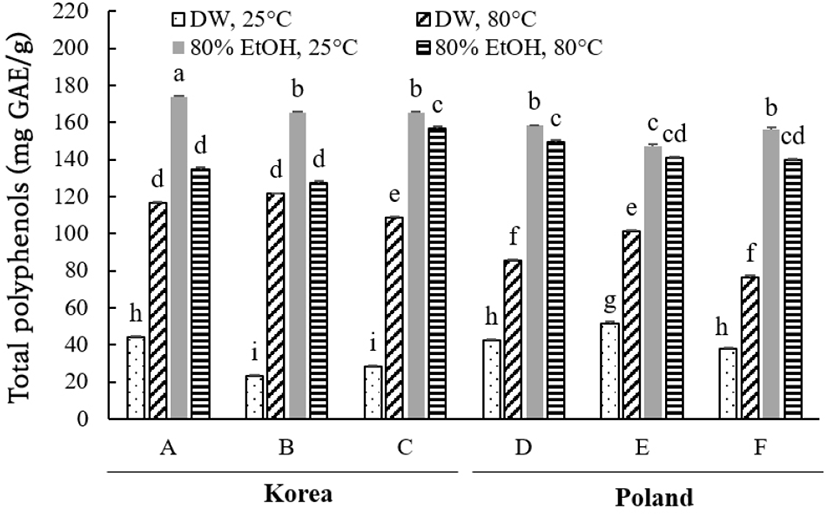
The total phenolic contents of aronia grown in different countries are presented in Fig. 1. In all six samples, the total polyphenol content was higher in the 80% ethanol extract than in the water extract, and the optimum extraction temperature varied, depending on the extraction solvent. In case of water extraction, the total polyphenol content of the sample extracted at 80°C was higher than that of the sample extracted at 25°C. In the water extract extracted at 25°C, the Korean aronia showed a total polyphenol content of 22.95-44.16 mg GAE/g dry weight, while Polish aronia showed a polyphenol content of 37.97-51.53 mg GAE/g dry weight, under the same conditions. In the water extract extracted at 80°C, Korean aronia showed a total polyphenol content of 108.13-121.61 mg GAE/g dry weight, and Polish aronia had a polyphenol content of 85.23-101.25 mg GAE/g dry weight under the same conditions. In the 80% ethanol extracted at 25°C, Korean aronia showed a total polyphenol content of 165.13-173.54 mg GAE/g dry weight, while Polish aronia showed a polyphenol content of 145.23-158.31 mg GAE/g dry weight, under the same conditions. In 80% ethanol extracted at 80°C, the Korean aronia showed a total polyphenol content of 127.45-156.81 mg GAE/g dry weight, while Polish aronia showed a polyphenol content of 139.66-149.38 mg GAE/g dry weight, under the same conditions.
These results show that the Korean aronia has a total polyphenol content similar to that of Poland aronia. The difference in total polyphenol content is believed to depend on the extraction solvent or extraction temperature rather than the aronia growing region. Aronia is composed of various polyphenolic compounds such as phenolic acid and quercetin derivatives (Oszmianski and Wojdylo, 2005), and in particular, polyphenols are known to be associated with antioxidant activity (Bolling et al., 2015). The polyphenolic compounds contained in aronia differ based on the variety, origin, plantation, harvest time, etc., and the content is considered to be different depending on the pretreatment process such as extraction solvent, time and method of the lyophilized powder sample (Jeon et al., 2018; Takashi, 1983).

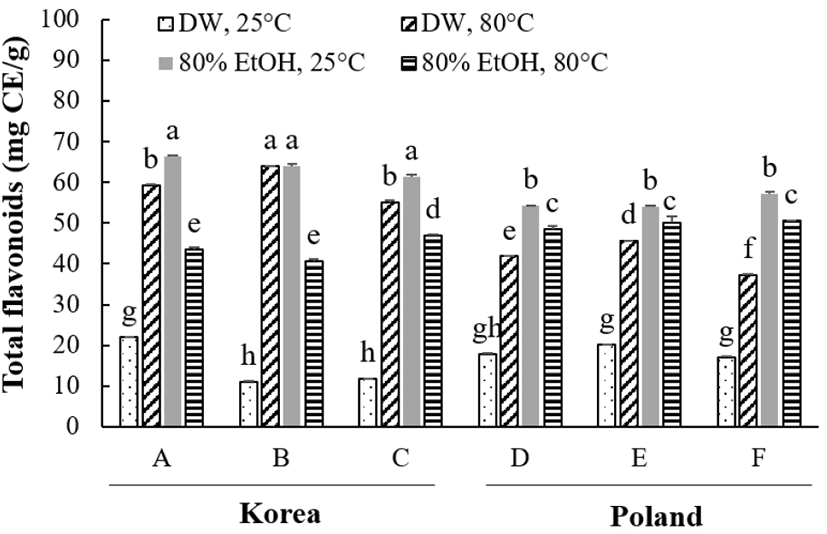
The total flavonoid contents of aronia grown in different countries are presented in Fig. 2. By measuring the total flavonoid content of the six samples, the total flavonoid content was found to be higher in the 80% ethanol extract than in the water extract. The total flavonoid content according to the extraction solvent and extraction temperature was higher in order of 25°C, distilled water < 80°C, distilled water < 80°C, 80% ethanol < 25°C, 80% ethanol extract. The total polyphenol content of aronia water extract was 10.91-22.02 mg CE/g dry weight of Korean aronia when extracted at 25°C and 16.93-20.11 mg CE/g dry weight of aronia from Poland. The water extracted at 80°C showed 55.06-63.91 mg CE/g dry weight of total flavonoid content per gram of Korean aronia and flavonoids of 37.19-45.65 mg CE/g dry weight, under the same conditions. In 80% ethanol extracted at 25°C, Korean aronia showed a total flavonoid content of 61.37-66.35 mg CE/g dry weight, while Polish aronia showed a total flavonoid content of 54.05-57.28 mg CE/g dry weight, under the same conditions. In the 80% ethanol extracted at 80°C, Korean aronia showed a total flavonoid content of 40.67-46.98 mg CE/g dry weight, while Polish aronia showed a polyphenol content of 48.57-50.50 mg CE/g dry weight, under the same conditions. The results showed that Korean aronia has total flavonoid content similar to that of Polish aronia.

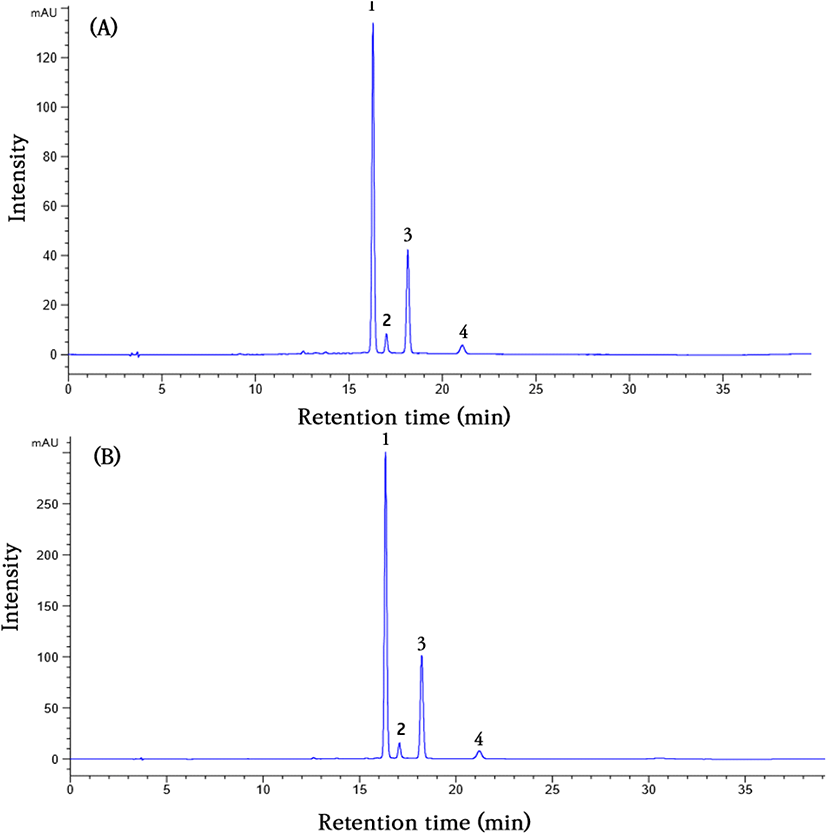
Fig. 3 shows a chromatogram to analyze anthocyanins in freeze-dried aronia powder, obtained by injection into HPLC after extraction with water and 80% ethanol. HPLC analysis identified four anthocyanin substances of cyanidin-3-Ogalactoside, cyanidin-3-O-glucoside, cyanidin-3-O-arabinose, and cyanidin-3-O-xylose, and their retention times were 16.4, 17.1, 18.2, and 21.3 min, respectively. Cyanidin-3-Ogalactoside was the major anthocyanin followed by cyanidin3-O-arabinoside, cyanidin-3-O-glucoside, and cyanidin-3O-xylose.
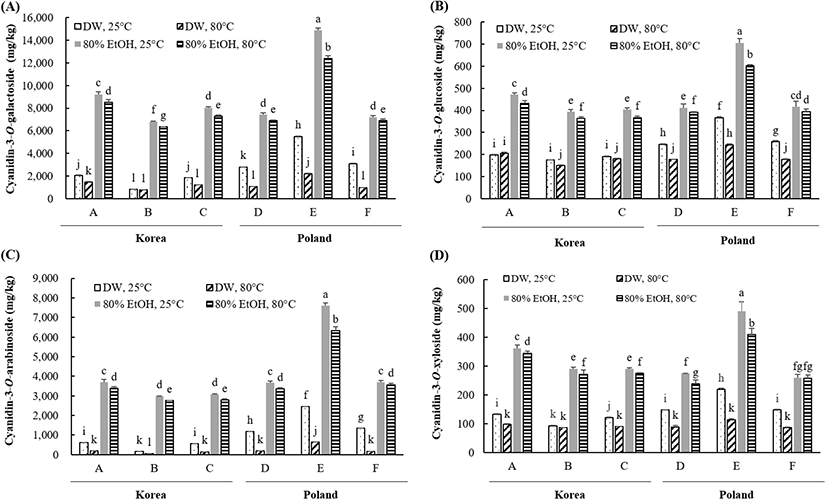
Fig. 4 shows the results of anthocyanin content analysis using HPLC, from aronia water or 80% ethanol extract. Extraction at 25°C in 4 different anthocyanin compounds, water and 80% ethanol extract showed higher anthocyanin content than that extracted at 80°C. Overall, the anthocyanin content of sample E, which was from Poland, was the highest, and the anthocyanin content of sample B, which was Korean, was low. In case of cyanidin-3-O-galactoside, the highest content of E (14,869.98 mg) among the six samples, A (9,217.16 mg) and C (8,043.24 mg). Sample E showed about 2.3 times higher cyanidin-3-O-galactoside than sample B. In cyanidin-3-O-glucoside, sample E showed highest content of cyanidin-3-O-glucoside, which was 706.39 mg, among the six samples, and followed by A (441.93 mg), F (416.50 mg), D (412.52 mg), C (402.92 mg), and B (393.24 mg). The anthocyanin content in the other five samples showed a similar tendency except for sample E, which had the highest anthocyanin content, in the 80% ethanol extract.

Anthocyanins are high in purple fruits and vegetables, especially berries, including aronia. Anthocyanins contained in aronia exist in the form of glycosides combined with cyanidin, and in aronia, four anthocyanins such as cyanidin-3-O-galactoside, cyanidin-3-O-glucoside, cyanidin3-O-arabinoside, and cyanidin-3-O-xyloside are found. This is similar to the results of previous researches (Hwang and Thi, 2018; Jakobek et al., 2012; Slimestad et al., 2012). The content of anthocyanin in aronia is thought to be influenced by the country of origin, variety, soil environment and timing (Jeon et al., 2018). Anthocyanins in fruits are reported to promote biosynthesis due to the effects of mineral quality, temperature, and moisture (Liu et al., 2013; Ubi et al., 2006). It also reported that the anthocyanin content of grapes increased as the amount of sunshine increased (Spayd et al., 2002).
Table 1 shows the results of DPPH radical scavenging activity of six aronia powders grown in Korea or Poland after extraction with distilled water or 80% ethanol at 25°C or 80°C. The DPPH radical scavenging activity of all of the samples increased in a concentration-dependent manner (50-400 μg/mL). At the same concentration, 80% ethanol extract displayed higher DPPH radical scavenging activity than water extract. In the aronia water extract, the DPPH radical scavenging activity of the sample extracted at 80°C was higher than that of the 25°C extract at the same concentration. In 80% ethanol extract, DPPH radical scavenging activity of the sample extracted at 80°C was higher than 25°C. The average inhibition of the DPPH radical scavenging activity of 400 μg/mL aronia A extracted with water at 80°C was 72.01%, whereas an average inhibition of 48.90% was obtained for the same sample extracted at 25°C. The 80% ethanol extracts showed higher DPPH radical scavenging activities compared to water extraction. Sample F at 400 ppm extracted with water, showed 39.30% DPPH radical inhibition but 70.12% inhibition in 80% ethanol extraction. Regardless of the cultivation area of aronia, the six aronia samples extracted at 80°C showed 70% or more DPPH radical scavenging activity at 400 ppm, and no difference in extraction solvent whether water or 80% ethanol was observed.
Table 2 shows the results of ABTS radical scavenging activity of each of the six aronia powders grown in Korea or Poland after extraction with water or 80% ethanol at different temperatures. Similar to the DPPH radical scavenging activity, ABTS radical scavenging activity of all of the samples increased in a concentration-dependent manner (50-400 μg/mL). At the same concentration, 80% ethanol extract showed higher ABTS radical scavenging activity than water extract. In the aronia water extract, the ABTS radical scavenging activity of the sample extracted at 80°C was higher than the 25°C extract at the same concentration. In 80% ethanol extract, up to 200 ppm ABTS radical scavenging activity of the sample extracted at 80°C was higher than 25°C, but at 400 ppm the ABTS radical scavenging activity was not significantly changed with temperature.
The average inhibition of the ABTS radical scavenging activity of aronia A (400 μg/mL) extracted with water at 80°C was 73.35%, whereas an average inhibition of 43.67% was obtained for the same sample extracted at 25°C. Aronia extracted with 80% ethanol at 50-200 μg/mL showed higher ABTS radical scavenging activity as compared to water extraction. However, in 80% ethanol extract of aronia (400 μg/mL), the ABTS radical scavenging activity showed no difference with temperature. That is, the ABTS radical scavenging activity of the 80% ethanol extracted at 25°C or 80°C showed almost the same degree. At 400 μg/mL concentration, sample F extracted with water showed 75.41% ABTS radical inhibition, but 75.31% inhibition in 80% ethanol extraction. Regardless of the cultivation area of aronia, the six aronia samples showed almost the same ABTS radical scavenging activity of 70% or more at 400 μg/mL, and no difference in extraction solvent was observed.
Table 3 shows the reducing power based on the extraction solvent and the extraction temperature of aronia powder cultivated in Korea or Poland. The higher the absorbance measured at 700 nm, the higher the reducing power. Similar to DPPH or ABTS radical scavenging activity, the reducing power was higher in the 80°C extract than in the 25°C extract, and the reducing power was higher in the 80% ethanol extract than in the water extract. In case of 50 μg/mL of aronia extract, the absorbance of sample C extracted at 25°C with distilled water was the lowest at 0.0606, and the absorbance of Sample E was the highest at 0.0821. When the same sample was extracted at 80°C, the absorbance was higher than that of the 25°C extract. Reducing power displayed a pattern increasing with concentration. That is, in case of sample A, grown in Korea and extracted with 80% ethanol at 80°C, the reducing power was increased by 1.78, 2.44, and 4.32 times at concentrations of 100, 200, and 400 μg/mL as compared to 50 μg/mL. The reducing power showed a pattern increasing with concentration. In other words, the sample E grown in Poland extracted with 80% ethanol at 80°C increased the reducing power by 1.46, 2.25, and 4.00 times at concentrations of 100, 200, and 400 μg/mL compared to 50 μg/mL.
Similar to the results of this study, the total polyphenol and flavonoid content of aronia in the study of Hong and Hong (2015) in water and 70% ethanol extract was much higher in 70% ethanol extract than water extract. DPPH and ABTS radical scavenging activities were increased based on the concentration in water and 70% ethanol extract, and the functional content and antioxidant activity of aronia were 70% more effective than water extraction. It was confirmed that the antioxidative activity of Korea aronia and Polish aronia was similar or slightly higher than that of Poland.
In conclusion, the content of bioactive substances and antioxidant activity of three types of aronia grown in three Korea regions and three types of powdered aronia imported from Poland were compared. The total polyphenol content was higher in 80% ethanol extracts than in water extracts, in the 6 samples from Korea and Poland. The total polyphenol content of the sample extracted at 25°C was higher than that of 80°C. The total flavonoid content according to the solvent and extraction temperature was higher in order: 25°C distilled water < 80°C, distilled water < 80°C, 80% ethanol < 25°C, 80% ethanol extract. HPLC analysis identified four anthocyanin substances i.e. cyanidin-3-O-galactoside, cyanidin-3-O-glucoside, cyanidin-3O-arabinoside, and cyanidin-3-O-xyloside. The anthocyanin content in the other five samples showed a similar tendency except for sample E, which had the highest anthocyanin content in the 80% ethanol extract. The 80% ethanol extract showed higher antioxidant activity than water extract and in the aronia water extract, the antioxidant activity of the sample extracted at 80°C was higher than that of the 25°C extract at the same concentration. It was confirmed that the antioxidative activity of Korea aronia and Polish aronia was similar or slightly higher in the Korea aronia.
