Introduction
Fresh agricultural products (for example, processed vegetables, fruit, and mushrooms) are important for human health and attract consumers looking for healthy diets (Ncama et al., 2018). The market of fresh agricultural products has grown rapidly with the increasing interest in promoting general well-being, health, and quality of life (Choi et al., 2019). Post-harvest management technology has become the most important industry related to fresh produce and improves farmers’ livelihoods by increasing profits (Choi et al., 2019; Florez-Lopez et al., 2016). Post-harvest management technology has become a priority in many countries, as it contributes to food security and pricing (Cen et al., 2016). The increasing use of fresh agricultural products in various food commodities demands new technological approaches to improve its distribution and marketing efficiency (Baselice et al., 2017; Murray et al., 2017). Therefore, for effective intervention strategies for post-harvest management technology, it is important to determine the critical parameters determining the competitiveness of fresh agricultural products in the market. Fresh agricultural products-related intellectual property can be protected through the patent system, enabling industries and governments to protect strategic technologies (Kyebambe et al., 2017). Various patent indices for new industry-related technology are used to evaluate specific technology levels, research trends, and international competitiveness (Kim et al., 2012; Yoon et al., 2012).
In Korea, investment in new post-harvest management technology for fresh agricultural products has stagnated (Choe and Kim, 2015), although the global market for fresh agricultural products has been increasing (Droby et al., 2019). To remain competitive in the global market of fresh agricultural products, the Korean government supports the domestic fresh produce industry (Yun, 2014). Recently, a post-harvest technology (a fumigation treatment using both carbon dioxide and gaseous chlorine dioxide) was improved and applied in strawberries for export (RDA, 2018). The post-harvest management technology trends and patent prospects related to fresh produce are unclear, despite recent reviews of patent prospects for various post-harvest management technology sectors (Droby et al., 2019; Rolle, 2006; Wisniewski et al., 2016).
The current study analyzes the patent trends related to post-harvest management technology for fresh agricultural products using patent indices with multi-layer modeling, and technology categories. This prediction of future trends in patent technologies can help governments determine development strategies and research of post-harvest management technologies for rapidly expanding markets.
Materials and methods
Patents related to fresh agricultural products registered in Korea, China, the European Union (EU), Japan, and the United States were collected. The post-harvest management technology patents related to fresh agricultural products (processed vegetables, fruit, and mushrooms) issued from January 1998 until December 2019 were collected using a worldwide intellectual property service. The EU collects patents from its 19 member states (or nations), all of which are members of the European Patent Convention (WIPS, 2020).
The collected patents were verified in four steps to remove noise from the initial data. First, 35,467 patents were collected from patent registries using keywords based on post-harvest management technology for fresh agricultural products. Then, redundant patents were removed based on the application numbers and patent titles. In addition, patents for the period 2018-2019 were removed, because patents are closed for 18 months after patent registration. Next, duplicate patents were manually removed based on the patent abstracts using country-specific patent search systems for China (SIPO, 2020), Japan (JPO, 2020), and Korea (KIPRIS, 2020). Finally, the specifications and scope of the patents were analyzed and verified with post-harvest management technology experts. The final, verified dataset included 1,517 effective patents for two technology categories and eight subcategories (Table 1).
Statistical significance with Duncan’s multiple range test.
The patent portfolio (PP) index is a trend distribution used to evaluate the growth stage of technology sectors (Lin et al., 2006). The PP index was calculated for each of the eight categories for four time intervals 1998-2002, 2003-2007, 2008-2012, and 2013-2017. The PP index for the period 2018-2019 could not be computed, because patents are kept closed for 18 months after registration. The PP index was obtained using Equation (1):
where c is the post-harvest management technology category, k is the period interval, TPi is the total number (n) of patents (i), and TAj is the total number (m) of patent applicants (j).
The emerging trend of patents shows the development potential of patents in a technology category (KIPI, 2005). The emerging trend can be estimated using the patent increase (PI) and patent sharing (PS) indices to evaluate the level of technology development for the different postharvest management technology categories. The PI index was calculated using Equation (2):
where k is the year and TPk is the number of patents in a standard year.
The PS index was calculated using Equation (3):
where cs is the post-harvest management technology subcategory, TSj is the total number (m) of patents in a specific category (j), and TPi is the total number (n) of patents in all categories (i).
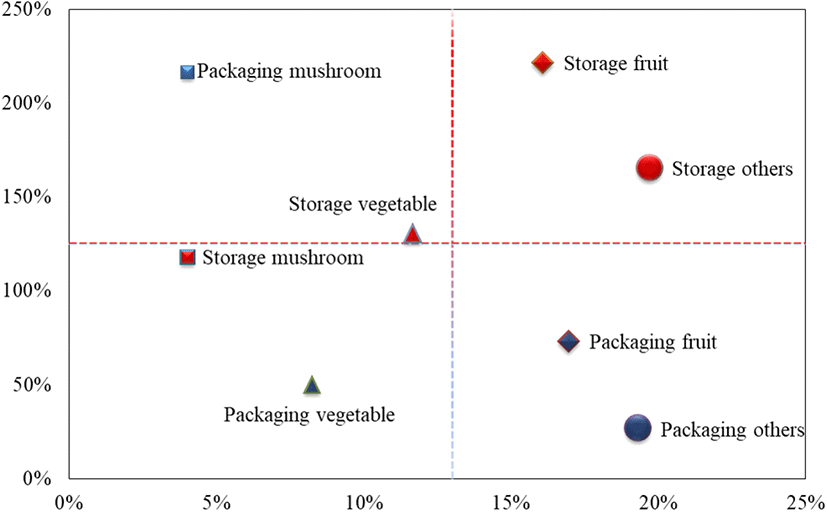
The average values of PS and PI were then calculated. These complex values are easily visualized in a scatter-plot, with the four quadrants of the plot indicating the different levels of technological development: upper right, continuous application; upper left, increase in recent applications; lower left, applications in infancy; and lower right, decrease in recent applications.
The technology cycle time (TCT) is a measure of the qualitative aspects of a patent technology (Kyebambe et al., 2017). It measures how fast the technology in a given area changes; a small value of TCT indicates rapidly changing technology within an area (Park et al., 2006).
A TCT model that estimates technology growth potential is based on three factors: PI, PS, and the market power ratio (MP). These three factors were quantified using Likert scales with five ordinal levels (Sullivan and Artino, 2013). The TCT model was obtained from Equation (4):
where (PI + PS + MP) are the values of PI, PS, and MP for 5-year intervals (k).
The value of MP used in the TCT model was calculated using Equation (5):
where k is the year, TPk is the number of patents in a standard year (k), and FPk is the number of foreign patent applicants in a standard year (k).
SAS/STAT ver. 12.1 software (SAS Korea, Seoul, Korea) was used for statistical analyses. A one-way analysis of variance (ANOVA) was performed with Duncan’s multiple range test to determine the effect of the year, country, and technology factors based on valid patent. For all statistical analyses, a significance level of 0.05 was used.
Results and discussion
A total of 1,517 valid patents were collected for the post-harvest management technology sector for fresh agricultural products issued from January 1998 to December 2017, including 525 (34.6%) from Japan, 392 (25.8%) from China, and 368 (24.3%) from Korea. The numbers of patent registrations varied until 2010, and then increased due to the rapid increase in Chinese applications (Table 2). China, Japan, and Korea were the countries with major applicants.
Statistical significance with Duncan’s multiple range test.
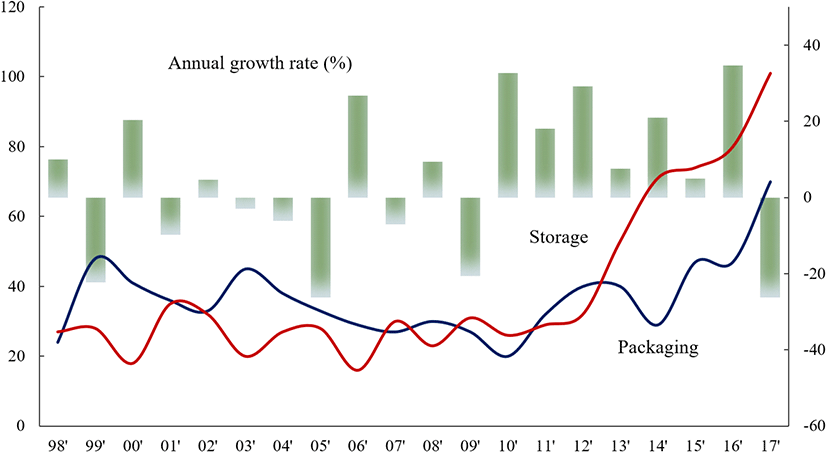
The patent growth in China coincided with Chinese government policy to enhance the competitiveness of their fresh agricultural products (Rolle, 2006). The packaging and storage technology categories showed similar patterns. Packaging and storage are important aspects for post-harvest handling of fresh agricultural products (Lee et al., 2018). In each category, the packaging sector showed little variation in the number of registrations, while the number of registrations in the storage sector increased rapidly after 2013 (Fig. 1). Overall post-harvest management technologies, and particularly fruit storage technologies, have shown an explosive increase in patent applications since 2013. This increase coincides with an increase in the overall size of the Chinese agricultural market (Sheng et al., 2019).
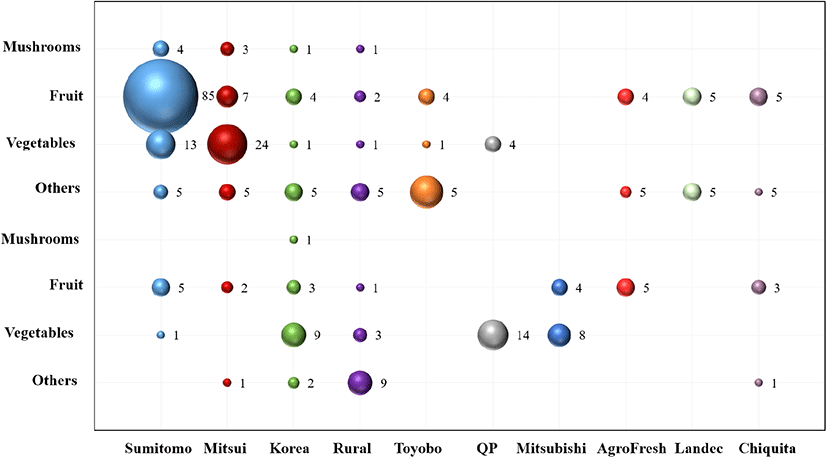
A patent distribution map is used to synthesize patent information, including patent counts, national contributions, and patent applicants. Eight of the top 10 applicants for post-harvest management technology-related patents were companies from Japan and USA, with only two Korean institutes on the list (RDA and KFRI). In each product category, Japan had the most applications, followed by Korea (Table 3). Japan’s 34.6% patent share is presumed to arise from the simplified patent specification process for fresh agricultural products (Ryu, 2016). In Korea, major patent applicants are the Rural Development Administration of South Korea (RDA) and Korea Food Research Institute (KFRI). All the other main applicants are multi-national companies. Sumitomo Bakelite Co. Ltd. Group was the top applicant and had the most patents for fruit in the packaging category (Fig. 2). Internationally, post-harvest management technology for fresh agricultural products has been developed by multi-national companies. Therefore, the Korean government needs to support technology development by companies via international policy, such as increasing the export of agricultural products.
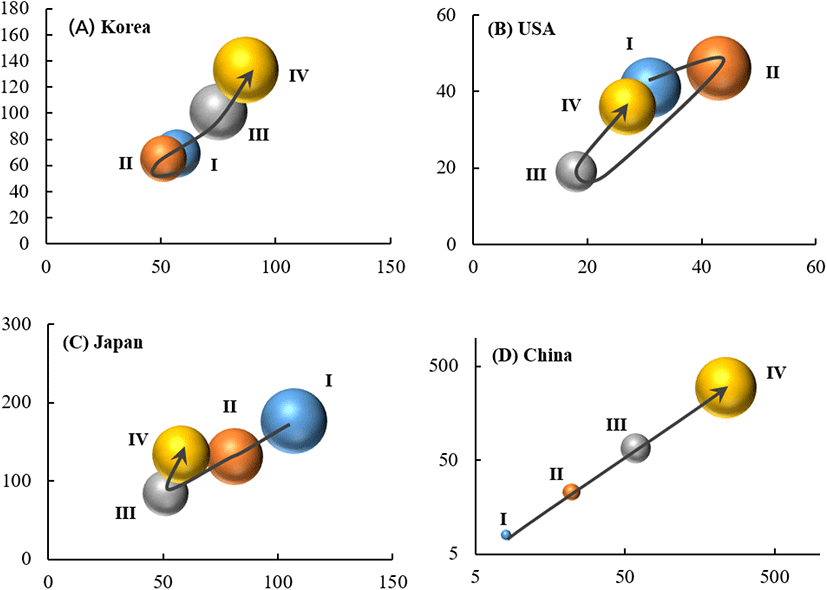
The growth of post-harvest management technology has been classified into five developmental stages: beginning, growth, maturity, decline, and recovery (Choi et al., 2019). The PP index showed that post-harvest management technology as a whole is in the growth stage because the numbers of patents and applicants increased continually, although they decreased in some countries in the early period (1998-2002). Post-harvest management technology is at a mature stage of development, largely because of the rapid increase in the number of patents registered after 2013 in China. Korea, the USA, and Japan are in the recovery stage in the numbers of both patents and applicants, although the numbers of applicants and applications have recently increased rapidly. The EU technology stage could not be determined because of the small number of patents registered there (Fig. 3). The number of patents in Korea increased markedly in the period 2008-2017. The development of packaging and storage technology is increasing rapidly because of the Korean government’s policy to increas the export of agricultural products (RDA, 2018). China is in a growth stage, as the numbers of applicants and applications have increased rapidly from 2003. The rapid increase in patents indicates that it was the closest to a completely free competitive market, meaning that it is less complicated to enter the post-harvest management technology market in China, compared with other countries (Rolle, 2006; Sheng et al., 2019). Regarding the technology position for the two categories, packaging technology is in the recovery stage, and applicants/applications in storage technology continue to grow. For the different subcategories, the growth pattern of fruit technology is in the recovery stage of development, reflected by a continuous increase in the numbers of patents registered during all periods except the initial period (1998-2002) (Fig. 4).
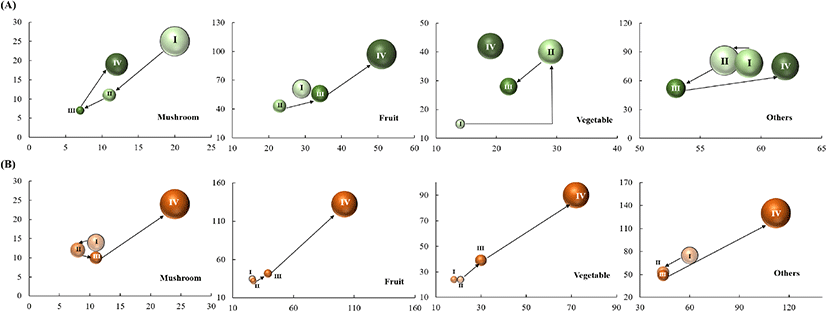
The technology growth of post-harvest patents can be estimated using the PI and PS indices. Storage technology has high market competitiveness and a relatively low technology level, whereas packaging technology has low market competitiveness despite a high technology level. Regarding storage category, the patent indices showed an increase in applications for fruit and other technologies, and a decrease in applications for mushroom and vegetable technologies. For the packaging category, there was an increase in recent applications for mushroom technology, vegetable technology was in the infancy stage, and there were decreases in applications for fruit and other technologies (Fig. 5). Although fruit and other technologies in the packaging category show decreasing trends, related technology should have high development potential due to the increase in the use of agricultural products to promote well-being (Taghizadeh et al., 2010; Yun, 2014).
In terms of a patent development strategy for post-harvest management technology in Korea, the patent indices and technology cycle time (TCT) model can predict the developmental potential of specific technology categories. A TCT model was developed using three factors: the patent increase (PI), patent sharing (PS), and market power (MP) indices. This model can measure the development prospects within a specific technology category. The growth potential of post-harvest management technology was at the fourth highest of five levels because patent applications increased by 168.8%, the patent share ratio fell to 36.6%, and the market power increased 111.3%.
This means that developing post-harvest management technology for fresh agricultural products has high growth potential. In the future, the market of fresh agricultural products will grow continuously (RDA, 2018; Yun, 2014), and related patents are thought to have explosive growth trends, as shown by the high recent increase in patent applications (i.e., 168.8%) in China. The Chinese market is considered the most favorable for post-harvest patent development, because the market concentration and technology competitiveness there are low compared with other countries (Table 2, Fig. 2). This means that China is expected to take the lead in market pre-occupation by domestic companies and research institutes, and that it is easier to enter the Chinese market compared with other countries (Lee, 2018).
In recent years, the PI and PS indices indicated that storage technology has high development potential, whereas packaging technology has low development potential (Figs. 1 and 5). Patent development for fruit technologies in the packaging category has a high risk due to a decreasing market with many technologies. However, new vegetable technologies may develop because this is a beginning market. The patent indices also suggest that mushroom technology will increase in the future with the rapidly growing international agriculture market (Fig. 5).
In Korea, post-harvest management technology is a source business that greatly influences the agricultural industry via the production of high-value materials that complement shortcomings in the long-term distribution of fresh agricultural products. The development of patents for fresh agricultural products is expected to increase because of increased demand for healthy foods (Choi et al., 2019; Yun, 2014). The current study predicts the future trends in post-harvest management technology for fresh agricultural products using multi-layer patent indices. This study provides information that can be used to estimate patent competitiveness and devise development strategies for rapidly expanding international global markets for fresh agricultural products.
