
서 론
커피는 남·북위 25° 사이에 있는 커피벨트(coffee belt)에서 상업적인 재배가 이루어지고 있다(1). 우리나라 위도는 33-43°로 커피 재배가 힘든 기후특성을 지니고 있어 전라남도 고흥, 제주도 등지에서 비닐하우스를 이용한 재배가 이루어지고 있다. 고흥 커피는 고흥군이 2011년 시험재배에 성공한 이후 지역 특화작물로 육성하는 작물이다. 고흥군의 커피사업단 조성에 힘입어 2.4 ha에서 13만여주의 커피를 생산해 전국 생산량(전국 커피재재 면적 7.4 ha)의 32%를 차지하고 있다. 2019년 2월에는 농림축산식품부의 향토산업육성산업에 커피가 선정되어 2022년까지 4년간 30억의 지원을 받는 등 고흥 커피는 국내 커피 주산지로 자리매김하며, 향후 6차 융복합산업으로의 발전을 꾀하고 있다. 고흥군청 경제 유통과의 자료에 의하면 2018년 8월 기준으로 고흥 커피 재배현황은 14농가에서 49,920주를 재배하고 있으며 커피체리 생산량은 2,998 kg이다. 고흥 커피는 한국산 커피라는 희소성과 함께 융복합산업으로의 발전 가능성이 있지만 고흥 커피의 특성에 관한 연구는 전무한 실정이다.
커피의 향기는 커피의 특성을 나타내는 가장 중요한 요소이다(2). 커피의 향기는 커피의 품질을 평가하는데 가장 중요한 요소일 뿐 만이 아니라 소비자의 선택을 결정하는 주요한 측면이다(3). 커피의 향은 품종, 수확방식과 가공방식, 원산지 및 생장환경 요인에 영향을 받는다(4). 또한, 커피 수확 후 가공방식 특히 로스팅 온도와 시간과 추출방식에 따라서 달라진다(5). 특히, 원산지는 커피의 향과 품질에 가장 크게 영향을 주는 요인이다.
현재까지 전자코를 이용한 커피 향기 연구에는 direct injection headspace를 이용한 커피 원산지 분석(6), SPME-GC-MS(Solid Phase Micro Extraction-Gas Chromatograph-Mass Spectroscopy)를 이용한 아라비카 커피와 로부스타 커피의 향기 성분 분석(7), 로스팅 시간을 달리한 커피의 분류(8) 등이 있다.
커피 향기 특성에 따른 원산지 분류에 대한 국내 연구로는 GC-SAW(Gas Chromatograph-Surface Acoustic Wave) 전자코를 활용한 볶은 커피의 원산지 및 배합 커피의 상품별 분류(9), 커피원두의 배전강도에 따른 품질특성 및 향기성분에 대한 연구(10), 원두 종류에 따른 커피의 향기패턴 분석(11) 등이 있다.
GC-IMS(Gas Chromatograph-Ion Mobility Spectrometer)는 가스 크로마토그래피와 IMS (Ion Mobility Spectrometer)를 결합한 전자코로 높은 선택성과 우수한 감도 (low ppbv or ug/L range)를 지니고 있어 복잡한 매트릭스에 있는 휘발성 성분들도 잘 분리 검출될 뿐 아니라 매우 빠른 시간 내에 분석 결과를 얻을 수 있는 장점이 있다.
본 연구에서는 고흥 커피와 국내 커피시장에서 수입량이 큰 외국산커피 5종의 커피 향기 차이를 확인하여 고흥 커피만의 특성을 파악하고 이를 한국 커피산업 발전에 적용하기 위한 기초자료로 활용하고자 한다.
재료 및 방법
본 연구에서 원산지별 향기특성 분석을 위해 사용한 커피는 GSC International Co., Ltd.(Seoul, Korea) 에서 구입한 Arabica 종 Colombia Colombia SC 17/18 Tolima, Guatemala SHB Huehuetenango, BrazilNY2 FC 17/18 Cerrado, Ethiopia G1 Yirgacheffe Chelba 4종과 Coffea Canephora 종인 India Robusta Kaapi Royale 1종, 고흥커피사관학교, Goheung, Korea 에서 제공받은 Korean Goheung coffee 1종, 총 6종의 커피를 사용했고 각 커피의 특성은 Table 1과 같다.
커피생두는 반열풍방식 로스터인 R-101(FUJI ROYAL Co., Ltd., Osaka, Japan)을 사용하여 200℃의 온도에서 1 kg씩 투입하여 동일조건에서 총 3회 연속 배치하였다. 1차 크랙 이후 1분 30초간 휴지기를 거친 후 210℃에서 배출 및 냉각하였다. 로스팅에 소요된 총 시간은 10분으로 커피의 수율은 85%였다. 커피는 산화를 방지하기 위해 100 g씩 One-way valve 봉투(Softpack Co., Ltd., Seongnami, Korea)에 포장을 하여, 흡습제를 넣은 밀폐 박스에 넣어 15℃의 냉장고에 보관하였다. 시료의 분쇄는 커피 그라인더 (R300, FUJI ROYAL Co., Ltd., Osaka, Japan)을 사용하였다.
커피 원산지별 향기 분석은 GC-IMS (FlavourSpec®, mbH GAS CO., Ltd., Dortmund, Germany)로 실시하였다. 이 장비는 분리하지 않고 온도가 올라간 상태에서 시료를 headspace에 직접 주입할 수 있도록 고안된 설비이다. 재현성을 높이기 위해 자동화 sampler unit (CTC-PAL, CTC Analytics AG, Zwingen, Switzerland)를 연결하여 사용하였다. 시료 약 0.3 g을 20 mL headspace vial에 넣고 magnetic caps로 밀봉하여 70℃에서 20분간 conditioning을 실시한 후 headspace autosampler heated injector syringe(80℃)를 이용하여 100 μL를 GC-IMS에 주입하였다.
Carrier gas(N2)를 무극성 OV-5 MCC에 의해 분리가 잘 되도록 30℃로 가열된 MCC (Multiple capillary column, 20 cm length)관으로 통과시켰다. 분석은 IMS로 먼저 검출된 이온이 이온 쳄버 속에서 등온선법으로 분리를 하였다. 분자량에 대한 이온은 3H(Tritium, 100 MBq)로 만들어졌다. 이후에는 이온물질들이 shutter 막을 통해 이온지역으로 들어오며 drift region에서 faraday plate로 이동되어 각 성분에 대한 신호의 크기를 감지하고 측정하였다. Drift tube의 길이는 6 cm이고 60℃의 온도와 350 Vcm-1의 정전압을 공급하여 monomer, dimer 등으로 분리하였다. 데이터는 장비로 연결된 컴퓨터로 양이온을 얻었다. 각각의 스펙트럼은 평균 32개의 scan들로 구성되어 있으며 grid pulse 폭은 100 μs, 반복류은 21 ms, 샘플링 주파수는 150 kHz이다(Table 2).
연속적인 데이터 값은 IMS software LAV (version 2.2.1, GAS CO., Ltd., Dortmund, Germany)을 이용하여 얻었다. 내장된 통계프로그램은 Statistical Software (Dynamic PCA 1.0.7 from G.A.S. )를 사용하였으며, Library Search software (GCxIMS Library Search software)를 사용하여 성분을 확인하였다.
결과 및 고찰
일반적으로 향기성분은 다양한 요인에 의해 생성될 뿐 아니라 쉽게 휘발하고, 외부환경에 의해 변화가 빠르게 진행되므로 향기성분의 추출은 매우 중요한 단계이다. 성분을 추출하기 위해서는 증류법, 용매 추출법, 흡착제를 이용한 추출법 등이 있으며(12), 본 실험에서는 향기성분의 변화를 최소화하기 위하여 headspace법을 이용하여 향기성분을 추출 분석하였다. FlavourSpec®은 gas chromatograph- ion mobility spectrometer (GC-IMS)로 구성되어 있으며 공간부위에서 향기화합물이 바로 반응하도록 하여 휘발성유기화합물(VOCS)의 분석이 빠르고 쉽게 검출되도록 하는데 널리 이용된다.
커피는 로스팅 과정 중 maillard reaction, caramelization, 열분해 및 기타 화학 반응을 통하여 다양한 휘발성 성분들이 생성된다(13, 14). 특히, 로스팅 과정은 커피의 향 생성에 가장 큰 영향을 미치는 단계이다. 또한, 같은 생두라 할지라도 로스팅 단계에 따라 향을 이루는 구성 성분들은 달라지므로(14, 15), 본 연구에 사용된 커피 시료는 모두 동일한 조건으로 로스팅하여 향기성분을 분석하였다.
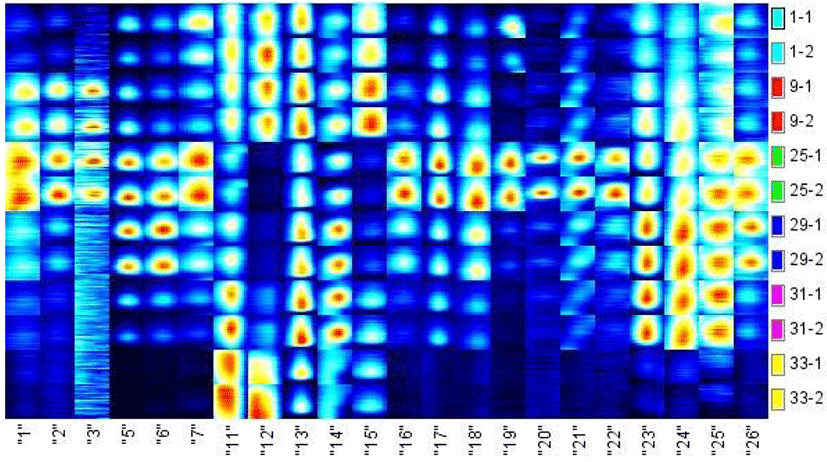
로스팅 후 분쇄한 커피 향을 GC-IMS 전자코를 이용하여 분석한 결과는 Fig. 1과 같다. Fig. 1은 커피 시료의 GC-IMS에서 검출된 3차원의 스펙트럼을 단면으로 잘라 2차원으로 표현 하였다. Fig. 1에서와 같이 커피의 원산지별로 나타난 peak들이 spot들로 표현되었으며, 각각의 성분들의 세기가 다르게 나타났다. 커피 시료는 y축 즉 오른쪽에 번호로 표시하였고, IMS에서 감지된 area spots은 x축 즉 아래쪽에 번호로 표시하였다. Fig. 1 에서와 같이 커피 시료는 원산지별로 IMS 스펙트럼이 다르게 나타났으며 스펙트럼상의 특이적인 spot들은 휘발성 성분의 특이성에 기인된 것이다. 로스팅 후 분쇄한 6종의 커피향은 IMS 스펙트럼상 뚜렷하게 구별되었다. 특히, 로브스타 커피(33번)는 아라비카 커피 5종에 비하여 spot 감도가 가장 적고 감도가 약하게 나타나 품종간의 구별도 뚜렷하게 보여주고 있을 뿐 아니라 향도 풍부하지 못함을 암시하여 주고 있다. 원산지가 다른 5종의 아라비카 커피의 IMS 스펙트럼도 뚜렷이 구별되었고 spot의 종류와 강도가 강하여 향이 풍부함을 암시해 주었다.
GC-IMS에서 얻어진 커피의 향기 성분에 대한 데이터를 주성분 분석한 결과는 Fig. 2와 같다. GC-IMS 전자코 시스템을 활용하여 얻은 데이터들을 주성분 분석(principal component analysis, PCA) 방법을 통하여 원산지별 커피 향기 성분의 특성을 분석하고, 원산지 판별의 기준으로 활용할 수 있는 가능성을 검토하고자 하였다. 주성분 분석은 다차원 특정 백터로 이루어진 데이터에 대하여 높은 차원에서의 정보를 유지하면서 낮은 차원으로 차원을 축소시키는 다변량 데이터 처리 방법 중의 하나이다.
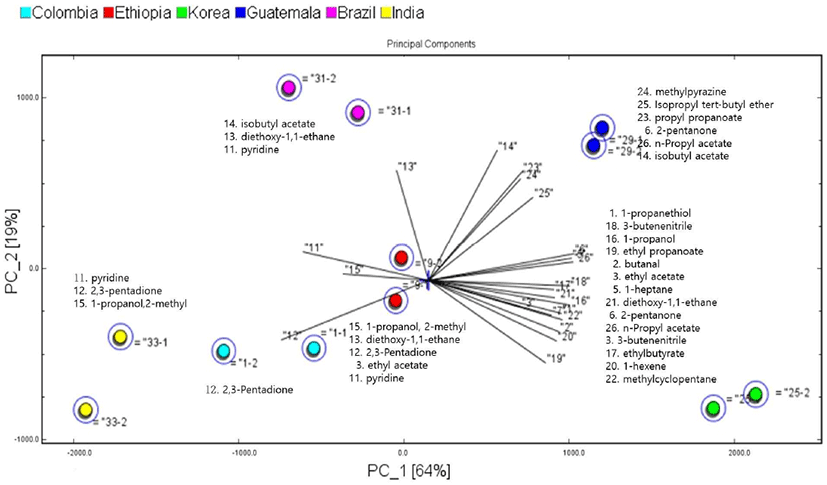
로스팅 후 분쇄한 커피 시료 6종에 대한 전자코를 이용하여 얻어진 주성분 분석 결과는 Table 3에서와 같이, PC 1의 기여율은 63.9%였고, PC 2의 기여율은 18.8% 이었으며 누적기여율은 82.7%, PC 3의 기여율은 9.5%로 누적 기여율은 92.2%이었다. 6종의 커피는 원산지별로 PC 1의 값만으로도 향기패턴 구분에 필요한 충분한 정보를 얻을 수 있었다. 로부스타(India) 1종과 아라비카 5종은 확실하게 PC1으로 구분이 되었을 뿐 아니라 구분이 어려웠던 5종의 아라비카종의 커피인 경우에도 PC1만으로 뚜렷하게 구별이 가능하였다. 아라비카 5종 중에서 한국은 4개의 원산지와는 멀리 떨어져 위치하여 구별되었으며, 로부스타인 인도와도 확연히 구별되었다. 아라비카종인 콜럼비아, 에티오피아는 PC1, PC2 상에서 가까이 위치하고 있었지만 구별이 되었다. 브라질은 콜럼비아와 에티오티아와 PC1 상에서는 비교적 가까이 위치해 있었지만 구별이 되었고, 과테말라는 PC1상에서 콜럼비아, 에티오피아, 브라질과 비교적 가까이 위치하였지만 구별되었고, PC2상에서는 브라질과 가까이 있었지만 확연히 구별되었다. 이상의 결과로 GC-IMS 전자코를 이용한 향기 패턴 인식 정보는 PCA를 활용하여 구별하기 어려웠던 아라비카종 커피의 원산지를 신속하게 판별이 가능하였다.
Aishima(16)의 아라비카 커피, 로부스타 커피, 동결건조 커피, 분무건조 커피간의 향미성분 차이분석 연구결과에서 로부스타와 아라비카 커피의 전자코에 의한 판별이 가능하다고 한 결과와 본 연구결과가 일치하였다. 현재까지 아라비카종에 대한 원산지 판별에 관한 전자코 정보는 PTR/SRI-MS(Proton Transfer Reaction/Switchable Reagent Ion system-mass spectrometry)를 이용한 원산지별 커피 향기 분석 연구(6), TD-GC-MS(Thermal Desorption-Gas Chromatograph-Mass Spectroscopy)를 이용한 원산지별 커피향기 분석 (17)에 대한 보고가 있으며 이들의 결과와 본 연구결과와도 일치하였다. 로부스타 커피와 아라비카 커피 품종에 따른 커피 향은 관능검사나 GC/MS만으로도 구별이 되었으나 시간이 오래 걸리는 반면, 전자코를 사용하면 매우 빠른 시간에 판별이 가능하다(18-22). 더욱이, 전자코를 활용하면 커피 품종간의 구분은 물론, 원산지별로 전자코 향기패턴이 다르게 나타났으므로, 원산지 및 품종이 다른 커피 향기에 대한 효율적인 구분이 가능할 것으로 전망된다.
원산지별로 특징적인 커피의 향기 성분에 대한 정보를 얻기 위하여 로스팅 후 분쇄한 커피 시료별로 GC-IMS 크로마토그램상에 나타난 peak들을 선택하여 library search software 를 사용하여 원산지별 커피의 향기 성분에 대한 상대적인 양(면적비)을 계산하여 Table 4에 나타내었다.
로스팅 후 분쇄한 6종의 커피 시료는 원산지별로 휘발성 화합물의 종류가 다르게 나타났다. 로스팅 후 분쇄한 6종의 커피시료에서 총 22종의 향기 성분이 검출되었으며, 검출된 개개의 성분의 화합물명과 성분이 나타내는 향의 특성을 Table 5에 나타내었다. 검출된 향기 성분들은 알코올, 에스테르, 알데하이드, 케톤류 이었다. 본 GC-IMS 전자코는 proton affinity 가 물보다 큰 분자들을 이온화 시켜 휘발성 성분을 검출하는 원리이다. 원산지별로 커피시료의 향기 성분의 종류 뿐 아니라 향의 세기 즉, 향기 성분의 양도 다르게 나타났다(Fig.1과 Table 4). 한국 고흥산 커피의 휘발성 화합물 중 높은 감도를 보인 성분은 methylcyclopentane, 1-heptene, 3-butenenitrile, diethoxy-1,1-ethane, ethyl propanoate, 2-pentanone, butanal, 1-propanol, 1-propanethiol, ethyl butyrate, n-propyl acetate, ethyl acetate, isopropyl tert-butyl ether, propyl propanoate, isobutyl acetate, methylpyrazine 이었고, 낮은 감도를 보인 성분은 pyridine 이었다. 콜롬비아 커피의 휘발성 화합물 중 높은 감도를 보인 성분은 methylcyclopentane, 1-heptene, isobutyl acetate, methylpyrazine, diethoxy-1,1-ethane, 3-butenenitrile, ethyl propanoate, n-propyl acetate 이다. 에티오피아 커피의 휘발성 화합물 중 높은 감도를 보인 성분은 diethoxy-1,1-ethane, 1-propanol,2-methyl, 2,3-pentadione, ethyl acetate, 1-propanethiol, butanal, diethoxy-1,1-ethane, isobutyl acetate, methylpyrazine, 3-butenenitrile, n-propyl acetate, isopropyl tert-butyl ether 이었고, 낮은 감도를 보인 성분은 propyl propanoate, 1-heptene, methylpyrazine, diethoxy-1,1-ethane, 3-butenenitrile, isopropyl tert-butyl ether 이었다. 과테말라 커피의 휘발성 화합물 중 높은 감도를 보인 성분은 diethoxy-1,1-ethane, propyl propanoate, 1-heptene, isobutyl acetate, methylpyrazine, 2-pentanone, n-propyl acetate, isopropyl tert-butyl ether, pyridine, methylcyclopentane, 3-butenenitrile, 1-propanol, n-propyl acetate, 2-pentanone, 1-propanol 이었고, diethoxy-1,1-ethane, butanal, ethyl butyrate, 1-propanethiol, ethyl acetate 이었다. 브라질 커피 중 높은 감도를 보인 휘발성 화합물은 diethoxy-1,1-ethane, pyridine, propyl propanoate, isobutyl acetate, methylpyrazine, isopropyl tert-butyl ether 이었고, 낮은 감도를 보인 성분은 methylcyclopentane, 1-propanol,2-methyl, 1-heptene, 2,3-pentadione, diethoxy-1,1-ethane, 3-butenenitrile, 2-pentanone, n-propyl acetate, ethyl acetate 이었다. 인도 로부스타 커피의 휘발성 화합물 중 높은 감도를 보인 성분은 pyridine, 2,3-pentadione, diethoxy-1,1-ethane, 1-propanol,2-methy 이었고, 낮은 감도를 보인 성분은 sobutyl acetate, ethyl acetate, isopropyl tert-butyl ether 이었다.
| Area set no | Compounds | RT(sec)1) | DT(ms)2) | Attributes | References |
|---|---|---|---|---|---|
| 1 | 1-Propane thiol | 150.78 | 1.227 | skunky, garlic | International Chemical Safety Card |
| 2 | Butanal | 149.52 | 1.294 | Green, malty | Gilberto V. de Melo Pereira, 2019 |
| 3 | Ethyl acetate | 149.94 | 1.34 | fruity | CAMEO Chemicals |
| 5 | 1-Heptene | 192.36 | 1.359 | unpleasant odor | RSC acquires Merck Index". www.rsc.org. Retrieved 2018 |
| 6 | 2-Pentanone | 186.48 | 1.374 | Tobacco | T. C. Tso (2007) |
| 7 | 3-Butenenitrile | 174.09 | 1.313 | mustard oil | C. Pomeranz, 1906 |
| 11 | Pyridine | 209.79 | 1.159 | Sour, putrid, fishy, amine, bitter, roasted | Nicola Caporasoa, 2018 |
| 12 | 2,3-Pentadione | 234.36 | 1.158 | Buttery, oily, caramel-like | Nicola Caporasoa, 2018 |
| 13 | Diethoxy-1,1-ethane | 177.66 | 1.233 | Pungent ethereal aldehydic fruity | the sensory properties in cup |
| 14 | Isobutyl acetate | 216.09 | 1.235 | Fruity, with an apple and banana nuances | Gilberto V. de Melo Pereira, 2019) |
| 15 | 1-Propanol, 2-methyl | 241.29 | 1.363 | fruity, floral | National Institute for Occupational Safety and Health |
| 16 | 1-Propanol | 157.29 | 1.286 | Floral with a sweet, coconut nuance | Gilberto V. de Melo Pereira, 2019) |
| 17 | Methylcyclopentane | 128.1 | 1.241 | faint odor | Giuliano, Robert, 2014 |
| 18 | 3-Butenenitrile | 159.6 | 1.222 | mustard oil | C. Pomeranz, 1906 |
| 19 | Ethyl propanoate | 174.3 | 1.402 | Sweet, fruity, rum, juicy | Nicola Caporasoa, 2018) |
| 20 | 1-Hexene | 213.15 | 1.447 | a strong fruity odor | Ullmann's Encyclopedia of Industrial Chemistry, |
| 21 | Diethoxy-1,1-ethane | 137.97 | 1.222 | Pungent ethereal aldehydic fruity | the sensory properties in cup |
| 22 | Ethyl butyrate | 215.04 | 1.392 | Sweet, fruity, tutti-fruity | Gilberto V. de Melo Pereira, 2019 |
| 23 | Propyl propanoate | 265.44 | 1.349 | Sweet, fruity, rum, juicy | Nicola Caporasoa, 2018 |
| 24 | Methylpyrazine | 273.21 | 1.352 | Roasted, hazelnut-like | Gilberto V. de Melo Pereira, 2019 |
| 25 | Isopropyl tert-butyl ether | 289.17 | 1.394 | Sweet, fruity | Gilberto V. de Melo Pereira, 2019 |
| 26 | N-Propyl acetate | 178.29 | 1.277 | Sweet, fruity | Gilberto V. de Melo Pereira, 2019 |
커피가 로스팅 공정을 거치게 되면 floral, fruity, roasted, nutty, cocoa, sweet 향기와 같은 긍정적인 향이 생성되고, 다른 한편으로는 sour, fermented, papery, musty, chemical, ashy, acrid, tabacco 와 같은 부정적인 향기도 생성된다(23,24). 전자코에 의해 검출된 휘발성 성분의 향의 특성을 Table 5에 나타내었다. Table 5에서와 같이 floral, fruity, roasted, sweet과 같은 긍정적인 향기성분으로는 2,3-pentadione, isobutyl acetate, 1-propanol,2-methyl, 1-propanol, ethyl propanoate, propyl propanoate, methyl pyrazine, isopropyl tert-butyl ether 등이 검출되었다(24-27). 또, sour, papery, musty, ashy 와 같은 부정적인 향기성분으로는 1-propanethiol, butanal, 2-pentanone, pyridine, 3-butenenitrile, 1-heptene 등이 검출되었다(24-27). 전체적인 향의 특성을 비교해 보기 위해 긍정적인 향에 영향을 주는 휘발성 성분 8종에 대하여 커피 품종별로 감지된 세기를 그림으로 표시하여 Fig. 3에 나타내었고, 부정적인 향에 영향을 주는 6종의 휘발성 성분의 감지 세기는 Fig. 4에 각각 나타내었다.
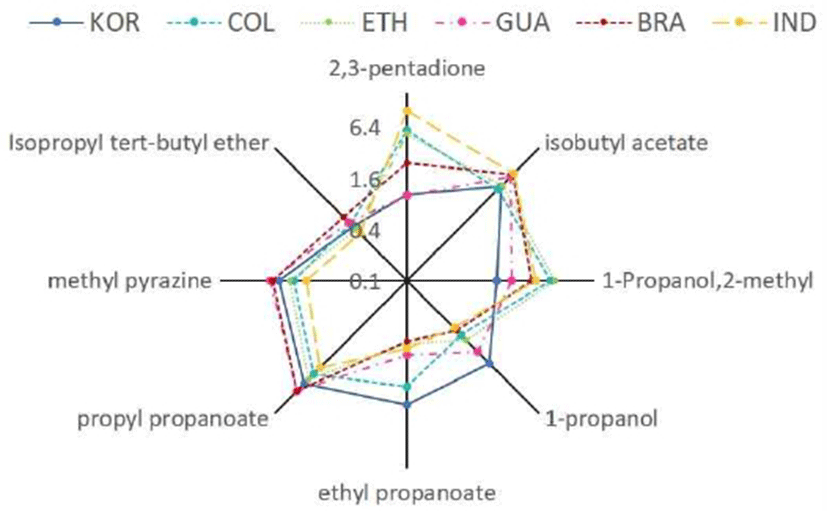
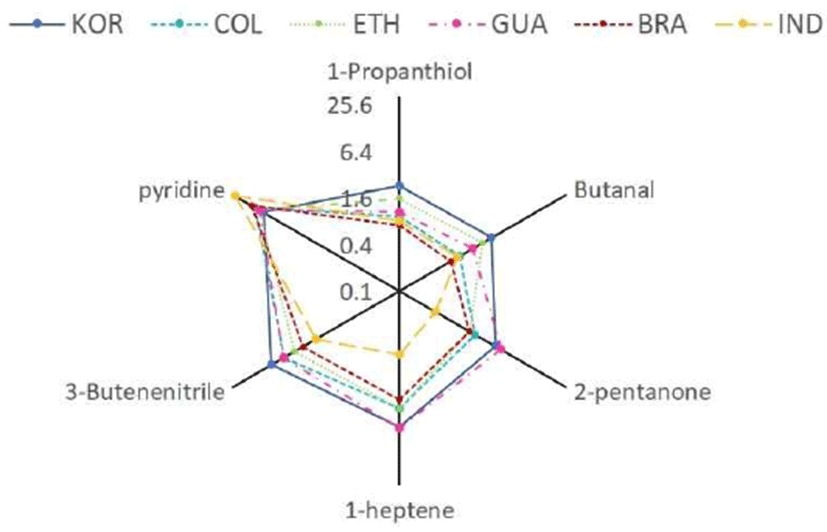
한국 고흥산 커피의 긍정적인 향기 성분은 floral with sweet, coconut nuance 향기 특성을 갖는 1-propanol과 sweet, fruity, rum, juicy 향기 특성을 갖는 ethyl propanoate가 높게 나타났고, 부정적인 향기 성분은 skunky, garlic 향기 특성을 갖는 1-propanethiol이 높게 나타났다. 콜롬비아 커피의 긍정적 향기 성분은 buttery, oily, caramel-like 향기 특성을 갖는 2,3-pentadione 가 높게 나타났고, 부정적인 향기 성분은 sour, putrid, fishy, amine, bitter, roasted 향기 특성을 갖는 pyridine 이 높게 나타났다. 브라질 커피의 긍정적인 향기 성분은 sweet, fruity, rum, juicy 향기 특성을 갖는 propyl propanoate 가 높게 나타났고, 부정적인 향기 성분은 sour, putrid, fishy, amine, bitter, roasted 향기 특성을 갖는 pyridine이 높게 나왔지만 나머지 성분들은 다른 커피들보다 낮거나 비슷하게 나타났다. 에티오피아 커피의 긍정적인 향기 성분은 fruity, floral 향기 특성을 갖는 1-propanol,2-methyl 이 높게 나타났고, 부정적인 향기 성분은 sour, putrid, fishy, amine, bitter, roasted 향기 특성을 갖는 pyridine 이 높게 나타났다. 과테말라 커피의 긍정적인 향기 성분은 Roasted, hazelnut-like 향기 특성을 갖는 methylpyrazine 이 높게 나타났고, 부정적인 향기 성분은 tobacco 향기 특성을 갖는 2-pentanone 이 높게 나타났다. 인도 커피는 buttery, oily, caramel-like 향기 특성을 갖는 2,3-pentadione 이 높게 나타났고, 부정적인 향기 성분은 sour, putrid, fishy, amine, bitter, roasted 향기 특성을 갖는 pyridine이 높게 나타났다. Fig. 1 에서 한국 고흥산 커피의 휘발성 화합물 중 높은 감도를 보인 9개의 성분은 다른 외국산 커피에서는 보이지 않아 한국 고흥산 커피만의 독특한 향기 성분 구성을 보였으며, 콜롬비아 커피에서 강하게 감지된 buttery, oily, caramel-like 향기 특성을 갖는 2,3-pentadione과 에티오피아 커피에서 강하게 감지된 fruity, floral 향기 특성을 갖는 1-propanol, 2-methyl- 이 거의 나타나지 않았고, 과테말라에서 강하게 감지된 unpleasant odor 향기 특성을 갖는 1-heptene , tobacco 향기 특성을 갖는 2-pentanone, Sweet, fruity 향기 특성을 갖는 isopropyl tert-butyl ether, sweet, fruity 향기 특성을 갖는 n-propyl acetate 성분은 거의 일치하게 나타났으며, 인도 로부스타에서 강하게 감지된 sour, putrid, fishy, amine, bitter, roasted 향기 특성을 갖는 pyridine은 약하게 감지되었다.
이상의 결과로부터 커피의 휘발성 성분 중 GC-IMS 전자코에서 높은 감도로 검출된 성분들의 구성을 보았을 때, 한국 고흥산 커피는 외국산 커피와 뚜렷한 차이를 보였다. 한국 고흥산 커피는 긍정적인 향에 영향을 주는 성분과 부정적인 향에 영향을 주는 성분이 함께 검출이 되었다. Traore (29)의 연구에 의하면 스페셜티커피는 로스팅하면 과일향, 꽃향, 달콤한향, 향신료향 등과 같은 향기 특성들이 만들어 지고, 우수한 커피 품질 만큼 부정적인 향기 특성이 적게 만들어진다고 보고하였고, James (23)의 연구에 의하면 부정적인 향기 특성은 커피생두의 결점두에서 발생하는 향기 특성이라고 보고하였다. 한국 고흥산 커피를 스페셜티커피와 유사한 품질로 만들기 위해 부정적인 향기를 억제하고 긍정적인 향기를 극대화 시킬 수 있기 위한 커피의 선별과 가공, 로스팅 프로파일과 추출에 대한 연구가 향후 지속적으로 진행된다면 한국산 커피의 수입대체 효과는 물론 커피 산업이 더욱 발전할 수 있을 것으로 생각된다.
요 약
본 연구에서는 국내에서 최초로 시험재배에 성공하여 특화작물로 지정 받은 전남 고흥 커피의 향기 특성을 알아보기 위해 GC-IMS 전자코를 이용하여 국내에서 많이 소비되는 외국산 커피 5종과 원산지별로 향기 특성을 비교분석하였다. GC-IMS 전자코에 의해 검출된 향기성분을 주성분 분석한 결과, 6종의 커피는 원산지별로 뚜렷이 구분되었다. 한국 고흥산 커피 특징적인 향기 성분은 floral with a sweet, coconut nuance 향기 특성을 갖는 1-propanol과 sweet, fruity, rum, juicy 향기 특성을 갖는 ethyl propanoate로 5종의 외국산 커피에 비하여 높게 감지되었으며, sour, putrid, fishy, amine, bitter와 같이 부정적인 향기 특성을 갖는 pyridine은 5종의 외국산 커피보다 가장 낮게 감지되었다. 한국 고흥산 커피의 향기 패턴은 긍정적인 향기 성분 2종과 부정적인 향기 성분 2종은 과테말라 커피와 거의 일치하게 감지되었고, 다른 향기 성분들도 유사하게 감지되었다. 이같은 결과로부터 한국 고흥산 커피의 향기 특성을 분석한 결과, 달콤한 향이 강하고 시큼하고 쓴 향은 약하게 나타나 국내 소비자들로 좋은 반응이 기대되며 또한, 수입에만 의존하던 커피생두를 국내산으로 대체할 수 있을 것으로 생각된다.