Introduction
Rice (Oryza sativa L.) is one of the most important cereals in the world, particularly in Asian countries. It is a rich source of various nutrients (carbohydrate, thiamine, riboflavin, niacin, folic acid, tocopherol, magnesium [Mg], manganese [Mn], and zinc [Zn]) and bioactive substances (e.q., phytic acid, γ-oryzanols, and phenolic acids) (1,2). In comparison to white rice, brown rice is more enriched with bioactive substances (1). Dietary intake of whole grains (e.g., brown rice, maize, wheat, and oats) helps prevent various diseases, including cardiovascular disease, diabetes, and obesity (3). Brown rice has been reported to decrease blood glucose levels (4) and increase antioxidant activity (5). Therefore, brown rice is widely consumed in a variety of ways such as in beverages, teas, cereals, and fermented foods.
Organic farming of rice, soybean, wheat, corn, oats, and barley has gained popularity, as organic agricultural products are believed to be healthier and safer than conventional agricultural products (6). Many studies have compared the nutrient contents, beneficial health effects, and toxicological risks between conventional and organic agricultural products (7,8). The bioactive substance content and beneficial health effects of agricultural products depend on numerous factors such as cultivar type, location, type of green manure, treatment method, green manure treatment time, and environment. However, experimental evidences on the superior nutritional and functional qualities of organic foods over conventionally grown foods are insufficient.
Although organic food products are suggested to display superior nutritional and functional qualities as compared with the conventionally grown agricultural products (9), evaluation of these properties is difficult. In particular, it is challenging to maintain identical cultivation conditions (e.g., soil, climate, and amount of water) that affect the characterization of agricultural products. Thus, there is an unmet need to investigate differences in the nutritional and functional properties between organically and conventionally grown agricultural products.
In comparison to the conventionally grown white rice, organic white rice is known to exhibit higher levels of bioactive substances (e.g., total phenolics, phytic acid, and minerals) and antioxidant activity (10-12). Sirikul et al. (13) demonstrated higher levels of bioactive substances (total phenolics and α-tocopherols) and enhanced antioxidative activity in organically grown rice bran than in conventionally grown rice bran. These studies focused only on white rice and rice bran; comparison of bioactive substances and biological activities between conventionally grown brown rice (CGBR) and organically grown brown rice (OGBR) is lacking. Our previous study showed that OGBR has higher total and individual γ-oryzanol (cycloartenyl ferulate and sitosteryl ferulate) content than CGBR (14). Therefore, detailed investigations using animal experimental models are required to compare the contents of various bioactive substances and beneficial health effects between CBGR and OGBR.
In the present study, we compared CGBR and OGBR for their major bioactive compounds, including minerals, β -sitosterol, phenolic acids, tocopherols (vitamin E), vitamin B, and total phenolics. In addition, we evaluated the antioxidant activity of brown rice samples with 1,1-diphenyl-2-picrylhydrazyl (DPPH) radical-scavenging assay and copper (Cu) ion-induced lipid peroxidation in rat blood plasma.
Materials and methods
A common rice variety (O. sativa var. Dongjin) was cultivated at the research farm (35°01′27″N, 126°49′24″ E) of the Jellanamdo Agricultural Research and Extension Services in Naju, Jeonnam, Korea. The soil used was silt loam (silt, 73.5%; clay, 22.3%; and sand, 4.2%) and its chemical properties were as follows: pH, 5.9 to 6.0; electrical conductivity (EC), 0.44 to 0.45 dS/m; available phosphorus (P2O5), 43 to 46 mg/kg; exchangeable K+, 0.12 to 0.13 cmol/kg; Ca2+, 3.59 to 3.61 cmol/kg; Mg2+, 1.11 to 1.15 cmol/kg; and available silicon dioxide (SiO2) content, 150 to 186 mg/kg. Organic and conventional fields were divided by an agricultural machinery road (8 m wide). In particular, the sampling of organic rice was performed in the central region of the block to prevent any possible contamination with pesticides and chemical fertilizers. The organic research field (3 ha) has been organically managed for 5 years according to the organic standards of the National Agricultural Products Quality Management Service, Korea (15). In addition, independent groundwater was used to irrigate the organic field.
An experimental plot in the organic farming system was prepared with a green manure crop (Vicia villosa Roty). The green manure crop for the organic farming system was annually seeded in late September and maintained until next May; 90 kg/ha seeds were sown. After harvest, the rice straw was chopped to a length of about 10 cm and spread on the soil surface. The conventional research field (3 ha) has been managed over 10 consecutive years. Field management of the conventional paddy was as follows: fertilization (N:P:K=9:4.5:5.7, w/w, 202 kg/ha) and weeding by herbicide (1.0% fentrazamide and 0.07% pyrazosulfuron-ethy3l, suspension concentrate, 321 gai/ha) on June 20 and spraying of pesticide (2% chlorantraniliprole, 16 gai/ha) on August 7 to control disease and insect pests. Both organic and conventional rice were transplanted on June 10 and harvested on October 30. The average temperature and precipitation in the study area were 23.5℃ and 128.8 mm, respectively, over the experimental period. The harvested rice was sun-dried until the moisture content reached about 13.0%. After removal of the rice hull, brown rice samples were stored at -40℃ until use.
Tocopherols, ferulic acid, and DPPH were purchased from Wako Pure Chemical Industries, Ltd. (Osaka, Japan). p-Hydroxybenzoic acid, vanillic acid, p-coumaric acid, pyridoxine hydrochloride (vitamin B6), riboflavin (vitamin B2), and 2,6-di-tert-butyl-4-methyl-phenol (BHT) were obtained from Sigma-Aldrich Co. (St. Louis, MO, USA). Folin-Ciocalteau phenol reagent and β-sitosterol were supplied by Nacalai Tesque, Inc. (Kyoto, Japan) and Tama Biochemical Co., Ltd. (Tokyo, Japan), respectively. Potassium chloride, sodium chloride (NaCl), and acetic acid (extra pure quality) were obtained from Duksan Pure Chemical Co. Ltd. (Ansan, Korea). All other chemicals used were of reagent grade from commercial sources.
The mineral content in brown rice samples was quantitatively determined by inductively coupled plasma mass spectrometry (ICP-MS) and atomic absorption spectrophotometry (AAS) (16). The brown rice powder (0.3 g) was treated with 7 mL of 70% nitric acid and the mixture heated at 170℃ for 50 min. The mixture was cooled to room temperature and filtered using the Whatman filter paper No. 2 (Whatman International, Maidstone, England). The filtrate was diluted to a volume of 100 mL with distilled water. The contents of Mg, Mn, Zn, and Cu in the filtrate were determined by ICP-MS (Agilent 7500ce, Agilent Technologies, Palo Alto, CA, USA). ICP-MS analysis was carried out using the following parameters: RF power, 1,400 W; plasma gas flow rate, 15 L/min; auxiliary gas flow rate, 1 L/min; carrier gas flow rate, 1 L/min; flow rate of H2 gas, 4 mL/min; octapole bias, -6V; Qp bias, -3V; point per peak, 3; and integration time, 0.3 s. The sodium (Na) content was determined by AAS (Analyst 400, PerkinElmer, Waltham, MA, USA) analysis at a wavelength of 589 nm.
Vitamin B2 content in brown rice samples was determined according to the method described by the Korean Food Standards Codex (16). Brown rice powder (5 g) was added to distilled water (50 mL) and the mixture extracted in a water bath at 80℃ for 30 min with shaking. After filtration with a 0.22 μm Millipore membrane (Millex-FH 13 mm, Millipore, Billerica, MA, USA), the filtrate was injected into a high performance liquid chromatography (HPLC) system equipped with a fluorescence detector (474FL, Waters, Milford, MA, USA). Vitamin B2 was separated on a Capcell Pak C18 UG120 (4.6 mm I.D.×250 mm, 5 μm, Shiseido, Tokyo, Japan) and detected under 445 nm excitation and 530 nm emission wavelengths. A mixture of methanol (MeOH) and 10 mM monosodium phosphate (NaH2PO4) at a ratio of 35:65 (v/v, pH 5.5) was used for elution at a flow rate of 0.8 mL/min.
Vitamin B6 content in brown rice samples was determined according to the method described by the Korean Food Standards Codex (16). Brown rice powder (5 g) mixed with distilled water (25 mL) was sonicated (Power Sonic 4200, Hwashin, Ulsan, Korea) for 30 min, followed by centrifugation at 1,237 ×g. The extraction process was repeated several times and the supernatants were combined to produce a volume of 50 mL. Vitamin B6 content in the extracted solution was determined at a flow rate of 1.0 mL/min using HPLC conditions mentioned for vitamin B2.
Tocopherol contents in brown rice samples were determined according to the method described by Kim et al. (8). Briefly, each sample (0.5 g) was homogenized in a solution containing 1.0 mL 1% NaCl and 10 mL ethanol (EtOH) with 3% (w/v) pyrogallol. The homogenate was added to 20 mL EtOH solution containing 3% pyrogallol (10 mL) and 3 mL of 60% potassium hydroxide (KOH). The mixture was heated at 70℃ for 30 min, cooled to room temperature, and filtered under vacuum using Whatman filter paper no. 2. The filtrate was added to 1% NaCl (22.5 mL) and partitioned with ethyl acetate (EtOAc) and n-hexane at a ratio of 1:9 (v/v, 20 mL, thrice). The upper layer (EtOAc/n-hexane=1:9 v/v) was concentrated in a vacuum at 38℃. The concentrate was dissolved in 4 mL MeOH and filtered through a 0.45 μm Millipore membrane. The filtrate was injected into an HPLC equipped with a fluorescence detector (RF-10AXL, Shimadzu, Kyoto, Japan). Tocopherols were separated on an ODS-80Ts column (4.6 mm I.D.×250 mm, 5 μm, Tosoh, Kyoto, Japan) and monitored under 295 nm excitation and 325 nm emission wavelengths. Elution was achieved using a solvent mixture of MeOH and water (9:1 v/v) at a flow rate of 1.0 mL/min.
β-Sitosterol content in brown rice samples was determined with ODS-HPLC analysis (17). Briefly, brown rice powder (1.0 g) was mixed with n-hexane (9 mL) and EtOH (1 mL) in a thermostable screw cap test tube and sonicated for 5 min. The mixture was extracted on a heating block (MG-2200, Eleya, Tokyo, Japan) at 75℃ for 30 min, followed by centrifugation at 1,237 ×g to obtain a supernatant (n-hexane/ethanol layer). The residue was extracted with n-hexane (9 mL) using the same extraction procedure to obtain the n-hexane layer. Supernatants were combined and concentrated in a vacuum. The concentrate was dissolved in 0.5 mL of dichloromethane (CH2Cl2) and filtered through a 0.45 μm Millipore membrane. Filtrates were subjected to HPLC (SPD-M20D, Shimadzu, Kyoto, Japan) connected to a photodiode array (PDA). β-Sitosterol was separated on an ODS-80Ts column (4.6 mm I.D.×250 mm, 5 μm, Tosoh) and monitored at a wavelength of 210 nm. Elution was achieved using a solvent mixture of acetonitrile (MeCN) and water (100:2 v/v) at a flow rate of 1.0 mL/min.
The total phenolic content in brown rice samples was measured using the Folin-Ciocalteau method (18). Briefly, samples (2.0 g) were homogenized (BM-2 Nissei biomixer, Nihon Seiki Ltd., Tokyo, Japan) with 100% MeOH (30 mL) for 5 min and filtered using Whatman filter paper No. 2. The residue was successively extracted with 80% and 100% MeOH (30 and 50 mL, respectively) using the extraction procedure described above. The combined filtrates were concentrated in vacuum and the concentrate was dissolved in 4 mL MeOH. A portion (0.5 mL) of the dissolved solution was evaporated with nitrogen gas and suspended in 0.5 mL 30% MeOH. This solution was incubated with Folin- Ciocalteau phenol reagent (2.5 mL) and a saturated sodium carbonate (Na2CO3) solution (0.5 mL) for 60 min and its absorbance determined at a wavelength of 700 nm using a spectrophotometer (V-550, Jasco, Tokyo, Japan). The total phenolic content of the sample was quantified from a gallic acid calibration curve used as the standard.
We analyzed the phenolic acid content with ODS-HPLC (19). Samples (2.0 g) were homogenized in a solution of MeOH and water (8:2 v/v, 20 mL) containing 4 mM sodium fluoride (NaF). The homogenate was added to 20 mL of the same solution, sonicated at 50℃ for 10 min, and centrifuged at 1,237 ×g at 4℃ for 20 min. The extraction process was repeated for the residue and supernatants obtained were combined and concentrated in vacuum. The concentrate was added to 10 mL of MeOH and water (2:8 v/v) solution containing 1 M sodium hydroxide (NaOH) and heated to 90℃ for 30 min. The solution was cooled, mixed with water (90 mL), and partitioned with n-hexane (100 mL, thrice). The pH of the aqueous layer was adjusted to 1.8 with 4 N hydrochloric acid (HCl, 2.5 mL) and the layer partitioned with EtOAc (100 mL, thrice). The EtOAc layer was evaporated using vacuum; the concentrate was dissolved in 2.0 mL of MeOH and filtered through a 0.45-μm Millipore membrane. The filtrate was subjected to PDA-HPLC system that operates at wavelengths from 200 to 800 nm. Phenolic acids were separated on a VP-ODS column (4.0 mm I.D.×250 mm, 5 μm, Shimadzu) using a gradient system of 100% water (pH 2.65 with hydrogen phosphate [HPO4], eluent A) to 100% MeCN (eluent B) as follows: 5% B for 5 min, 9% B for 15 min, 11% B for 22 min, 18% B for 38 min, 23% B for 43 min, and 90% B for 50 min. Detection was accomplished at 254 nm while the flow rate was 1.0 mL/min. Standard solutions (mg/mL) of phenolic acids, including p-hydroxybenzoic, vanillic, p-coumaric, and ferulic acids, were diluted to appropriate concentrations in MeOH to construct calibration curves. Calibration curves were constructed by plotting the peak areas compared with the concentration of each compound. Recovery of each compound was calculated using the spiking method in triplicate. Phenolic acid contents were qualitatively and quantitatively analyzed in five experiments.
The DPPH free radical-scavenging activities of brown rice samples were evaluated with a few modifications in the method described by Abe et al. (20). Briefly, brown rice samples (2.0 g) were homogenized with 100% MeOH (30 mL) for 5 min and filtered using Whatman filter paper no. 2. The MeOH extract (500 mL) (equivalent to 50 mg brown rice) was incubated with 2.0 mL DPPH radical ethanol solution (final concentration, 250 mM) for 30 min in the dark. Free radical-scavenging activity was determined by decolorization of DPPH at a wavelength of 517 nm and expressed as the percentage decrease in the absorbance of the test compared with that of the blank.
The antioxidative activity of brown rice was evaluated by measuring its inhibitory effects on cholesteryl ester hydroperoxide (CE-OOH) formation during copper ion-induced oxidation of diluted rat blood plasma (8). Sprague-Dawley male rats (6-week-old, 180-200 g, Samtako Bio Korea, Osan, Korea) were maintained at 23℃ under a 12 h dark/light cycle. Rats were fasted for 12-15 h prior to anesthetization with diethyl ether. Following anesthesia, the abdominal wall was opened and blood collected from the abdominal aorta into heparinized tubes. Rat plasma was isolated by centrifugation of blood at 1,500 ×g for 20 min at 4℃ and stored at -40℃ until analysis. Plasma (250 μL) was mixed with 500 μL of phosphate-buffered saline (PBS). The PBS-plasma mixture was treated with 10 mL EtOH solution containing MeOH extract (equivalent to 50 mg brown rice), followed by its oxidation with 100 mL copper sulfate (CuSO4) solution (final concentration, 100 mM). The reaction mixture was incubated at 37℃ for 5 h with continuous shaking and the concentration of CE-OOH determined (21). Briefly, aliquots (100 μL) were withdrawn from the incubated solution and mixed with 3 mL of MeOH containing 2.5 mM BHT. The mixture was sonicated for 1 min and neutral lipids were extracted by vigorous vortexing with 3 mL n-hexane for 1 min. The upper layer (n-hexane) was collected and the extraction of the lower layer with 3 mL n-hexane repeated. The combined n-hexane phases were evaporated in a rotary evaporator at room temperature. Remaining lipids were dissolved in 100 mL of solution containing MeOH and chloroform (CHCl3, 95:5 v/v) and aliquots subjected to reversed phase (RP)-HPLC using a TSK-gel Octyl-80Ts column (Tosoh) for quantification of CE-OOH. CE-OOH was detected by UV at a wavelength of 235 nm (Shimadzu SPD-10A, Shimadzu). A solution of MeOH and water (97:3 v/v) served as a mobile phase at a constant flow rate of 1.0 mL/min. CE-OOH concentration was calculated from a standard curve of cholesteryl linoleate hydroperoxide (21). All animal experimental procedures were approved by the Institutional Animal Care and Use Committee of Chonnam National University (No. CNU IACUCYB- 2013-4).
Data are expressed as mean±SD using the SPSS 17.0 package (IBM, Armonk, NY, USA). Statistical differences in the chemical components between CGBR and OGBR were assessed by Student’s t-test. Statistical differences in the antioxidative activities of samples were assessed by one-way analysis of variance, followed by the Tukey-Kramer test. A value of p<0.05 was considered significant.
Results and discussion
The mineral contents in CGBR and OGBR were determined by ICP-MS and AAS analyses. The concentration of minerals in CGBR and OGBR was in the order Mg > Na > Zn > Mn > Cu and Mg > Na > Mn > Zn > Cu, respectively (Table 1). The concentration of Mg was the highest and reported to be significantly higher in OGBR than in CGBR. Mg, Mn, and Cu contents in OGBR were higher than those in CGBR (Table 1). In contrast, Na and Zn contents in CGBR were higher than those in OGBR. Although the concentrations of boron (B), chromium (Cr), Mn, iron (Fe), Cu, and Zn in organically grown white rice were reported to be higher than those in conventional grown white rice samples, K, Ca, and Mg contents showed no significant difference (12). Several studies have reported that the mineral content in rice varies based on differences in cultivar, soil, environment, maturity stages, and degree of milling (1,22). However, the OGBR and CGBR samples used in our study were cultivated under same conditions. Thus, the mineral content of OGBR may be primarily affected by factors such as the type of green manure, treatment method, and green manure treatment time.
| Mg | Na | Cu | Zn | Mn | |
|---|---|---|---|---|---|
| CGBR | 121.43±2.221) | 54.42±0.62 | 0.41±0.05 | 7.09±0.05 | 2.49±0.02 |
| OGBR | 168.59±2.62*2) | 38.39±0.55* | 0.50±0.06NS3) | 4.06±0.03* | 4.70±0.04* |
Vitamin B2 plays a vital role in energy production (23), while vitamin B6 is a coenzyme in amino acid metabolism (24). Rice is a rich source of vitamin B, particularly B2 and B6 (1). Vitamin B2 and B6 are known to be involved in biotic and abiotic stress responses in plants (25,26). For instance, vitamin B2 induces resistance against pathogens such as fungi and bacteria in various plants (25). In addition, it acts as an antioxidant and prevents plant cell membranes from UV and free radicals (26). We analyzed the vitamin B6 and B2 contents in CGBR and OGBR by ODS-HPLC and found that OGBR exhibited higher content of vitamin B2 and B6 as compared to CGBR (Table 2). The lack of agrochemicals (synthetic fertilizers, pesticides, and c herbicides) during the cultivation of OGBR may expose it to various pathogens such as microorganisms and insects. Although the increase in vitamin B2 and B6 contents was not dramatic, the significant increase (p<0.05) by organic farming is meaningful from the perspective of plant physiology.
Tocopherol is a representative hydrophobic antioxidative vitamin that exerts various beneficial biological effects, including reduction in blood cholesterol levels and prevention of cardiovascular disease and atherosclerosis (27). The α-, β-, γ-, and δ-tocopherol contents in CGBR and OGBR were determined using HPLC. We found that α- and δ-tocopherols had a retention time (tR) of 16.41 and 12.2 min, respectively, on the HPLC chromatogram, while both β- and γ-tocopherols were detected at about tR 14.39 min. The β- and/or γ -tocopherol contents in CGBR and OGBR were quantitatively determined to be nearly zero. The recovery ratio of α-, β- and/or γ-, and δ-tocopherols was 91.2±4.0%, 92.1±2.4%, and 90.9±4.3%, respectively. The tocopherol contents in CGBR and OGBR are shown in Table 2. No variation was observed in the tocopherol contents between OGBR and CGBR. In comparison with CGBR, OGBR showed lower α-tocopherol content and higher β- and/or γ-tocopherol contents, although no significant differences were observed. The level of δ -tocopherol in brown rice samples was undetectable (< 1.0 pmol), consistent with the results from a previous study (28). Taken together, our results indicate that δ-tocopherol may be absent or present at very low levels in rice. Tocopherol contents in vegetables (pepper, carrot, cabbage, potatoes, and corn) have been reported to vary depending on the cultivation year; however, no significant differences in tocopherol content between conventional and organic farming techniques were reported (8,18). These observations indicate that organic farming fails to increase the tocopherol content in brown rice.
β-Sitosterol, a major sterol in rice, inhibits cholesterol absorption and reduces the effect of blood cholesterol (2). Several reports indicate that β-sitosterol content varies with cultivar type, cultivation method, and harvest time (29). We performed a quantitative analysis of β-sitosterol content with ODS-HPLC. β-Sitosterol was detected at tR of 28.9 min on the HPLC chromatogram (data not shown), which was confirmed by comparison with tR and UV-VIS spectrum of the external standard using a PDA system (data not shown). Recovery of β-sitosterol was 94.6±2.6%. As shown in Table 2, OGBR exhibited higher level of β-sitosterol than CGBR, although the difference was not significant.
Phenolic compounds, including phenylpropanoids and flavonoids, have been reported to exert antioxidative, anti-inflammatory, and anticancer activities (30-32). In addition, various plants are known to accumulate phenolic compounds in response to various biotic and abiotic stress conditions (33). Total phenolic contents in organic agricultural products are reported to be higher than those in conventional agricultural products (8). A similar trend is observed in organically grown rice products such as white rice and rice bran (10,12). The total phenolic contents in MeOH extracts of CGBR and OGBR were determined by the Folin- Ciocalteau method (19). Although OGBR showed slightly higher phenolic content than CGBR, no significant difference was observed (Table 2).
Phenolic acids such as sinapinic, chlorogenic, p-coumaric, protocatechuic, phydroxybenzoic, vanillic, and syringic acids are key phenolic compounds present in rice (34). In addition, ferulic and p-coumaric acids are other phenolic acids found in rice. Some phenolic acids such as ferulic acid are contained in the form of esters in brown rice. We performed a qualitative and quantitative analysis of p-hydroxybenzoic, vanillic, p-coumaric, and ferulic acids in CGBR and OGBR with ODS-HPLC after alkaline hydrolysis. The tR for p-hydroxybenzoic, vanillic, p-coumaric, and ferulic acids was 21.1, 27.5, 40.7, and 46.7 min, respectively (data not shown) and their recovery ratio was 100.1±1.7%, 98.1±2.1%, 92.8±1.5%, and 94.3±2.4%, respectively. Phenolic acid contents in CGBR and OGBR are shown in Table 2. Ferulic acid was the most abundant phenolic acid in brown rice samples, followed by p-hydroxybenzoic, vanillic, and p-coumaric acids. OGBR displayed higher level of ferulic acid than CGBR, but no significant difference was observed. The contents of other phenolic acids such as p-hydroxybenzoic, vanillic, and p-coumaric acids in OGBR were very similar to those in CGBR. Similar trends were observed for total phenolic content.
Our results indicate that levels of phenolic compounds may not increase with organic farming and that various factors may affect the constituents of organically cultivated agricultural products. Therefore, additional studies should be conducted to understand the influence of agricultural factors such as the cultivar type, location, type of green manure, treatment methods, and green manure treatment time on the phenolic contents.
Antioxidants attenuate oxidative damage generated in the body and prevent the development of various human diseases, including atherosclerosis and cancer (35,36). Several studies found that organically grown white rice has higher antioxidant activity than conventionally grown white rice (10-12). We compared antioxidant activities of OGBR and CGBR using the DPPH radical-scavenging assay (20). The DPPH radical-scavenging activity of the CGBR MeOH extract (equivalent to 50 mg dry weight(DW)) was highly similar to that of 40 μg α-tocopherol. OGBR showed a higher DPPH radical-scavenging activity than CGBR, but the difference was not significant (Table 2).
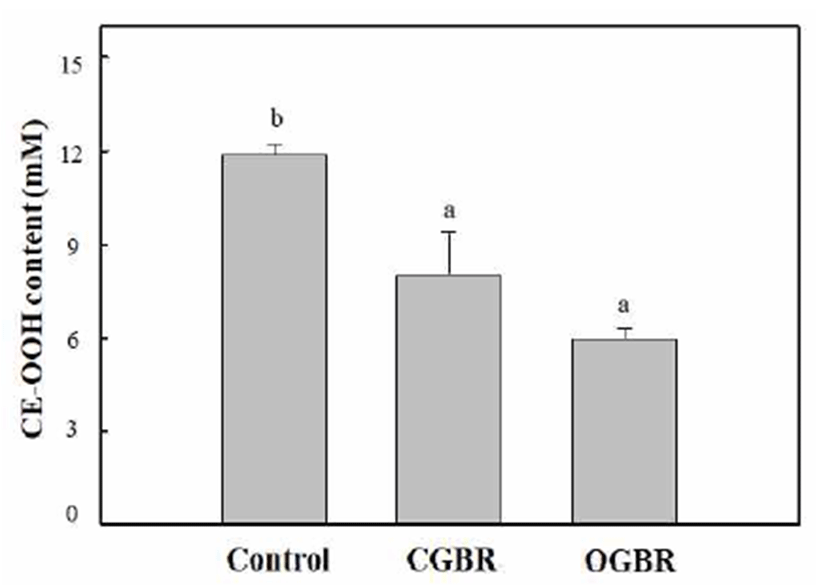
Cholesteryl ester hydroperoxide (CE-OOH) has been used as a lipid peroxidation index in blood plasma to assess the progression of various pathologic disorders such as atherosclerosis and coronary heart disease (37). The four-fold diluted rat blood plasma was oxidized by treatment with Cu ions at 37℃ for 5 h under air. The antioxidant activity of OGBR MeOH extracts at different concentrations (equivalent to 0-100 μg DW) was determined from its ability to inhibit CE-OOH formation. The inhibitory activity of OGBR MeOH extracts on CE-OOH formation increased in a concentrationdependent manner (data not shown). The concentration of CE-OOH decreased by two-fold (4.6 mM) in presence of OGBR MeOH extract equivalent to 50 μg dry weight as compared to its concentration in the control (no external antioxidant added, 10.5 mM). Therefore, we compared the antioxidant activity of OGBR and CGBR MeOH extracts at the same concentration (equivalent to 50 μg DW) by measuring the CE-OOH concentration in rat plasma (Fig. 1). In comparison with the control, brown rice MeOH extracts effectively inhibited CE-OOH formation in rat plasma, regardless of the farming system. OGBR MeOH extract exhibited stronger inhibitory effect against CE-OOH formation than the CGBR MeOH extract, although the difference was not significant. Thus, OGBR may be slightly more effective than CGBR in preventing blood plasma oxidation. The pattern observed here was similar to those for DPPH radical-scavenging activity and total phenolic and tocopherol contents.
The levels of minerals and vitamin B (B2 and B6) in OGBR were higher than those in CGBR. In addition, OGBR showed higher level of bioactive substances (total phenolic and phenolic acids) and antioxidative activity than CGBR, although no significant differences were observed. Our previous study showed that OGBR exhibited higher level of total and individual γ-oryzanol than CGBR (14), consistent with other studies showing an increase in antioxidative activity and bioactive substances in white rice cultivated by organic farming (10,12). Taken together, these results indicate that organic farming may be useful for increasing the antioxidative activity and bioactive substance content of brown rice. In addition, compared to CGBR, long-term consumption of OGBR may offer more health benefits. However, the differences in levels of bioactive substances as well as the antioxidative activity between CGBR and OGBR were small. We believe that numerous factors such as cultivar type, growth location, type of green manure, treatment methods, and environment may affect the nutritional value of brown rice. Therefore, more studies are needed to understand the parameters that increase levels of bioactive substances and enhance the beneficial health effects of organic farming.