

1. Introduction
Ginseng (Panax ginseng C. A. Meyer) is widely recognized as a traditional medicinal plant with diverse pharmacological activities including antioxidant, anti-inflammatory, anticancer, and immunomodulatory effects. These bioactivities are largely attributed to ginsenosides, a class of dammarane-type triterpenoid saponins that are structurally categorized into protopanaxadiol (PPD) and protopanaxatriol (PPT) types depending on their aglycone skeleton (Attele et al., 1999; Christensen, 2009). In cultivated mountain ginseng (CMG), major ginsenosides, such as Rb1, Rb2, Rc, and Rd, are predominant, whereas minor ginsenosides, including Rg3, Rh2, F2, and compound K (CK), are present in relatively low amounts (Jeong et al., 2019).
Despite their abundance, major ginsenosides exhibit relatively low bioavailability owing to their high molecular weight and multiple sugar moieties, which limit their absorption in the human gastrointestinal tract (Hu et al., 2023). Conversely, minor ginsenosides, generated through deglycosylation reactions, demonstrate significantly enhanced bioavailability and bioactivity, including anticancer, antidiabetic, and neuroprotective effects (Hasegawa, 2004; Kim, 2012). Therefore, bioconversion of major ginsenosides into minor forms has attracted considerable attention as a strategy to enhance the functional efficacy of ginseng-derived products.
Various processing methods such as thermal treatment (steaming), acid hydrolysis, and microbial fermentation have been employed to induce ginsenoside transformations (Hong et al., 2007). However, thermal processing requires prolonged heating and high energy input, resulting in increased processing costs and the potential degradation of bioactive compounds. Although effective, microbial fermentation is time consuming and may vary depending on the microbial strain and fermentation conditions (Bae et al., 2004). Enzymatic hydrolysis has emerged as a promising alternative owing to its high specificity, mild reaction conditions, and controllability (Park et al., 2010). Cell wall-degrading enzymes, such as cellulase and pectinase, facilitate the breakdown of plant cell-wall components and the release of bioactive compounds, whereas β-glucosidase catalyzes the hydrolysis of glycosidic bonds in ginsenosides, contributing to their conversion into less glycosylated forms (Lee et al., 2016). Specifically, β-glucosidase-mediated deglycosylation converts major ginsenosides (such as Rb1) into intermediate forms (such as Rd) and subsequently into minor ginsenosides such as F2 and CK (Park et al., 2010). Recent studies have suggested that combining multiple enzymes with complementary catalytic functions can enhance bioconversion efficiency through synergistic effects, enabling more effective transformation pathways and improved functional properties (Choi et al., 2014).
In addition to ginsenoside transformation, enzymatic treatment can influence the physicochemical and functional properties of ginseng extracts, including soluble sugar content, phenolic compounds, antioxidant activity, and acidic polysaccharide levels. These changes are associated with the degradation of cell-wall components and the release of intracellular bioactive compounds (Kim et al., 2007). However, most previous studies have focused on individual enzyme treatments or specific processing conditions. Systematic investigations comparing different multi-enzyme combinations in terms of ginsenoside transformation and functional properties remain limited.
Therefore, this study investigated the effects of different multi-enzyme systems on the physicochemical properties, antioxidant activity, acidic polysaccharide content, xanthine oxidase (XO) inhibitory activity, and ginsenoside bioconversion of CMG. Furthermore, this study aimed to identify enzyme combinations capable of promoting the production of bioactive minor ginsenosides and improving the functional quality of CMG hydrolysates.
2. Materials and methods
Five-year-old CMG (Panax ginseng C.A. Meyer) roots grown in Seoha-myeon, Hamyang-gun, Gyeongsangnam-do, Korea, were purchased from the Hamyang Wild Ginseng Association Farming Cooperative Corporation (Hamyang-gun, Korea). The samples were thoroughly washed with running water and air-dried to remove surface moisture. The dried samples were subsequently freeze-dried at −70°C (FDT-12012, Operon, Gimpo, Korea). The freeze-dried roots were ground using a grinder (HGBSSSS6, Waring, Torrington, CT, USA) and passed through an 80-mesh standard sieve (Chunggye Co., Seoul, Korea) prior to use. Four commercial enzymes, CelluclastⓇ 1.5 L (C), PectinexⓇ Ultra SP-L (P), ViscozymeⓇ L (V), and BANⓇ 480 L (B), were purchased from Novozymes A/S (Bagsvaerd, Denmark) and used for enzymatic hydrolysis (Table 1). According to the manufacturer’s specifications, the optimal reaction conditions for all enzyme preparations were pH 5.0 and 50-55°C.
The listed enzyme compositions and activities were verified based on the manufacturer’s technical information (Novozymes A/S, Bagsvaerd, Denmark).
Freeze-dried CMG samples were cut into uniform pieces and sterilized at 121°C for 10 min in an autoclave. Distilled water was subsequently added at a ratio of 10-fold (w/v) and the mixture was homogenized. Enzymatic hydrolysis was performed by adding enzyme preparations at a total concentration of 0.5% (w/v) based on the sample weight, followed by incubation at 50°C for 12 h. A reaction temperature of 50°C was selected as the common operating temperature suitable for the activity ranges of the enzyme preparations used in the multi-enzyme systems. Enzyme combinations were prepared by mixing individual enzymes at equal ratios as follows: C + P (Celluclast + Pectinex, 1:1, v/v), C + B (Celluclast + BAN 480L, 1:1, v/v), B + P (BAN 480L + Pectinex, 1:1, v/v), B + V (BAN 480L + Viscozyme, 1:1, v/v), V + P (Viscozyme + Pectinex, 1:1, v/v), C + P + B (Celluclast + Pectinex + BAN 480L, 1:1:1, v/v/v), and P + B + V (Pectinex + BAN 480L + Viscozyme, 1:1:1, v/v/v). After enzymatic hydrolysis, the entire hydrolyzed CMG solution (CMG hydrolysates) was stored at −70°C until further analysis.
The CMG hydrolysate solution was filtered using Whatman No.1 paper, and the filtered solution was used for pH measurements (pH meter, Mettler-Toledo AG 8603, Schwerzenbach, Switzerland). The soluble sugar content was determined using a digital refractometer (PR-101, ATAGO, Tokyo, Japan) and expressed as °Brix. The degree of solubilization (%) was calculated by comparing the sample weights before and after enzymatic hydrolysis using equation (1):
where W0 is the initial dry weight of the sample and Wr is the dry weight of the insoluble residue remaining after enzymatic hydrolysis.
The TPC was determined as described by Singleton et al. (1999) with slight modifications. Briefly, 1 g of CMG hydrolysate was mixed with 2 mL of 50% methanol and extracted using an ultrasonic bath at 50°C for 30 min. The extract was centrifuged at 15,000 rpm for 3 min, and the supernatant was filtered through a 0.45 μm membrane filter to obtain the test solution. An aliquot of 40 μL of the test solution was mixed with 200 μL of distilled water and 20 μL of 50% Folin-Ciocalteu phenol reagent. Subsequently, 40 μL of a 5% Na2CO3 solution was added and thoroughly mixed. The reaction mixture was incubated in the dark for 1 h and the absorbance was measured at 750 nm using a spectrophotometer (Eon, BioTek Instruments, Winooski, VT, USA) . The TPC was quantified using a gallic acid standard curve and expressed as micrograms of gallic acid equivalents per gram of sample (μg GAE/g sample) (equation (2)).
where S is the gallic acid concentration in the test solution (μg/mL), a is the total volume of the test solution (mL), b is the dilution factor of the sample extract, and CMG hydrolysate weight is the weight of the CMG hydrolysate used for extraction (g).
The ginsenoside extraction procedure was performed using a modified version of the protocol described by Jeong et al. (2019). CMG hydrolysate (1 g) was combined with 2 mL of methanol, followed by ultrasonic-assisted extraction at 50°C for 30 min. After extraction, the sample was centrifuged at 15,000 rpm for 3 min, and the collected supernatant was passed through a 0.45 μm membrane filter before high-performance liquid chromatography (HPLC) analysis.
Qualitative and quantitative analyses of 12 ginsenosides, including Rg1, Re, Rf, Rg2, Rb1, Rc, Rb2, Rd, F2, Rg3, CK, and Rh2 were performed using an HPLC system (1200 Series; Agilent Technologies, Santa Clara, CA, USA). Separation was achieved on a Prodigy ODS-2 column (3.2 × 250 mm, 5 μm; Phenomenex, Torrance, CA, USA). Detection was carried out using a photodiode array detector at 202 nm, and the UV absorption spectra were monitored over a range of 200-600 nm. The mobile phase consisted of acetonitrile (A) and water (B), and gradient elution was performed according to the conditions listed in Table 2. The flow rate was maintained at 1.0 mL/min and the injection volume was 20 μL.
| Time (min) | (A) Acetonitrile (%) | (B) Water (%) |
|---|---|---|
| 0 | 17.5 | 82.5 |
| 20 | 21 | 79 |
| 23 | 26 | 74 |
| 42 | 26 | 74 |
| 55 | 36 | 64 |
| 64 | 50 | 50 |
| 73 | 68 | 32 |
| 75 | 80 | 20 |
| 78 | 80 | 20 |
| 83 | 17.5 | 82.5 |
| 89 | 17.5 | 82.5 |
The ginsenoside content was calculated using equation (3):
where S is the ginsenoside concentration in the test solution (μg/mL), a is the total volume of the test solution (mL), b is the dilution factor of the sample extract, and CMG hydrolysate weight is the weight of the CMG hydrolysate used for extraction (g).
The acidic polysaccharide content was determined using the carbazole-sulfuric acid method described by Do et al. (1993). The CMG hydrolysates were centrifuged at 4,000 rpm for 10 min and the supernatant was collected. Subsequently, 0.8 mL of absolute ethanol was added to 0.2 mL of the supernatant, and the mixture was thoroughly mixed. The mixture was centrifuged at 4,000 rpm for 5 min and the supernatant was discarded. The resulting precipitate was dissolved in 1.8 mL of distilled water and diluted 10-fold. An aliquot of 50 μL of the diluted solution was mixed with 25 μL of 0.1% carbazole in ethanol and 300 μL of concentrated sulfuric acid. After mixing thoroughly, the reaction mixture was incubated in a water bath at 85°C for 3 min and subsequently cooled to room temperature. Absorbance was measured at 525 nm using a spectrophotometer (Eon, BioTek Instruments). A calibration curve was constructed using galacturonic acid as the standard. The acidic polysaccharide content was calculated using equation (4) and was expressed as galacturonic acid equivalent (GAAE):
where S is the galacturonic acid concentration in the test solution (μg/mL), a is the final volume of the dissolved precipitate (mL), b is the dilution factor of the sample extract, and CMG hydrolysate weight is the weight of the CMG hydrolysate used for extraction (g).
The DPPH radical scavenging activity was determined according to the method described by Templonuevo et al. (2025) with slight modifications. Briefly, 1 g of CMG hydrolysate was mixed with 2 mL of 50% methanol and extracted using an ultrasonic bath at 50°C for 30 min. The extract was centrifuged at 700 ×g for 3 min, and the supernatant was filtered through a 0.45 μm membrane filter to obtain the test solution. A 60 μL aliquot of the test solution was mixed with 240 μL of a 0.2 mM DPPH solution and incubated in the dark for 30 min. The absorbance was measured at 517 nm using a spectrophotometer (Eon, BioTek Instruments). The DPPH radical scavenging activity was quantified using a gallic acid standard curve and expressed as μg GAE/g sample using equation (5):
where S is the gallic acid concentration in the test solution (μg/mL), a is the total extraction volume (mL), b is the dilution factor of the sample extract, and CMG hydrolysate weight is the weight of the CMG hydrolysate used for extraction (g).
The XO inhibitory activity was determined according to the method reported by Templonuevo et al. (2025) with slight modifications. The CMG hydrolysates were centrifuged at 4,000 rpm for 10 min, and the resulting supernatant was used as the test solution. Briefly, 100 μL of the test solution was mixed with 600 μL of 0.1 M potassium phosphate buffer (pH 7.5), followed by the addition of 200 μL of 2 mM xanthine prepared in the same buffer. The reaction was initiated by adding 100 μL of XO solution (0.2 unit/mL in distilled water). After enzymatic reaction at 37°C for 30 min, the absorbance of each sample was determined at 292 nm using a microplate reader (Eon, BioTek Instruments, Inc., Winooski, VT, USA). The inhibitory effect against XO was calculated using equation (6) and expressed as inhibition percentage (%):
where Asample is the absorbance of the sample, Asample blank is the absorbance of the sample blank without XO, Acontrol is the absorbance of the control, and Acontrol blank is the absorbance of the sample blank without XO.
Each analysis was conducted with a minimum of three independent replicates, and the data were expressed as mean values with SDs. Statistical significance among the experimental groups was evaluated via analysis of variance (ANOVA) using SPSS software (version 25.0; IBM SPSS Statistics, Armonk, NY, USA). ANOVA was performed to evaluate significant differences between treatment groups. When significant differences were detected, Duncan’s multiple range test was applied for post hoc comparisons at a significance probability of p < 0.05.
3. Results and discussion
The effects of the different multi-enzyme systems on the physicochemical properties of the CMG hydrolysates were evaluated by measuring the degree of solubilization, soluble sugar content, and pH (Fig. 1A-1C).
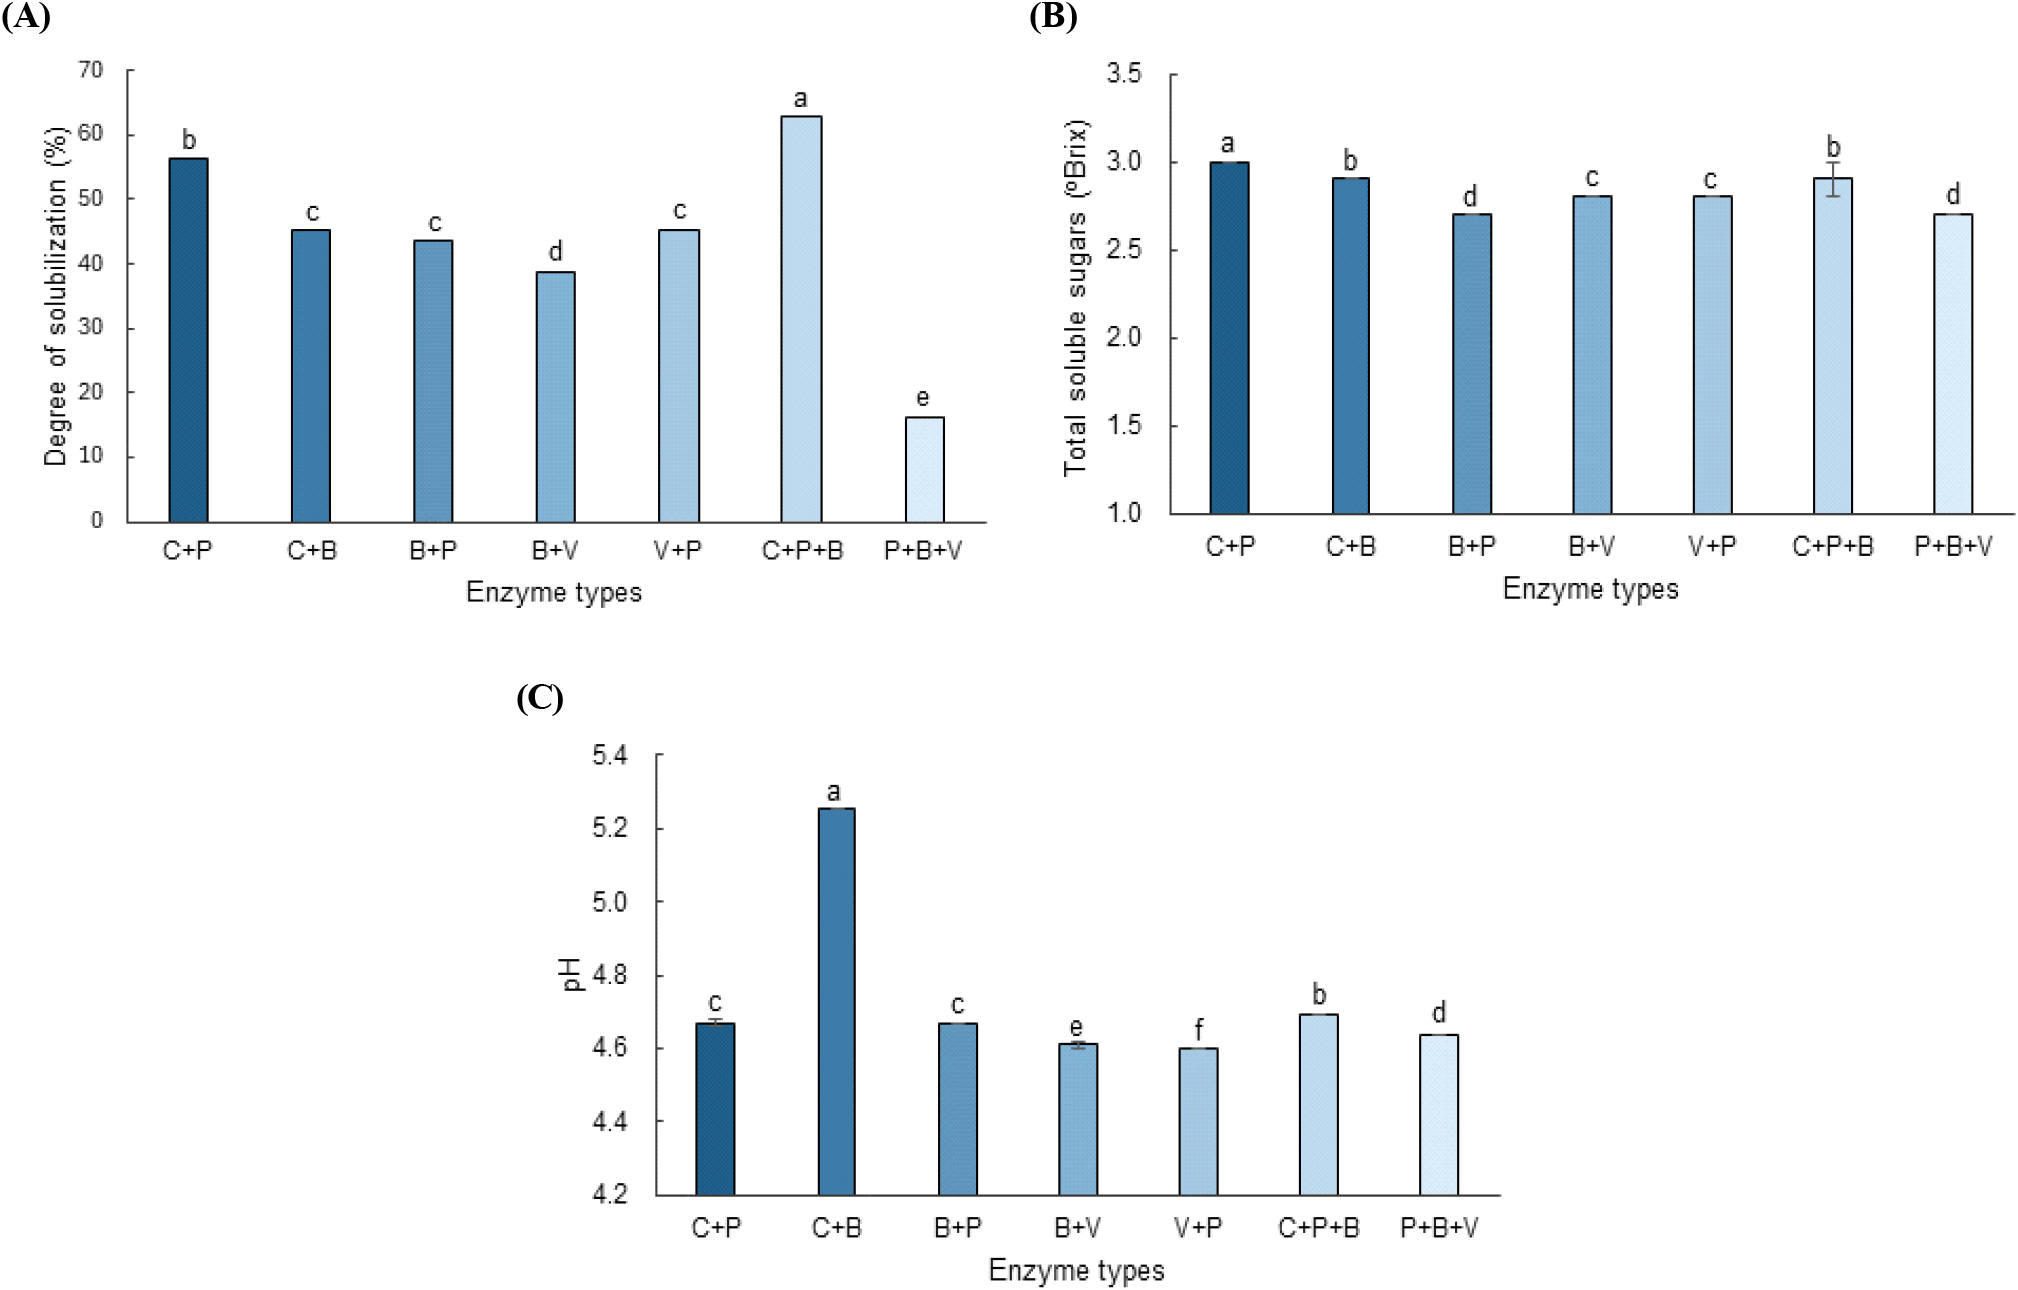
The enzyme combination significantly affected the degree of solubilization (Fig. 1A). Among the multi-enzyme treatments, C + P + B demonstrated the highest degree of solubilization (62.90%) followed by C + P (56.45%). The remaining enzyme combinations exhibited different degrees of solubilization, indicating that the response varied according to the enzyme combination. These differences may be related to the distinct substrate specificities of the enzyme preparations used for each combination. Enzyme-assisted treatments can reportedly facilitate the solubilization of plant materials through the hydrolysis of structural polysaccharides (Sun and Cheng, 2002). However, because the structural changes in the cell-wall components were not directly analyzed in this study, the observed differences were primarily interpreted as enzyme combination-dependent responses.
The enzyme combination also significantly influenced the soluble sugar content (Fig. 1B). Multi-enzyme treatments resulted in a soluble sugar content ranging from 2.70 to 3.03 °Brix, with the highest value observed in the C + P treatment. Differences in the soluble sugar content among the enzyme combinations may reflect variations in the extent and type of carbohydrate hydrolysis. The enzyme-assisted degradation of plant polysaccharides reportedly increases the release of soluble carbohydrate fractions (Sun and Cheng, 2002). Notably, the treatment with the highest degree of solubilization did not correspond to the treatment with the highest soluble sugar content. This suggests that the degree of solubilization and soluble sugar content reflect different physicochemical responses to enzyme combinations and may not be directly related.
The enzyme combination also influenced the pH of the hydrolyzed solutions (Fig. 1C). The multi-enzyme treatments exhibited pH values ranging from 4.60 to 4.69, with the lowest value observed in the V + P treatment (4.60). Although the differences were relatively small, the variations in pH among the treatments indicated that the composition of the enzyme system influenced the physicochemical characteristics of the resulting hydrolysates. Because the chemical factors contributing to the observed pH differences were not directly analyzed in this study, the specific causes of these differences could not be determined.
Overall, these results demonstrate that the physicochemical characteristics of CMG hydrolysates vary depending on the enzyme combination. Specifically, the different trends observed for the degree of solubilization, and soluble sugar content indicate that these parameters do not necessarily respond in parallel to the enzymatic treatment. Therefore, the observed effects of the multi-enzyme systems were interpreted as enzyme combination-dependent responses, because synergistic interactions could not be evaluated in the absence of single-enzyme treatments. These physicochemical differences may also be associated with the variations in the functional constituents of the hydrolysates, as discussed in the following sections.
The effects of the enzyme combination on the TPC and DPPH radical scavenging activity were evaluated for multi-enzyme treatments (Fig. 2A and 2B).
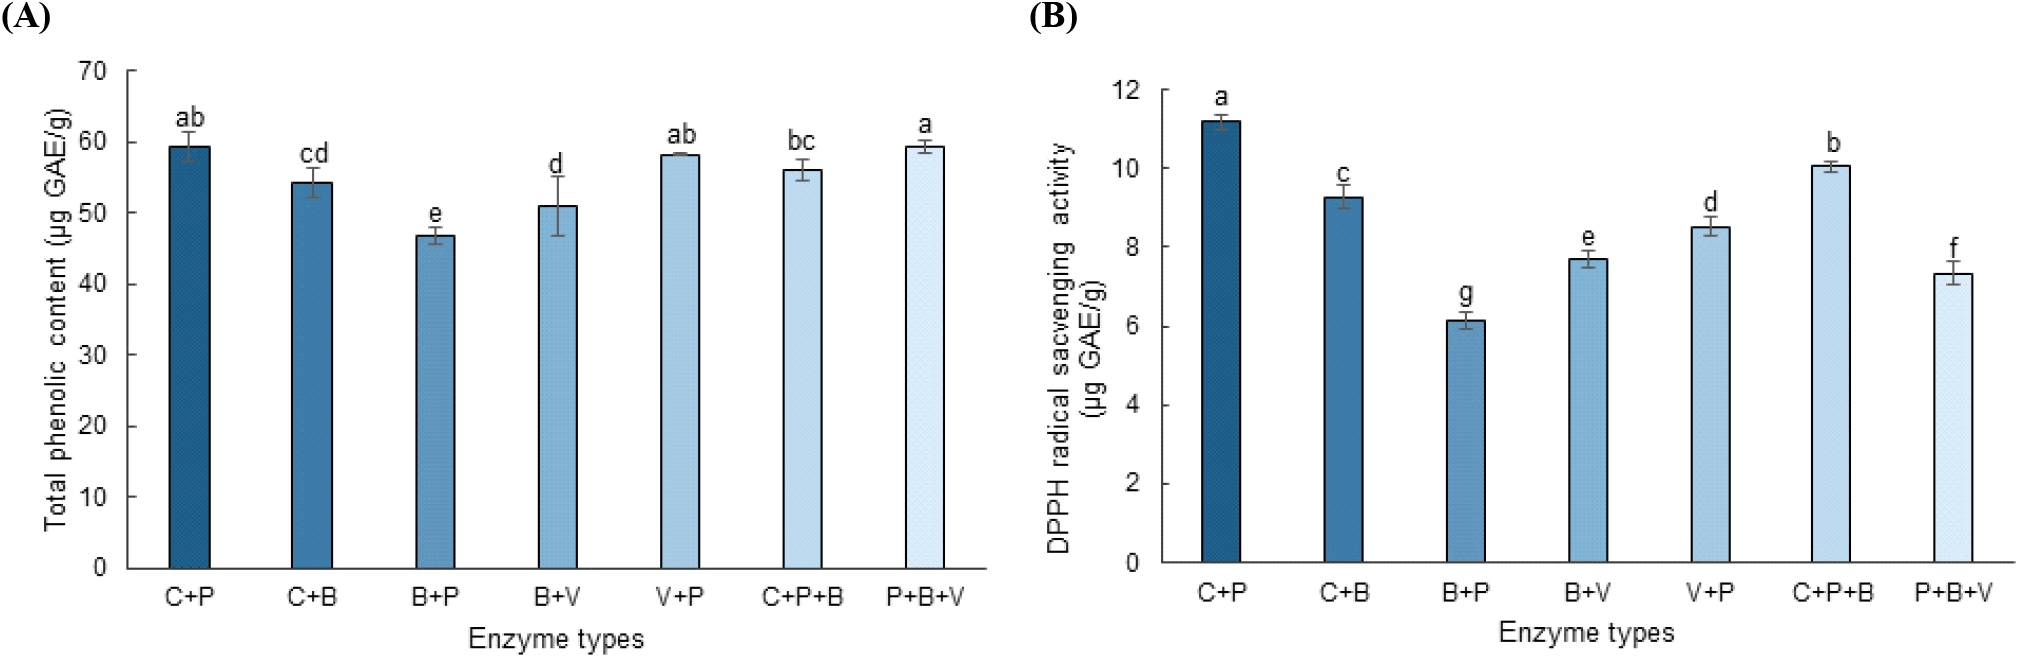
The enzyme combination significantly influenced the TPC (Fig. 2A). The TPC values ranged from 46.67 to 59.29 μg GAE/g across the enzyme combinations, with the highest values observed in the C + P (59.20 μg GAE/g) and P + B + V (59.29 μg GAE/g) treatments. The increase in the TPC may be attributed to the enzymatic degradation of plant cell-wall structures and the enhanced release or solubilization of phenolic compounds present in bound forms or associated with structural polysaccharides. Bound phenolics can interact with cell-wall components, such as cellulose, hemicellulose, pectin, and lignin, limiting their extractability from intact tissues, whereas enzymatic degradation of these matrices can increase their accessibility (Acosta-Estrada et al., 2014; Shahidi and Yeo, 2016; Wang et al., 2017). Thus, the higher TPC observed in the selected enzyme combinations likely reflects the complementary actions of cellulolytic, pectinolytic, and hemicellulolytic enzymes on different components of the ginseng cell-wall matrix. Similar mechanisms have been reported for enzyme-assisted extraction (Kim et al., 2007).
The DPPH radical scavenging activity also differed among enzyme combinations, ranging from 6.13 to 11.19 μg GAE/g (Fig. 2B). The highest activity was observed in the C + P treatment (11.19 μg GAE/g), followed by C + P + B (10.05 μg GAE/g) and C + B (9.27 μg GAE/g). This enhanced antioxidant activity may be attributed to the increased release of phenolic compounds and other antioxidant constituents during enzymatic hydrolysis. However, because other antioxidant constituents may also be released or transformed during enzymatic treatment, the observed antioxidant capacity cannot be solely attributed to phenolic compounds.
Overall, these results indicate that the antioxidant properties varied depending on the enzyme combination, with the selected multi-enzyme treatments demonstrating relatively high TPCs and DPPH radical scavenging activities.
The acidic polysaccharide content varied markedly depending on the enzyme combination (Fig. 3). The acidic polysaccharide content ranged from 286.27 to 1,365.67 μg GAAE/g across the enzyme combinations. The C + B treatment resulted in the highest acidic polysaccharide content, suggesting that this enzyme combination enhanced the solubilization or extractability of acidic polysaccharide-containing components from the CMG matrix. In contrast, substantially lower values were observed for several treatments containing Pectinex or Viscozyme, including C + P (286.27 μg GAAE/g).
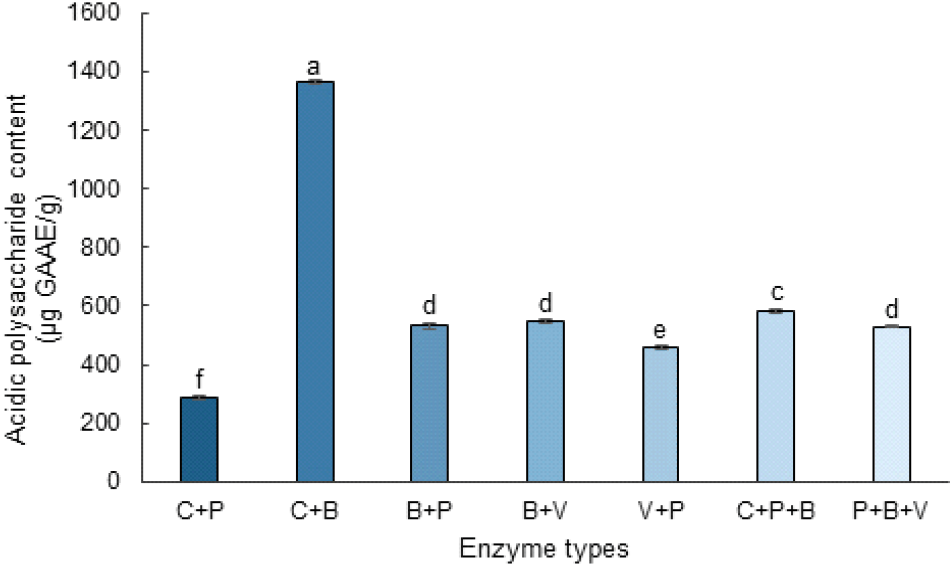
These contrasting responses likely reflect differences in the manner in which individual enzyme combinations affect the extraction and integrity of the polysaccharide fractions. Enzyme-assisted extraction can increase the accessibility and release of plant polysaccharides through the degradation of cell-wall-associated components, while the resulting polysaccharide yield and molecular characteristics depend strongly on the enzyme system employed. In Korean ginseng, enzyme-assisted extraction using cellulase and α-amylase reportedly alters both the monosaccharide composition and molecular-weight distribution of extracted polysaccharides, compared with conventional hot-water extraction (Song et al., 2018a). Similarly, pectinase-assisted extraction reportedly modifies the physicochemical characteristics and molecular weight distribution of plant polysaccharides (Song et al., 2018b).
Accordingly, the lower acidic polysaccharide values observed in some Pectinex- or Viscozyme-containing treatments may be associated with differences in polysaccharide solubilization, extraction efficiency, or enzymatic modification of the polysaccharide fractions. Because the molecular weight distribution, monosaccharide composition, and structural characteristics were not directly determined in this study, the specific mechanisms underlying these changes cannot be conclusively established. However, the observed variation in the acidic polysaccharide content indicated that the amount of measurable acidic polysaccharides differed depending on the enzyme combination.
Fig. 4 shows the effects of multi-enzyme treatment on the XO inhibitory activity of the CMG hydrolysates. The XO inhibitory activity ranged from 24.5% to 29.4%, indicating that the inhibitory response varied depending on the enzyme combination applied.
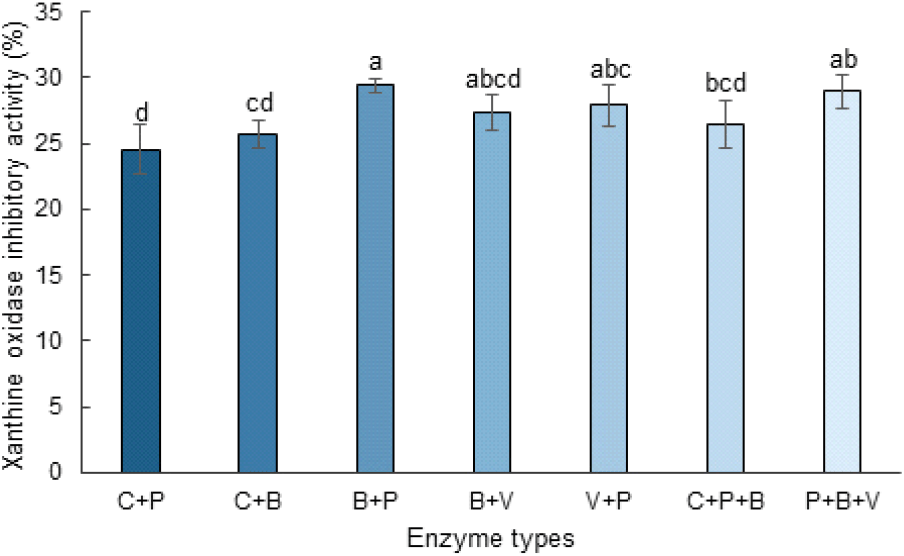
The B + P group exhibited the highest XO inhibitory activity (29.4%), followed by the P + B + V (29.0%), V + P (27.9%), B + V (27.3%), and C + P + B (26.5%) groups. In contrast, C + P (24.5%) and C + B (25.8%) exhibited relatively low inhibitory activities. Statistical analysis revealed that the B + P treatment resulted in significantly higher activity than the C + P treatment (p < 0.05), whereas no significant differences were observed among the B + V, V + P, C + P + B, and P + B + V treatments.
Enzymatic treatment of ginseng can reportedly alter the composition and extractability of its bioactive constituents, including the conversion of major ginsenosides into less glycosylated forms (Choi et al., 2014). Phenolic compounds reportedly also exhibit XO-inhibitory activity, although their inhibitory potency varies considerably depending on their chemical structures (Mehmood et al., 2022). Therefore, the differences in the XO-inhibitory activity among the enzyme-treated samples may be associated with enzyme-dependent differences in the composition or availability of bioactive constituents. However, because the compounds responsible for XO inhibition were not directly identified in this study, a causal relationship between the changes in specific phenolic compounds or ginsenosides and XO inhibition could not be established.
Among the tested enzyme combinations, the B + P and P + B + V groups demonstrated relatively high XO inhibitory activities; however, these differences should be interpreted as enzyme combination-dependent responses rather than synergistic effects. Because allopurinol was not included as a positive control and concentration-dependent assays and IC50 determination were not performed, the inhibitory potency of the CMG hydrolysates could not be directly compared with that of established XO inhibitors (Mehmood et al., 2022). Further studies using an appropriate positive control and IC50 analysis are needed to clarify the biological relevance of the observed XO inhibition.
The changes in ginsenoside profiles under different multi-enzyme treatments were evaluated to investigate the influence of enzyme composition on major, intermediate, and minor ginsenosides (Fig. 5).
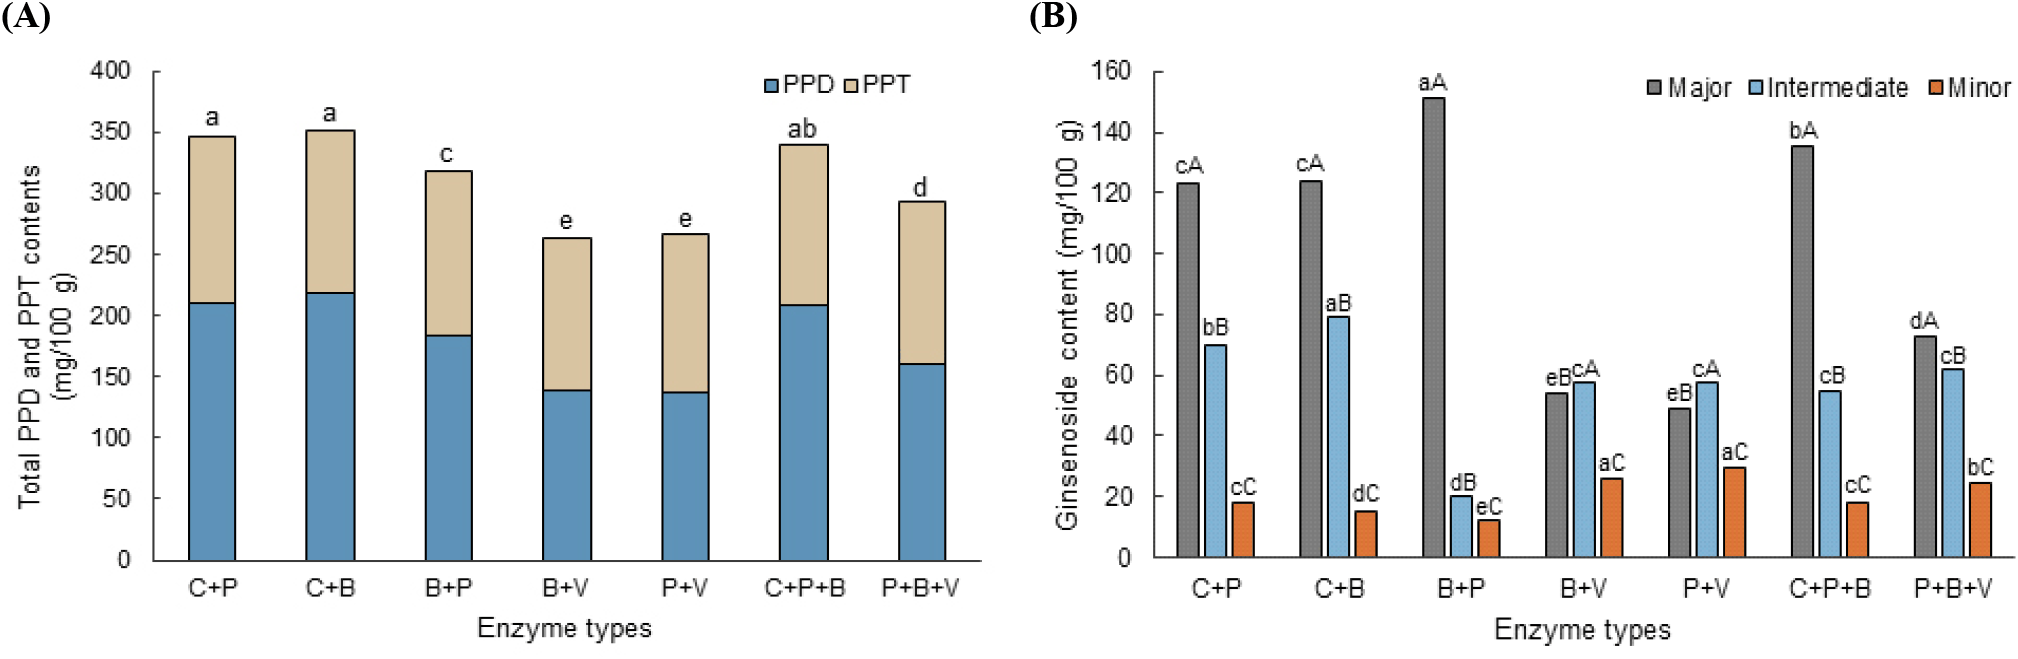
Significant changes in ginsenoside profiles were observed depending on the enzyme composition (Table 3). Major PPD-type ginsenosides, including Rb1, Rb2, and Rc, were substantially reduced after several multi-enzyme treatments. For example, Rc and Rb2 exhibited relatively low contents in the P + V treatment (14.77 and 16.26 mg/100 g, respectively). These results indicate that multi-enzyme treatment altered the levels of major glycosylated ginsenosides.
C + P, Celluclast + Pectinex (1:1, v/v); C + B, Celluclast + BAN (1:1, v/v); B + P, BAN + Pectinex (1:1, v/v); B + V, BAN + Viscozyme (1:1, v/v); V + P, Viscozyme + Pectinex (1:1, v/v); C + P + B, Celluclast + Pectinex + BAN (1:1:1, v/v/v); P + B + V, Pectinex + BAN + Viscozyme (1:1:1, v/v/v).
Different uppercase letters (A-K) indicate significant differences among enzyme treatments within the same ginsenoside compound (p < 0.05), whereas different lowercase letters (a-k) indicate significant differences among ginsenoside compounds within the same enzyme treatment (p < 0.05), based on Duncan’s multiple range test.
Intermediate and minor ginsenosides also exhibited distinct trends depending on the enzyme combination. Rd, a known intermediate in the PPD conversion pathway, exhibited the highest content in the C + B treatment (79.07 mg/100 g), followed by the C + P treatment (70.04 mg/100 g). These results indicated that Rd levels varied according to the enzyme combination; however, the specific enzymatic reactions responsible for these differences could not be determined from the present data. Notably, F2 exhibited substantial differences among the treatments, reaching 13.64 mg/100 g in B + V and the highest content of 17.38 mg/100 g in P + V. The relatively high F2 levels observed in these treatments suggest that the formation or accumulation of F2 was influenced by enzyme composition. In contrast, CK exhibited relatively limited variation (4.40-6.03 mg/100 g), indicating that its response to the tested enzyme treatments differed from that of F2. The total ginsenoside content also varied considerably among the enzyme treatments (263.41-351.30 mg/100 g; Table 3). The lower total ginsenoside content observed in some treatments may reflect further conversion into ginsenosides or metabolites that were not quantified in this study; however, possible analytical or recovery-related differences cannot be excluded. Therefore, the decrease in the total ginsenoside content should not be interpreted solely as degradation or conversion of the quantified ginsenosides.
The observed changes are consistent with previously reported sequential bioconversion pathways of PPD-type ginsenosides, including Rb1 → Rd → F2 → CK (Hasegawa, 2004; Park et al., 2010). However, the decrease in major ginsenosides and the differences in the intermediate and minor ginsenoside levels observed in this study did not directly demonstrate individual conversion pathways. Further analyses of reaction intermediates and their enzyme-specific activities are required to confirm the underlying transformation mechanisms.
In addition to PPD-type ginsenosides, changes in PPT-type ginsenosides were also observed (Table 3 and Fig. 5A). Rg1 exhibited relatively high contents in the P + V (64.19 mg/100 g) and P + B + V (63.91 mg/100 g) treatments. Conversely, Re and Rf exhibited relatively smaller variations among the tested treatments. These results indicate that individual PPT-type ginsenosides respond differently to multi-enzyme treatments.
Overall, the observed ginsenoside profiles were strongly dependent on the enzyme composition. In particular, enzyme combinations containing viscozymes resulted in relatively high F2 levels, whereas the levels of other ginsenosides exhibited different patterns depending on the enzyme combination (Fig. 5B). These findings indicate that the selection of enzyme combination is an important factor affecting the resulting ginsenoside profile. However, the present experimental design does not allow additive and synergistic effects to be distinguished quantitatively.
Therefore, the observed changes should be interpreted as enzyme combination-dependent responses rather than as evidence of synergistic interactions. Further studies comparing individual and combined enzyme treatments using quantitative approaches are required to determine whether additive or synergistic interactions contribute to ginsenoside bioconversion. However, the present results indicate that selected multi-enzyme systems can alter ginsenoside profiles and increase the levels of selected minor ginsenosides, particularly F2.
4. Conclusions
This study demonstrated that the enzyme type plays an important role in determining the physicochemical characteristics, functional properties, and ginsenoside bioconversion of CMG hydrolysates. The physicochemical and functional properties, including soluble sugar content, antioxidant activity, acidic polysaccharide content, and XO inhibitory activity, varied among the tested enzyme combinations. Furthermore, distinct ginsenoside profiles were observed among the enzyme combinations, with differences in the major and minor ginsenoside contents. Among the enzyme systems evaluated, P + V exhibited the highest F2 content, whereas the C + B treatment resulted in the highest acidic polysaccharide content and the B + P treatment exhibited the strongest XO inhibitory activity. These findings indicate that the effects of enzymatic treatment are strongly dependent on the specific enzyme combination, and that selected multi-enzyme systems may provide a useful strategy for modifying the functional and compositional characteristics of CMG. However, the present experimental design did not establish synergistic interactions between the enzymes, and the observed responses should be interpreted as combination-dependent effects. Future studies should focus on elucidating the specific enzymatic pathways involved in ginsenoside conversion and on evaluating the biological activities of the resulting hydrolysates.


