

1. Introduction
In Asian food cultures, sea grapes (Caulerpa lentillifera) have long been valued as edible marine macroalgae and are often referred to as green caviar. They are commonly eaten fresh, served in salads, or incorporated into functional food products (de Gaillande et al., 2017; Syakilla et al., 2022; Zubia et al., 2020). Their distinctive bead-like appearance, crisp texture, and mildly saline taste have helped broaden consumer interest in both domestic and international markets (de Gaillande et al., 2017; Nofiani et al., 2018).
In addition to its culinary appeal, Caulerpa lentillifera offers considerable nutritional value. The species is rich in proteins, dietary fiber, essential minerals, unsaturated fatty acids, pigments, phenolic compounds, and carotenoids, many of which have been linked to antioxidant properties and potential health-promoting effects (Balasubramaniam et al., 2020; Long et al., 2020; Ngadiarti et al., 2022; Nguyen et al., 2011; Pangestuti et al., 2025; Pérez-Gálvez et al., 2020; Sansone and Brunet, 2020). Owing to this combination of sensory attributes, nutritional composition, and functional characteristics, interest in sea grapes has expanded in recent years, particularly in the context of sustainable marine resources for fresh consumption, nutraceutical development, and value-added food applications (Holdt and Kraan, 2011; Leandro et al., 2020; Rushdi et al., 2020; Sansone and Brunet, 2020).
Despite their commercial promise, sea grapes are difficult to maintain in fresh condition after harvest. Quality deterioration can occur rapidly during postharvest handling, with visible changes such as pigment fading, surface browning, and tissue softening, together with gradual losses of functional compounds. The characteristic bright green color of sea grapes is largely associated with chlorophyll pigments, whereas phenolic compounds and carotenoids contribute to antioxidant capacity and nutritional value. These quality-related components are sensitive to heat, oxygen exposure, tissue disruption, and endogenous enzyme activity (Balasubramaniam et al., 2020; Nguyen et al., 2011; Othman et al., 2019; Sansone and Brunet, 2020; Simões et al., 2015).
Among the endogenous enzymes involved in quality deterioration, polyphenol oxidase (PPO) and peroxidase (POD) are particularly important because they promote phenolic oxidation and enzymatic browning. Chlorophyllase also contributes to the loss of green color by hydrolyzing chlorophyll molecules. For this reason, an appropriate pretreatment step is needed before sea grapes are subjected to drying, freezing, or refrigerated storage. Blanching and steaming are widely used thermal pretreatments in food processing because they can suppress deteriorative enzymes, reduce microbial load, and improve product stability. Hot-water blanching is simple and efficient, but direct contact with water may promote the leaching of soluble nutrients and phytochemicals. Steaming reduces this drawback by transferring heat without immersing the tissue in water, allowing heat-sensitive constituents to be better retained while still achieving enzyme suppression. Similar advantages of steaming over hot-water blanching, particularly in relation to pigment and antioxidant retention, have been reported in vegetables, fruits, and edible seaweeds (Corsetto et al., 2020; Nurjanah et al., 2019).
Although Caulerpa lentillifera has gained increasing commercial value, information on pretreatment conditions capable of preserving its overall quality remains limited. Previous studies have largely focused on individual quality attributes, such as pigment retention, drying behavior, or antioxidant activity. Far less attention has been given to studies that evaluate bioactive compounds, endogenous deteriorative enzymes, lipid quality, and amino acid retention within the same experimental framework. In particular, systematic comparisons between blanching and steaming are still lacking, especially in relation to the trade-off between enzyme suppression and the preservation of nutritional, functional, and sensory-related attributes in sea grapes. Establishing evidence-based pretreatment conditions is therefore essential for supporting the industrial use of this high-value marine crop (Holdt and Kraan, 2011; Rushdi et al., 2020; Sansone and Brunet, 2020). To the best of our knowledge, no previous study has simultaneously evaluated pigment stability, phenolic compounds, endogenous enzymes, lipid quality, and amino acid retention under identical pretreatment conditions in Caulerpa lentillifera.
Accordingly, the present work compared blanching and steaming applied for different durations to determine their effects on pigments, phenolic compounds, antioxidant capacity, residual endogenous enzyme activities, fatty acid profiles, and amino acid profiles in sea grapes (Caulerpa lentillifera). The results are intended to support the selection of appropriate pretreatment conditions for sea grape products intended for chilled storage, freezing, drying, or further value-added processing.
2. Materials and methods
All chemicals and reagents used in this study were of analytical grade or higher unless otherwise stated. Folin-Ciocalteu reagent (1.9-2.1 N; Cat. No. F9252), gallic acid (97.5-102.5%, titration; Cat. No. G7384), quercetin (≥ 95%, HPLC; Cat. No. Q4951), 2,2-diphenyl-1-picrylhydrazyl (DPPH; Cat. No. D9132), 2,4,6-tripyridyl-s-triazine (TPTZ; ≥ 98%; Cat. No. T1253), catechol (≥ 99%; Cat. No. C9510), guaiacol (≥ 98%; Cat. No. G5502), hydrogen peroxide solution (30%, w/w; Cat. No. H1009), polyvinylpolypyrrolidone (PVPP; Cat. No. 77627), Triton X-100 (molecular biology grade; Cat. No. T8787), ethylenediaminetetraacetic acid (EDTA; ≥ 99%; Cat. No. EDS), dithiothreitol (DTT; ≥ 98%, HPLC; Cat. No. D0632), and chlorophyll a (≥ 85%, HPLC; Cat. No. C5753) were obtained from Sigma-Aldrich (St. Louis, MO, USA).
Sodium carbonate, sodium nitrite, sodium hydroxide, potassium ferricyanide, trichloroacetic acid, ferric chloride, ferrous sulfate, sodium acetate, anhydrous sodium sulfate, HEPES, hydrochloric acid, and phosphate buffer salts were of analytical or ACS grade and were obtained from Merck (Darmstadt, Germany).
Methanol (HPLC grade, ≥ 99.9% by GC; Cat. No. A452-4) and acetonitrile (HPLC grade; Cat. No. A998-4) were obtained from Fisher Chemical, Fisher Scientific (Loughborough, UK). Acetone, hexane, and chloroform were of analytical or chromatographic grade, as appropriate, and were also obtained from Fisher Scientific.
For fatty acid analysis, boron trifluoride-methanol solution (14% BF3 in methanol; Cat. No. B1252) was obtained from Sigma-Aldrich, and the Supelco 37 Component FAME Mix (TraceCERT certified reference material; Cat. No. CRM47885) was obtained from Supelco (Bellefonte, PA, USA). For amino acid analysis, o-phthaldialdehyde (OPA; ≥ 99.0%, HPLC; Cat. No. 79760) and 9-fluorenylmethyl chloroformate (FMOC-Cl; ≥ 99.0%, HPLC; Cat. No. 23186) were obtained from Sigma-Aldrich. Amino Acids Mixture Standard Solution, Type H [CRM] (Product No. 018-27881), used for amino acid identification and quantification, was obtained from FUJIFILM Wako Pure Chemical Corporation (Osaka, Japan). All aqueous solutions and buffers were prepared using distilled or deionized water.
Fresh Caulerpa lentillifera samples were obtained from a commercial marine farm located in southern Thailand and delivered to the laboratory under chilled conditions on the day of harvest. Upon arrival, the samples were sorted to eliminate thalli that were damaged, discolored, or mechanically compromised. The residual material was first washed with seawater and subsequently rinsed with distilled water to remove adhering salts, sand particles, and surface impurities. Surface moisture was gently removed using absorbent paper, after which the samples were allowed to equilibrate at room temperature (25 ± 2°C) prior to pretreatment.
Sea grape samples were randomly assigned to nine treatment groups: untreated control, blanching for 15, 30, 60, and 120 sec (B15, B30, B60, and B120), and steaming for 15, 30, 60, and 120 sec (S15, S30, S60, and S120). Separate sample portions were used for each treatment condition.
For blanching treatments, approximately 100.00 g of sea grapes were immersed in 5.00 L of hot water maintained at 90 ± 1°C, corresponding to a sample-to-water ratio of 1:50 (w/v). The samples were blanched for the designated treatment times of 15, 30, 60, or 120 sec.
For steaming treatments, equivalent sample portions were treated using an electric steaming cabinet (model SCK12-E, Spring Green Evolution Co., Ltd., Bangkok, Thailand). The steamer was operated according to the manufacturer’s instructions, with water added to the reservoir and steam generated under the manufacturer-specified operating conditions. Before each treatment, the steamer was preheated until continuous steam generation was observed. Approximately 100.00 g of sea grapes were evenly spread as a thin single layer on a food-grade stainless-steel wire-mesh tray (17 × 35 cm; mesh opening 1 mm), giving an approximate sample loading density of 0.17 g/cm2. Care was taken to avoid excessive overlapping or stacking of the thalli to allow direct and uniform steam exposure. The samples were steamed for 15, 30, 60, or 120 sec.
Immediately after blanching or steaming, all pretreated samples were cooled in ice water for 1 min to terminate further thermal exposure, drained, and gently blotted to remove excess surface water. Pretreated samples were then divided for fresh analysis or freeze-dried for dry-weight-based analyses.
Blanching at 90 ± 1°C and steaming under atmospheric steam conditions were selected to represent practical short-time thermal pretreatments used in food-processing operations. Hot-water blanching is commonly performed below boiling temperature to reduce excessive tissue softening and leaching losses, whereas atmospheric steaming is typically conducted using saturated steam. The treatment durations of 15, 30, 60, and 120 sec were selected to cover a practical range of mild to relatively severe short-time heat exposures for the delicate thallus tissue of Caulerpa lentillifera. Preliminary observations indicated that treatments longer than 120 sec caused excessive tissue softening and visible quality deterioration; therefore, 120 sec was used as the upper limit in the present study. Because blanching and steaming were conducted under different thermal and operational conditions, the observed differences should be interpreted as treatment effects under the specific conditions tested in this study, rather than as the isolated effect of heating medium at identical temperature.
Moisture content of untreated and pretreated sea grape samples was determined according to the AOAC oven-drying method (AOAC, 2019). Samples were dried at 105°C in a forced-convection drying oven (FED 400, BINDER GmbH, Tuttlingen, Germany) until constant weight was achieved, and moisture content was reported as percentage (%). All analyses were performed in triplicate. The moisture content of each treatment was also used to calculate the corresponding dry matter fraction for fresh-weight conversion of amino acid contents. The dry matter fraction was calculated as follows:
Amino acid contents originally calculated on a dry-weight basis were converted to mg/100 g fresh weight using the corresponding dry matter fraction of each treatment:
The moisture contents and dry matter fractions used for this conversion are provided in Supplementary Table S1.
For dry-weight-based analyses, pretreated samples were frozen at −40°C and dehydrated by vacuum freeze-drying using a freeze dryer (Lyovapor™L-250, BÜCHI Labortechnik AG, Flawil, Switzerland), and subsequently ground into powder. The resulting powder was passed through a 60-mesh sieve and maintained in airtight containers at −20°C prior to analysis.
Pigment composition and endogenous enzyme activities were analyzed using fresh samples immediately after pretreatment. In contrast, freeze-dried powders were used for phytochemical, antioxidant, fatty acid, and amino acid analyses to reduce the influence of moisture variation among treatments.
Pigments were extracted from fresh sea grape samples using chilled 80% acetone under dim light conditions to minimize pigment degradation. Fresh samples were homogenized with chilled 80% acetone using a high-speed homogenizer (T 25 mini control ULTRA-TURRAXⓇ, IKA-Werke GmbH & Co. KG, Staufen, Germany) and centrifuged at 6,000 ×g for 10 min at 4°C using a refrigerated centrifuge (Allegra V-15R, Beckman Coulter, Inc., Brea, CA, USA). The recovered supernatant was collected and used for spectrophotometric analysis. Absorbance was measured at 663, 645, and 470 nm using a UV-visible spectrophotometer (LAMBDA 365, PerkinElmer, Waltham, MA, USA) with 80% acetone as the blank.
Chlorophyll a, chlorophyll b, total chlorophyll, and total carotenoid contents were calculated according to Wellburn (1994). The following equations were used:
where A663, A645, and A470 represent absorbance values at 663, 645, and 470 nm, respectively. Pigment contents were calculated based on extract volume and sample fresh weight and expressed as mg/100 g fresh weight. All analyses were performed in triplicate.
Phenolic compounds were extracted from freeze-dried sea grape powder using 80% methanol following previously reported procedures with slight modifications (Chotimarkorn et al., 2008; Iqbal et al., 2005). Powdered samples (1.00 g) were mixed with 20.00 mL of 80% methanol and extracted at room temperature (25 ± 2°C) for 2 h under orbital shaking at 150 rpm using an orbital shaker [GS-30, Hangzhou Miu Instruments Co., Ltd. (MIULAB), Hangzhou, China]. After centrifugation at 6,000 ×g for 10 min at 4°C using a refrigerated centrifuge (Allegra V-15R, Beckman Coulter, Inc., Brea, CA, USA), the supernatant was collected and used for determination of total phenolic content (TPC), total flavonoid content (TFC), DPPH radical scavenging activity, ferric reducing antioxidant power (FRAP), and reducing power. The extracts were stored at −20°C until analysis.
TPC was determined using the Folin-Ciocalteu colorimetric method following Singleton et al. (1999), with slight modifications (Chotimarkorn et al., 2008; Iqbal et al., 2005). Prior to analysis, the methanolic extract was diluted 5-fold with 80% methanol to obtain an absorbance within the range of the gallic acid calibration curve. Briefly, 0.20 mL of diluted extract was mixed with 1.00 mL of 10-fold diluted Folin-Ciocalteu reagent. After standing for 5 min at room temperature, 0.80 mL of 7.5% (w/v) sodium carbonate solution was added. The reaction mixture was mixed thoroughly and incubated in the dark at room temperature for 30 min for color development. Absorbance was measured at 750 nm using a UV-visible spectrophotometer (LAMBDA 365, PerkinElmer, Waltham, MA, USA).
Gallic acid was used as the calibration standard. A standard curve was prepared over the concentration range of 0-100 μg/mL, and the calibration equation was y = 0.0098x + 0.0185, with a coefficient of determination (R2) of 0.9987, where y represents absorbance at 750 nm and x represents gallic acid concentration (μg/mL). TPC was calculated using the following equation:
where C is the gallic acid equivalent concentration obtained from the calibration curve (mg/mL), V is the total extract volume (mL), DF is the dilution factor, and m is the sample weight used for extraction (g, dry weight basis). Results were expressed as mg gallic acid equivalents (GAE)/g dry weight. All analyses were performed in triplicate.
TFC was evaluated using the colorimetric assay described by Jia et al. (1999) with slight modifications (Chotimarkorn et al., 2008). Prior to analysis, the methanolic extract was diluted 5-fold with 80% methanol. Briefly, 0.50 mL of diluted extract was mixed with 2.00 mL of distilled water and 0.15 mL of 5% (w/v) sodium nitrite solution. After standing for 5 min at room temperature, 0.15 mL of 10% (w/v) aluminum chloride solution was added. The mixture was allowed to react for 6 min, followed by the addition of 1.00 mL of 1 M sodium hydroxide. The final volume was adjusted to 5.00 mL with distilled water, mixed thoroughly, and absorbance was measured at 510 nm using a UV-visible spectrophotometer (LAMBDA 365, PerkinElmer, Waltham, MA, USA). Quercetin was used as the calibration standard. A standard curve was prepared over the concentration range of 0-100 μg/mL, and the calibration equation was y = 0.001x + 0.040, with a R2 of 0.996, where y represents absorbance at 510 nm and x represents quercetin concentration (μg/mL). TFC values were expressed as mg quercetin equivalents (QE)/g dry weight. All analyses were performed in triplicate.
DPPH radical scavenging activity was determined according to the method of Brand-Williams et al. (1995) with minor modifications (Chotimarkorn et al., 2008). The methanolic extract was diluted 5-fold with 80% methanol to obtain a diluted extract concentration of 10.00 mg dry sample equivalent/mL. Briefly, 0.10 mL of diluted extract was mixed with 3.90 mL of 0.1 mM 2,2-diphenyl-1-picrylhydrazyl (DPPH) solution prepared in methanol, giving a final extract concentration of 0.25 mg dry sample equivalent/mL in the reaction mixture. The reaction mixture was kept in the dark at room temperature for 30 min, and absorbance was measured at 517 nm using a UV-visible spectrophotometer (LAMBDA 365, PerkinElmer, Waltham, MA, USA). A control was prepared by replacing the extract with 80% methanol. Radical scavenging activity was calculated as follows:
where Acontrol is the absorbance of the control and Asample is the absorbance of the reaction mixture containing the extract. All analyses were conducted in triplicate.
FRAP was determined according to the method of Benzie and Strain (1996) with minor modifications (Seleshe et al., 2022). Fresh FRAP reagent was prepared by mixing 300 mM acetate buffer (pH 3.6), 10 mM 2,4,6-tripyridyl-s-triazine (TPTZ) solution prepared in 40 mM HCl, and 20 mM FeCl3·6H2O solution at a ratio of 10:1:1 (v/v/v). The methanolic extract was diluted 5-fold with 80% methanol to obtain a diluted extract concentration of 10.00 mg dry sample equivalent/mL. Briefly, 0.10 mL of diluted extract was mixed with 3.00 mL of freshly prepared FRAP reagent, giving a final extract concentration of 0.32 mg dry sample equivalent/mL in the reaction mixture. The reaction mixture was maintained in the dark at room temperature for 30 min, and absorbance was measured at 593 nm using a UV-visible spectrophotometer (LAMBDA 365, PerkinElmer, Waltham, MA, USA). Ferrous sulfate was used as the calibration standard over the concentration range of 0-1,000 μM, and FRAP values were expressed as mg Fe2⁺ equivalents/g dry weight. All analyses were conducted in triplicate.
Reducing power was evaluated according to the method of Yen and Duh (1993) with minor modifications (Chotimarkorn et al., 2008). The methanolic extract was diluted 5-fold with 80% methanol to obtain a diluted extract concentration of 10.00 mg dry sample equivalent/mL. Briefly, 1.00 mL of diluted extract was mixed with 2.50 mL of 0.2 M sodium phosphate buffer (pH 6.6) and 2.50 mL of 1% (w/v) potassium ferricyanide solution, giving an extract concentration of 1.67 mg dry sample equivalent/mL in the initial reaction mixture. The mixture was incubated at 50°C for 20 min. The reaction was terminated by adding 2.50 mL of 10% (w/v) trichloroacetic acid, and the mixture was centrifuged at 6,000 ×g for 10 min using a refrigerated centrifuge (Allegra V-15R, Beckman Coulter, Inc., Brea, CA, USA). The recovered supernatant (2.50 mL) was mixed with 2.50 mL of distilled water and 0.50 mL of 0.1% (w/v) ferric chloride solution. Absorbance was measured at 700 nm using a UV-visible spectrophotometer (LAMBDA 365, PerkinElmer, Waltham, MA, USA). Reducing power was reported as absorbance at 700 nm, and all analyses were conducted in triplicate.
Crude enzyme extract was prepared from fresh sea grape tissue under chilled conditions, with modifications based on previously reported enzyme extraction procedures (Díaz et al., 2001; Kim and Kim, 2013; Kraj, 2015). Briefly, 5.00 g of fresh sample was homogenized with 25 mL of cold 50 mM potassium phosphate buffer (pH 7.0), corresponding to a sample-to-buffer ratio of 1:5 (w/v). The extraction buffer contained 2% (w/v) polyvinylpolypyrrolidone (PVPP), 1% (v/v) Triton X-100, 1 mM ethylenediaminetetraacetic acid (EDTA), and 1 mM dithiothreitol (DTT). Homogenization was performed in a 50.00 mL glass beaker placed in an ice bath using a high-speed homogenizer (T 25 mini control ULTRA-TURRAXⓇ, IKA-Werke GmbH & Co. KG, Staufen, Germany) at 12,000 rpm for 2 min. The homogenate was then centrifuged at 10,000 ×g for 20 min at 4°C using a refrigerated centrifuge (Allegra V-15R, Beckman Coulter, Inc., Brea, CA, USA). The resulting supernatant was collected and used immediately as the crude enzyme extract for determination of polyphenol oxidase (PPO), peroxidase (POD), and chlorophyllase activities. All extraction procedures were carried out under chilled conditions.
PPO activity was evaluated following the procedure of Kim and Kim (2013) with slight modifications using catechol as the reaction substrate. The reaction mixture consisted of 2.70 mL of 50 mM HEPES-KOH buffer (pH 7.0), 0.20 mL of 100 mM catechol solution, and 0.10 mL of crude enzyme extract, giving a final volume of 3.00 mL. The reaction mixture was maintained at 20°C, and the increase in absorbance at 420 nm was monitored for 3 min using a UV-visible spectrophotometer (LAMBDA 365, PerkinElmer, Waltham, MA, USA). PPO activity was calculated from the initial linear rate of absorbance increase (ΔA420/min). A blank was prepared by replacing the crude enzyme extract with extraction buffer. Residual PPO activity was expressed as percentage activity relative to the untreated control, which was assigned a value of 100%. All measurements were performed in triplicate.
Peroxidase (POD) activity was evaluated following the procedure described by Díaz et al. (2001) with slight modifications using guaiacol and hydrogen peroxide as substrates. The reaction mixture consisted of 2.70 mL of 50 mM potassium phosphate buffer (pH 6.0), 0.10 mL of 100 mM guaiacol solution, 0.10 mL of 100 mM hydrogen peroxide solution, and 0.10 mL of crude enzyme extract, giving a final volume of 3.00 mL. The reaction was initiated by the addition of hydrogen peroxide and maintained at 25°C. The increase in absorbance at 470 nm was monitored for 3 min using a UV-visible spectrophotometer (LAMBDA 365, PerkinElmer, Waltham, MA, USA). POD activity was calculated from the initial linear rate of absorbance increase (ΔA470/min). A blank was prepared by replacing the crude enzyme extract with extraction buffer. Residual POD activity was expressed as percentage activity relative to the untreated control, which was assigned a value of 100%. All measurements were conducted in triplicate.
Chlorophyllase activity was determined according to the method of Kraj (2015) with minor modifications using chlorophyll a as the reaction substrate. The reaction mixture consisted of 1.40 mL of 50 mM potassium phosphate buffer (pH 7.0), 0.20 mL of 0.25% (v/v) Triton X-100, 0.20 mL of chlorophyll a substrate solution (0.5 mg/mL in acetone), and 0.20 mL of crude enzyme extract, giving a final volume of 2.00 mL. The reaction mixture was incubated at 37°C for 15 min. The reaction was terminated by adding 4.00 mL of hexane:acetone solution (6:4, v/v), followed by vigorous mixing and centrifugation at 6,000 ×g for 5 min using a centrifuge (Allegra V-15R, Beckman Coulter, Inc., Brea, CA, USA) to facilitate phase separation. Chlorophyllide formation in the acetone phase was quantified spectrophotometrically at 667 nm using an extinction coefficient of 76.79 mM−1 cm−1. A blank was prepared by replacing the crude enzyme extract with extraction buffer. Chlorophyllase activity was calculated based on the amount of chlorophyllide formed per min. Residual chlorophyllase activity was expressed as percentage activity relative to the untreated control, which was assigned a value of 100%. All measurements were performed in triplicate.
Total lipids were extracted from freeze-dried sea grape samples according to the method of Folch et al. (1957), using chloroform:methanol (2:1, v/v), with slight modifications. Briefly, homogenized freeze-dried samples were mixed with the extraction solvent, and the lipid-containing organic phase was separated, filtered, and concentrated under reduced pressure at 40°C using a rotary evaporator (Rotavapor R-300, BÜCHI Labortechnik AG, Flawil, Switzerland). The recovered lipid fraction was flushed with nitrogen and stored at −20°C until fatty acid methyl ester (FAME) preparation.
Fatty acid methyl esters were prepared according to AOCS Official Method CE 2-66 (AOCS, 2009b), with minor modifications adapted from previous studies (Chotimarkorn et al., 2010; Chotimarkorn and Punvichai, 2025). Briefly, approximately 50.00 mg of extracted lipid was treated with methanolic sodium hydroxide, followed by methylation with 14% boron trifluoride (BF3) in methanol. The resulting FAMEs were extracted with hexane, washed with distilled water, and dried over anhydrous sodium sulfate prior to chromatographic analysis.
FAMEs were analyzed using a gas chromatograph equipped with a flame ionization detector (GC-FID; GC-17A, Shimadzu Corporation, Kyoto, Japan), with reference to AOCS Official Method Ce 1j-07 (AOCS, 2009a). Separation was performed on a DB-Wax fused-silica capillary column (30 m × 0.25 mm i.d., 0.25 μm film thickness; J&W Scientific, USA). The oven temperature was initially maintained at 150°C for 1 min, increased to 240°C at a rate of 1°C/min, and held at 240°C for 20 min. Helium was used as the carrier gas at a constant flow rate of 1.0 mL/min. The injector and flame ionization detector temperatures were both maintained at 250°C. A 1.0 μL aliquot of the FAME solution was injected in split mode at a split ratio of 50:1.
Individual fatty acids were identified by comparing their retention times with those of an authentic FAME reference mixture (Supelco 37 Component FAME Mix, Supelco, Bellefonte, PA, USA). Relative fatty acid composition was determined by peak-area normalization and expressed as relative peak area (%). Identified fatty acids were subsequently classified as saturated fatty acids (SFA), monounsaturated fatty acids (MUFA), or polyunsaturated fatty acids (PUFA). The PUFA/SFA and ω6/ω3 ratios were calculated from the corresponding fatty acid fractions. Minor unresolved chromatographic peaks that could not be assigned to specific fatty acids were reported as Unknown. All determinations were performed in triplicate.
Amino acid composition was determined following acid hydrolysis and high-performance liquid chromatography (HPLC) analysis, with modifications based on previously reported amino acid chromatographic methods (Aquino et al., 2008; Chotimarkorn and Punvichai, 2024; Chotimarkorn et al., 2010). Freeze-dried sea grape samples were finely ground, and approximately 0.50 g was accurately weighed into hydrolysis tubes. Each sample was mixed with 10 mL of 6 M hydrochloric acid (HCl), flushed with nitrogen to minimize oxidative changes during hydrolysis, tightly sealed, and hydrolyzed at 110°C for 24 h in a temperature-controlled oven. After hydrolysis, the samples were cooled to room temperature, filtered through Whatman No. 1 filter paper, and quantitatively adjusted to a final volume of 25.00 mL with deionized water.
Prior to chromatographic analysis, an aliquot of the hydrolysate was neutralized with 6 M sodium hydroxide (NaOH) to approximately pH 7.0 and subjected to pre-column derivatization with o-phthaldialdehyde (OPA) and FMOC-Cl. OPA was used for derivatization of primary amino acids, whereas FMOC-Cl was used for secondary amino acids, including proline. Amino acids were separated using an HPLC system equipped with a fluorescence detector (LC-20A series, Shimadzu Corporation, Kyoto, Japan) and an HC-C18(2) reversed-phase column (4.6 × 250 mm, 5 μm; Agilent Technologies, Santa Clara, CA, USA).
The mobile phases consisted of sodium acetate buffer (pH 6.8) as solvent A and acetonitrile:methanol:water (45:45:10, v/v/v) as solvent B. Gradient elution was performed at a flow rate of 1.0 mL/min, beginning with 20% solvent B, increasing to 60% B at 20 min, maintaining 60% B until 24 min, increasing to 100% B at 26 min, and maintaining 100% B until 31 min. The mobile phase was subsequently returned to 20% B at 33 min for column re-equilibration. The injection volume was 20 μL. Fluorescence detection was performed using wavelength switching, with excitation and emission wavelengths of 350 and 450 nm, respectively, for OPA-derived amino acids and 266 and 305 nm, respectively, for FMOC-Cl-derived amino acids.
Individual amino acids were identified by comparing their retention times with those of authenticated amino acid standards, and quantification was performed using external calibration curves. Amino acid contents were first calculated on a dry-weight basis and then converted to mg/100 g fresh weight using the dry matter fraction of the corresponding treatment, as described in Section 2.4 and Supplementary Table S1. Individual amino acids were subsequently classified as essential amino acids (EAA) and non-essential amino acids (NEAA). Total EAA, total NEAA, total quantified amino acids, and the EAA/NEAA ratio were calculated from the amino acids quantified under the analytical conditions used in this study. Because conventional acid hydrolysis does not quantitatively recover all amino acids, particularly tryptophan, the summed value was reported as total quantified amino acids rather than total amino acids. All determinations were performed in triplicate.
The experiment was conducted using a completely randomized design (CRD) comprising nine treatments: an untreated control, blanching for 15, 30, 60, and 120 sec, and steaming for 15, 30, 60, and 120 sec. All analyses were performed in triplicate (n = 3), and data are presented as mean ± standard deviation (SD). Differences among the nine treatments were evaluated using one-way analysis of variance (ANOVA), followed by Tukey’s multiple comparison test at p < 0.05.
For the thermally treated samples, a two-way ANOVA was additionally performed using pretreatment method (blanching or steaming) and treatment time (15, 30, 60, or 120 sec) as fixed factors. The main effects of pretreatment method and treatment time, as well as the method × time interaction, were evaluated. The untreated control was excluded from the two-way ANOVA. Statistical significance was considered at p < 0.05. Details of the integrated heatmap and weighted trade-off analysis are provided in Section 2.14.
An integrated heatmap and weighted trade-off analysis was conducted to compare the overall performance of blanching and steaming pretreatments across multiple quality domains. Mean values of selected quality parameters from Tables 1–5 were used for the analysis. The selected parameters were grouped into five domains: pigment retention, antioxidant properties, enzyme suppression, relative lipid quality, and amino acid preservation.
Abbreviations: B15-B120, blanching for 15, 30, 60, and 120 sec, respectively; S15-S120, steaming for 15, 30, 60, and 120 sec, respectively.
Two-way ANOVA was performed using thermally treated samples only (B15-B120 and S15-S120), with the untreated control excluded.
Abbreviations: B15-B120, blanching for 15, 30, 60, and 120 sec, respectively; S15-S120, steaming for 15, 30, 60, and 120 sec, respectively; GAE, gallic acid equivalent; QE, quercetin equivalent; DW, dry weight; FRAP, ferric reducing antioxidant power.
Two-way ANOVA was performed using thermally treated samples only (B15-B120 and S15-S120), with the untreated control excluded.
Abbreviations: B15-B120, blanching for 15, 30, 60, and 120 sec, respectively; S15-S120, steaming for 15, 30, 60, and 120 sec, respectively; PPO, polyphenol oxidase; POD, peroxidase.
Two-way ANOVA was performed using thermally treated samples only (B15-B120 and S15-S120), with the untreated control excluded.
Abbreviations: B15-B120, blanching for 15, 30, 60, and 120 sec, respectively; S15-S120, steaming for 15, 30, 60, and 120 sec, respectively; SFA, saturated fatty acids; MUFA, monounsaturated fatty acids; EPA, eicosapentaenoic acid; DHA, docosahexaenoic acid; PUFA, polyunsaturated fatty acids; PUFA/SFA ratio, ratio of polyunsaturated fatty acids to saturated fatty acids; ω6/ω3 ratio, ratio of omega-6 to omega-3 fatty acids.
The effects of pretreatment method, treatment time, and their interaction were obtained from two-way ANOVA performed using thermally treated samples only (B15-B120 and S15-S120), with the untreated control excluded, and are reported as p-value categories: p ≥ 0.05, p < 0.05, p < 0.01, and p < 0.001. An em dash (—) indicates that the corresponding two-way ANOVA result was not reported for that individual component; two-way ANOVA results are presented only for the summary variables shown in the table.
Values are presented as mean ± SD (n = 3). Fatty acid composition is expressed as relative peak area (%) based on GC-FID peak-area normalization, except for the PUFA/SFA and ω6/ω3 ratios.
Different superscript letters within the same row indicate significant differences among treatments according to Tukey’s multiple comparison test (p < 0.05). Values without superscript letters within the same row are not significantly different (p ≥ 0.05).
Abbreviations: EAA, essential amino acids; NEAA, non-essential amino acids; B15-B120, blanching for 15, 30, 60, and 120 sec, respectively; S15-S120, steaming for 15, 30, 60, and 120 sec, respectively.
The effects of pretreatment method, treatment time, and their interaction were obtained from two-way ANOVA performed using thermally treated samples only (B15-B120 and S15-S120), with the untreated control excluded, and are reported as p-value categories: p ≥ 0.05, p < 0.05, p < 0.01, and p < 0.001. An em dash (—) indicates that the corresponding two-way ANOVA result was not reported for that individual component; two-way ANOVA results are presented only for the summary variables shown in the table.
Because the measured parameters had different units and numerical ranges, all values were converted to normalized scores using min-max normalization. For parameters in which higher values indicated better quality retention, including chlorophylls, carotenoids, phenolic compounds, antioxidant activities, PUFA/SFA ratio, and amino acid contents, the normalized score was calculated as follows:
where x is the observed mean value of a given treatment, xmin is the lowest mean value, and xmax is the highest mean value among treatments for that parameter.
For parameters in which lower values indicated better enzyme suppression, including residual PPO, POD, and chlorophyllase activities, the normalized score was calculated using an inverse transformation:
Thus, all normalized scores were expressed on a 0-100 scale, where higher scores consistently represented better treatment performance.
Normalized scores within each domain were averaged to obtain domain scores. Pigment retention included chlorophyll a, chlorophyll b, total chlorophyll, and total carotenoids. Antioxidant properties included total phenolic content, total flavonoid content, DPPH radical scavenging activity, ferric reducing antioxidant power, and reducing power. Enzyme suppression included the inverse-normalized scores of residual PPO, POD, and chlorophyllase activities. Relative lipid quality was represented by relative fatty acid quality indices, including relative PUFA composition and the PUFA/SFA ratio, based on GC-FID peak area normalization. Because total lipid content and lipid oxidation indices were not determined in the present study, this lipid quality domain was interpreted only as a relative compositional indicator and not as direct evidence of absolute lipid retention or lipid oxidation. Amino acid preservation included essential amino acids, non-essential amino acids, total quantified amino acids, and the EAA/NEAA ratio.
To support interpretation of the processing trade-off among treatments, an overall weighted score was calculated from the five domain scores. The following rationale-based weighting factors were applied: pigment retention, 25%; antioxidant properties, 30%; enzyme suppression, 20%; relative lipid quality, 10%; and amino acid preservation, 15%. These weights were selected to reflect the relative importance of visual quality, functional quality, biochemical stabilization, and nutritional retention in sea grape processing. Pigment retention and antioxidant properties were given higher weights because the commercial and functional value of sea grapes is strongly associated with green appearance and bioactive compound retention. Enzyme suppression was included as an important stabilization factor, but excessive emphasis on this domain alone would favor severe heat treatments that caused greater quality losses. Relative lipid quality and amino acid preservation were included as nutritional quality indicators.
The overall weighted score was calculated as follows:
The heatmap and weighted score were used as an integrated decision-support approach to visualize treatment performance across quality domains. They were not intended to replace the statistical analysis of individual parameters or to define a single universal optimum. The treatment with the highest overall weighted score was interpreted as the condition showing the strongest immediate retention of the measured quality attributes, whereas treatments with lower quality-retention scores but greater enzyme suppression were considered practical compromises when stronger biochemical stabilization was required. Therefore, a treatment with strong quality retention but limited enzyme suppression, or a treatment with strong enzyme suppression but substantial quality loss, was not considered the most favorable overall option.
3. Results and discussion
Thermal pretreatment produced clear changes in the pigment profile of sea grapes, as supported by the one-way ANOVA and the factorial analysis of treated samples (Table 1). The two-way ANOVA indicated that pigment retention was influenced by both heating method and exposure duration. This response was particularly pronounced for chlorophyll a, chlorophyll b, and total chlorophyll, whereas carotenoids showed a smaller method-dependent effect. The significant interaction between method and time for the chlorophyll fractions suggests that pigment degradation was controlled not only by treatment duration but also by the heating medium. Overall, pigment levels decreased with increasing exposure time, but steaming generally preserved higher pigment contents than blanching at comparable treatment durations.
Chlorophyll a was the major chlorophyll fraction in untreated sea grapes, representing approximately 61.70% of total chlorophyll. Its content decreased from 34.88 mg/100 g fresh weight in the untreated control to 27.45 mg/100 g fresh weight after blanching for 120 sec, equivalent to a 21.30% reduction. By comparison, steaming for 120 sec retained a higher chlorophyll a content of 29.59 mg/100 g fresh weight, corresponding to a smaller reduction of 15.20%. Chlorophyll b followed the same direction, decreasing from 21.61 mg/100 g fresh weight in untreated samples to 15.93 mg/100 g fresh weight after blanching for 120 sec and 18.51 mg/100 g fresh weight after steaming for 120 sec. These differences indicate that hot-water blanching caused greater chlorophyll loss than steam exposure under equivalent treatment durations.
Total chlorophyll showed the same treatment-dependent response. The untreated control had the highest total chlorophyll content (56.49 mg/100 g fresh weight), whereas the lowest value was observed after blanching for 120 sec (43.38 mg/100 g fresh weight). Steaming for the same duration resulted in a higher value of 48.10 mg/100 g fresh weight. Under short treatments, steaming for 15-30 sec retained 95.00-97.80% of the initial total chlorophyll, while blanching at the same durations retained 92.30-96.40%. These results indicate that mild steaming was more effective in preserving the green appearance of sea grapes. The significant method × time interaction further suggests that chlorophyll loss became more pronounced as blanching time increased, whereas steam treatment caused a less severe decline.
Retention of green pigments is particularly important for sea grapes because their market value is closely linked to a fresh, bright appearance. During thermal pretreatment, chlorophyll degradation is commonly associated with destabilization of the porphyrin structure, especially displacement of the central magnesium ion, which promotes pheophytin formation and olive-green discoloration. Heat may also disrupt chloroplast membranes and pigment-protein complexes, making pigments more susceptible to oxidation and degradation. The greater chlorophyll loss observed during blanching is therefore likely related to the combined effects of rapid heat transfer, tissue disruption, and pigment leaching into the surrounding hot water (Balasubramaniam et al., 2020; Paul et al., 2014; Wellburn, 1994).
Total carotenoids were more stable than chlorophyll pigments during pretreatment. Their content decreased from 8.75 mg/100 g fresh weight in the untreated control to 7.30 mg/100 g fresh weight after blanching for 120 sec, equivalent to a 16.60% reduction. Steaming for 120 sec retained a slightly higher carotenoid content of 7.62 mg/100 g fresh weight, corresponding to a smaller reduction of 12.90%. This greater stability may be related to the hydrophobic nature of carotenoids and their location within membrane structures, which can limit direct leaching during heating. Under harsher pretreatment conditions, however, prolonged heat exposure may still degrade carotenoids through oxidation or trans-cis isomerization, which could explain the gradual decline observed in the present study (Balasubramaniam et al., 2020; Othman et al., 2019).
The poorer pigment retention after blanching can be explained partly by direct exposure to hot water. During immersion heating, soluble constituents may diffuse into the surrounding water, and the greater tissue disruption may also increase oxidative changes. Steaming avoids continuous water contact; heat is transferred through steam, which appears to lessen tissue damage and improve retention of pigment fractions. Comparable effects have been reported in green vegetables and edible seaweeds, where steaming preserved chlorophylls and carotenoids more effectively than blanching while reducing nutrient losses (Corsetto et al., 2020; Nurjanah et al., 2019). These differences suggest that pigment retention was influenced not only by treatment temperature, but also by heating medium, heat-transfer behavior, and the extent of direct water contact.
These findings indicate that short steaming for 15-30 sec better retained measured pigment attributes immediately after pretreatment than prolonged blanching. However, implications for drying, freezing, refrigerated storage, visual quality, and sensory acceptance require further validation under product-specific processing and storage conditions.
Phenolic composition and antioxidant properties changed markedly after pretreatment (Table 2). Factorial analysis of the thermally treated samples showed that both heating method and exposure time contributed to these responses, with significant method × time interactions across all measured parameters. This indicates that losses of bioactive compounds were shaped not only by treatment duration, but also by the heating medium. As treatment severity increased, phenolic and antioxidant values declined, although steaming generally retained these compounds better than blanching at the same exposure time.
In untreated sea grapes, TPC was 8.35 mg GAE/g dry weight. Thermal pretreatment reduced this value to different extents depending on the method and exposure time. The greatest loss occurred after blanching for 120 sec, where TPC reached 6.94 mg GAE/g dry weight, corresponding to a 16.90% reduction from the control. Steaming for the same duration retained a higher TPC value of 7.34 mg GAE/g dry weight, equivalent to a smaller reduction of 12.10%. Under short exposure times of 15-30 sec, steaming preserved 95.20-96.90% of the initial TPC, compared with 93.5-95.9% under blanching. These differences support the milder effect of steam heating on phenolic retention. The significant method × time interaction further indicates that phenolic loss increased more sharply with blanching time than with steaming time.
TFC followed a comparable trend. Untreated samples contained 7.92 mg QE/g dry weight, while blanching for 120 sec reduced TFC to 6.18 mg QE/g dry weight, equivalent to a 22.00% loss. Steaming for the same duration retained a higher TFC value of 6.49 mg QE/g dry weight, indicating less severe flavonoid degradation. The greater proportional decline in TFC compared with TPC suggests that flavonoids were more vulnerable to heat-induced oxidation, hydrolysis, or structural modification during pretreatment.
The decreases in TPC and TFC were likely driven by several overlapping mechanisms. Many phenolic compounds are water-soluble or partly water-soluble, making them susceptible to diffusion into the surrounding medium during hot-water blanching. Longer exposure to heat may also promote degradation, oxidation, or polymerization of thermolabile phenolics. At the same time, mild heating can sometimes improve extractability by disrupting cellular structures. In the present study, however, the combined effects of leaching, heat exposure, and tissue disruption appear to have outweighed any improvement in extractability, particularly under prolonged blanching. Tissue damage during heating may also increase contact between phenolic substrates and endogenous oxidative enzymes before thermal exposure sufficiently suppresses these enzymes. Together, these mechanisms help explain why phenolic losses were greater under blanching than under steaming (Corsetto et al., 2020; Nurjanah et al., 2019; Windrayani et al., 2023).
Antioxidant activity changed in parallel with the decline in phenolic constituents. DPPH radical scavenging activity decreased from 41.83% in untreated samples to 33.47% after blanching for 120 sec and 34.88% after steaming for 120 sec. A similar reduction was observed for FRAP, which declined from 16.47 mg Fe2+/g dry weight in the control to 13.11 and 13.79 mg Fe2+/g dry weight after blanching and steaming for 120 sec, respectively. Reducing power also decreased, from 0.336 absorbance units in untreated samples to 0.269 after blanching and 0.282 after steaming for 120 sec. Together, these results show that thermal pretreatment reduced both the electron-donating ability and free-radical scavenging potential of sea grape extracts.
The parallel reductions in TPC, TFC, and antioxidant indices point to phenolic compounds as important contributors to the antioxidant capacity of sea grape extracts. This agrees with previous reports on marine macroalgae and edible seaweeds. Although chlorophyll derivatives and carotenoids may also contribute to antioxidant activity, the present findings indicate that phenolic compounds were among the functional constituents most affected by pretreatment (Aina et al., 2022; Ismail et al., 2020; Kumar et al., 2021).
Steaming generally preserved phenolic compounds and antioxidant activity more effectively than blanching, particularly under short treatment times of 15-30 sec. This advantage was likely related to reduced leaching and lower oxidative stress on soluble antioxidants, as the samples were not immersed directly in hot water during steam treatment. Even so, longer steaming times still caused measurable losses, indicating that exposure duration remained important regardless of the heating method.
These findings indicate that short steaming for 15-30 sec better retained phenolic and antioxidant-related attributes immediately after pretreatment than prolonged blanching. Application to refrigerated, frozen, or dried products should be validated in product-specific processing and storage studies.
Residual endogenous enzyme activities changed markedly after pretreatment (Table 3). Factorial analysis showed that both heating method and exposure time significantly affected all measured enzymes, with significant method × time interactions. These results indicate that enzyme suppression depended not only on heating duration, but also on the thermal medium. Across the tested conditions, residual activities declined as treatment severity increased, and blanching produced stronger enzyme suppression than steaming at equivalent exposure times.
Fresh sea grapes naturally contain oxidative and pigment-degrading enzymes that may accelerate postharvest deterioration through browning reactions, chlorophyll breakdown, and loss of functional compounds. In this study, enzyme activities were therefore expressed as residual activity relative to the untreated control, which was assigned a value of 100%. The decline in residual activity after pretreatment shows that thermal processing can help suppress deterioration-related enzymes before storage or subsequent processing.
Among the three enzymes examined, PPO was the most heat-sensitive. After 15 sec of blanching, residual PPO activity declined from 100.00% in the untreated control to 73.12%, and fell further to 18.99% after 120 sec. Steaming caused a milder reduction at the same exposure times, retaining residual PPO activities of 82.53% after 15 sec and 28.42% after 120 sec. This pattern shows that hot-water blanching suppressed PPO activity more strongly than steaming.
PPO is a copper-dependent oxidoreductase that facilitates the conversion of phenolic substrates into quinones, which can further undergo polymerization to form brown pigments. Suppression of PPO activity is therefore essential for minimizing enzymatic browning and maintaining phenolic integrity during storage. The pronounced reduction in PPO activity observed under more intensive thermal treatments corresponds with the decreases in phenolic content and antioxidant capacity presented in Table 2, indicating that thermal exposure simultaneously influenced enzymatic activity and heat-labile functional components (Simões et al., 2015).
POD was more resistant to heat than PPO. Residual POD activity remained at 84.91% after 15 sec of blanching and decreased to 35.72% after 120 sec, while steaming retained 92.23% and 46.81% at the same treatment times, respectively. POD enzymes often include heat-resistant isoforms and are commonly used as indicators of blanching adequacy because they are among the most heat-resistant oxidative enzymes in plant tissues. The relatively high POD activity after mild treatments suggests that short heat exposure may not be sufficient when long-term stabilization is required. However, stronger heating to further suppress POD may also intensify losses of pigments and antioxidant compounds, reinforcing the need to balance enzyme suppression with quality retention (Corsetto et al., 2020; Nurjanah et al., 2019).
Residual chlorophyllase activity also declined as treatment intensity increased. Activity decreased from 100.00% in the untreated control to 26.83% after blanching for 120 sec and to 38.62% after steaming for 120 sec. Chlorophyllase hydrolyzes the phytol chain of chlorophyll molecules, producing chlorophyllide derivatives that are more susceptible to further degradation. Partial suppression of chlorophyllase activity is therefore relevant to color retention in green seaweeds. The lower residual chlorophyllase activity observed after severe treatments suggests better control of enzymatic chlorophyll breakdown, although direct thermal degradation of chlorophyll likely also contributed to pigment loss during prolonged heating.
The significant method × time interactions observed for PPO, POD, and chlorophyllase, indicate that residual activity declined more sharply with increasing blanching time than with steaming time. This pattern may be related to faster heat transfer during hot-water immersion, which would explain the stronger suppression of deterioration-related enzymes under blanching.
Taken together, mild steaming reduced residual enzyme activities to a moderate extent while retaining measured quality attributes more effectively than prolonged blanching. Its role in limiting enzymatic deterioration during storage or downstream processing should be confirmed in future validation studies.
The fatty acid composition and relative lipid quality indices of sea grapes were influenced by thermal pretreatment, with greater changes occurring under more intensive processing conditions (Table 4). Because fatty acid composition was determined by GC-FID peak-area normalization and expressed as relative peak area (%), the results should be interpreted as relative compositional profiles rather than absolute lipid contents. Total lipid content and lipid oxidation indices were not determined in the present study; therefore, changes in fatty acid composition cannot be used as direct evidence of absolute fatty acid retention or lipid oxidation.
Two-way ANOVA of the thermally treated samples indicated that treatment duration was the principal factor affecting the relative fatty acid profile. Treatment time significantly affected total MUFA and total PUFA, as well as the unidentified fraction, whereas the overall effect of pretreatment method was not significant. No significant method × time interactions were observed for the fatty acid groups or relative lipid quality indices. Thus, the observed changes were primarily associated with increasing treatment duration rather than with the pretreatment method itself.
Overall, extended thermal treatment was associated with a slight relative increase in SFA, while MUFA and PUFA tended to decrease. These changes indicate shifts in the relative fatty acid profile under more intensive heat exposure. Fatty acid composition is nutritionally relevant for sea grapes because unsaturated fatty acids contribute to the nutritional value of edible marine macroalgae (Paul et al., 2014; Zhang et al., 2020). At equivalent treatment durations, steaming generally showed numerically smaller changes in the relative fatty acid profile than blanching, although the overall effect of pretreatment method was not significant.
Total SFA increased slightly from 82.13% in untreated samples to 83.18% after blanching for 120 sec. Steaming for the same duration resulted in a slightly lower SFA value of 82.96%. By contrast, total MUFA decreased from 7.77% in the control to 7.21% after blanching for 120 sec and 7.33% after steaming for 120 sec. Total PUFA also decreased from 9.51% in untreated samples to 8.43% after blanching for 120 sec and 8.62% after steaming for 120 sec. These results suggest that prolonged heat exposure altered the relative distribution of fatty acid groups, with steaming showing numerically smaller changes than blanching.
Among the individual fatty acids, palmitic acid was the predominant SFA and increased slightly from 67.37% in untreated samples to 68.23% in B120 and 68.03% in S120. Palmitoleic acid, the major MUFA, decreased from 6.16% to 5.74% and 5.84%, respectively. Within the PUFA fraction, linoleic acid decreased from 4.40% in the control to 4.12% in B120 and 4.20% in S120, while linolenic acid decreased from 2.64% to 2.22% and 2.29%, respectively. The relative proportions of EPA and DHA also decreased progressively with prolonged treatment, with slightly higher values generally retained after steaming than after blanching at the corresponding treatment durations.
The apparent increase in SFA after heating should be viewed as a relative compositional shift rather than the formation of new saturated lipids. Because the data were expressed as relative peak areas, a decrease in the relative proportion of unsaturated fatty acids can mathematically increase the relative proportion of SFA in the remaining fatty acid profile. Polyunsaturated fatty acids contain multiple double bonds and are generally more susceptible to heat-induced chemical changes than saturated fatty acids (Shahidi and Zhong, 2010). However, because lipid oxidation indices were not measured, the present results should be interpreted cautiously as relative shifts in fatty acid composition rather than direct evidence of oxidative lipid degradation.
The unidentified fatty acid fraction increased with treatment severity, from 0.57% in untreated samples to 1.19% after blanching for 120 sec and 1.12% after steaming for 120 sec. This increase may reflect minor unresolved or unidentified chromatographic peaks within the fatty acid profile. However, without complementary lipid oxidation measurements or structural identification of these minor peaks, this change cannot be assigned directly to oxidized lipid products.
Relative lipid quality indices changed modestly in parallel with the fatty acid profile. The PUFA/SFA ratio decreased from 0.116 in untreated sea grapes to 0.101 after blanching for 120 sec and 0.104 after steaming for 120 sec. Similar changes in fatty acid profiles and lipid quality indices after thermal processing have been reported in vegetables, algae, and marine food materials (Kumar et al., 2021; Ortiz et al., 2009). The ω6/ω3 ratio increased moderately from 1.24 in the untreated control to 1.42 after blanching for 120 sec and 1.38 after steaming for 120 sec. However, two-way ANOVA showed no significant effects of pretreatment method, treatment time, or their interaction on either the PUFA/SFA or ω6/ω3 ratio; therefore, these changes should be interpreted as numerical trends rather than statistically significant factorial effects.
Steaming generally showed a numerically more favorable relative fatty acid profile than blanching at equivalent treatment durations. This difference may be partly associated with reduced direct contact with hot water and lower potential for leaching or structural disruption compared with immersion blanching. Nevertheless, the absence of a significant overall method effect indicates that treatment duration was more influential than pretreatment method in determining the observed compositional changes.
For practical processing, short thermal treatments of 15-30 sec produced relatively small changes in fatty acid composition. Although steaming generally showed numerically smaller changes than blanching at comparable treatment durations, the factorial analysis indicates that limiting heat exposure is likely more important than the choice of heating method for maintaining the relative fatty acid profile. Further studies including total lipid content, absolute fatty acid contents, and lipid oxidation indices are needed to confirm absolute lipid retention and oxidative stability during subsequent processing and storage.
Amino acid profiles were affected by thermal pretreatment, and the extent of reduction generally became greater as treatment duration increased (Table 5). Both EAA and NEAA decreased following thermal processing. Two-way ANOVA of the thermally treated samples indicated that treatment time significantly affected total EAA, total NEAA, and total quantified amino acid content, whereas the overall effect of pretreatment method was not significant. No significant method × time interactions were observed. The EAA/NEAA ratio was not significantly affected by pretreatment method, treatment time, or their interaction. These results indicate that treatment duration was the principal factor influencing overall amino acid retention.
Amino acid composition provides a useful indication of the nutritional quality of sea grapes, as marine macroalgae are recognized as alternative sources of essential amino acids and other nitrogenous compounds. In the present study, milder pretreatment conditions retained amino acids more effectively, suggesting better preservation of protein-related nutrients (Nofiani et al., 2018; Ortiz et al., 2009; Zhang et al., 2020).
In untreated samples, total EAA content was 362.37 mg/100 g fresh weight. After blanching for 120 sec, this value declined to 304.86 mg/100 g fresh weight, equivalent to a 15.90% reduction. Steaming for the same duration resulted in a slightly higher EAA content of 314.93 mg/100 g fresh weight, corresponding to a smaller reduction of 13.10%. Short steaming for 15-30 sec maintained relatively high EAA levels, ranging from 346.58 to 356.19 mg/100 g fresh weight. However, the absence of a significant overall method effect indicates that these differences between blanching and steaming should be interpreted as numerical trends rather than a statistically significant advantage of steaming.
Total NEAA showed a similar response to pretreatment. Untreated sea grapes contained 476.63 mg/100 g fresh weight, decreasing to 408.26 mg/100 g after blanching for 120 sec and 423.71 mg/100 g after steaming for the same duration. Total quantified amino acid content followed this decline, falling from 839.00 mg/100 g fresh weight in the control to 713.12 mg/100 g after blanching for 120 sec and 738.64 mg/100 g after steaming for 120 sec. Across the treatment series, steaming generally showed numerically higher total quantified amino acid contents than blanching at corresponding treatment durations, while treatment time remained the primary significant factor.
Among the quantified individual amino acids, methionine and lysine were the predominant EAA, whereas arginine was the predominant NEAA and the most abundant amino acid detected. A distinctive feature of the present amino acid profile was the relatively high contribution of methionine and arginine and the comparatively low level of leucine. This pattern differs from some previously reported amino acid profiles of Caulerpa lentillifera and related edible seaweeds, in which amino acids such as leucine, valine, aspartic acid, glutamic acid, and glycine have often been reported as major fractions (Stuthmann et al., 2023; Zhang et al., 2020). These differences may be associated with cultivation location, environmental conditions, harvest maturity, sample preparation, hydrolysis conditions, derivatization efficiency, and whether results are expressed on a fresh-weight, dry-weight, or protein basis. Therefore, the amino acid results in the present study should be interpreted as the sum of quantified amino acids obtained under the analytical conditions used, rather than as a complete amino acid composition.
The decline in amino acid content after thermal pretreatment can be attributed to multiple concurrent mechanisms. Free amino acids and other low-molecular-weight nitrogenous constituents are generally water-soluble, making them prone to diffusion into the surrounding medium during blanching. Prolonged heating may also promote chemical degradation, deamination, or transformation of thermolabile amino acids. Tissue disruption during processing can further facilitate the release of soluble intracellular constituents. Together, these effects may contribute to the numerical differences observed between blanching and steaming (Corsetto et al., 2020; Kumar et al., 2021).
The EAA/NEAA ratio varied only slightly among treatments, from 0.760 in untreated samples to 0.747 after blanching for 120 sec and 0.743 after steaming for 120 sec. This narrow range indicates that EAA and NEAA were reduced in broadly similar proportions during processing. Consistent with this observation, two-way ANOVA showed no significant effects of pretreatment method, treatment time, or their interaction on the EAA/NEAA ratio. Because essential amino acids must be supplied in adequate amounts through the diet, their retention is particularly relevant when sea grapes are positioned as functional or nutrient-dense foods (Ismail et al., 2020; Zhang et al., 2020).
Steaming generally showed numerically higher amino acid contents than blanching at corresponding treatment durations. This pattern may be associated with reduced direct contact with hot water and consequently less opportunity for leaching during steam treatment. Longer steaming, however, still produced measurable reductions, further indicating that exposure duration was important for amino acid retention.
For nutritional and technological applications, brief thermal treatments of 15-30 sec appear preferable for maintaining the amino acid profile of sea grapes before further processing. Although steaming generally showed numerically smaller reductions than blanching at corresponding treatment durations, the factorial analysis indicates that limiting treatment duration is more important than the choice of pretreatment method for overall amino acid retention. Optimizing mild thermal pretreatment may therefore help maintain the protein-related nutritional quality of sea grapes intended for further processing.
The integrated heatmap and weighted score were used to summarize the immediate responses of sea grapes to blanching and steaming across the measured quality domains (Fig. 1). This analysis was intended as a decision-support tool and not as a replacement for the statistical interpretation of individual parameters.
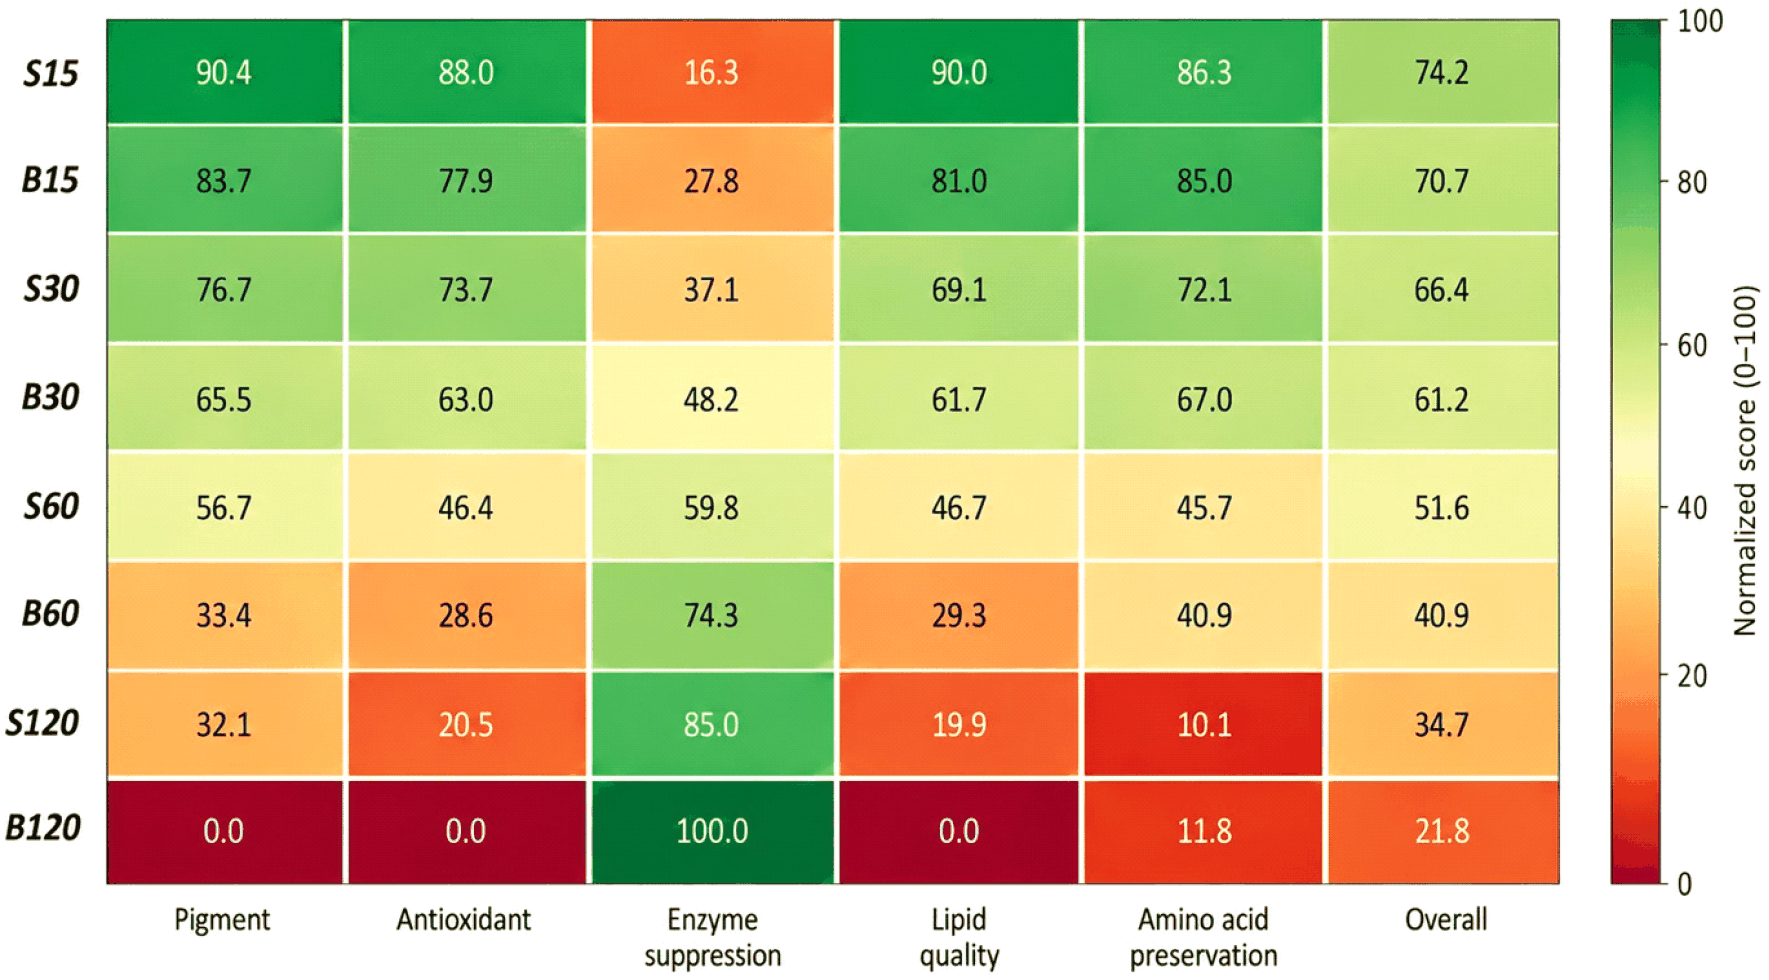
The weighted analysis showed that S15 had the highest overall score, indicating the strongest overall retention of the measured quality attributes immediately after pretreatment. This response reflected the high retention of pigment, antioxidant-related, relative lipid quality, and amino acid-related indices under the mildest steam exposure. However, S15 provided only moderate enzyme suppression. By contrast, S30 had a lower overall score than S15 but showed greater enzyme suppression while maintaining acceptable quality-retention scores. Therefore, S15 and S30 should be interpreted as serving different processing objectives: S15 is more appropriate when maximum immediate quality retention is prioritized, whereas S30 represents a practical compromise when greater biochemical stabilization is required.
Among the blanching treatments, B15 showed the highest overall score, indicating that mild blanching limited quality loss more effectively than longer blanching times. However, its overall score remained lower than that of S15 under the tested conditions. More intensive heat treatments, particularly prolonged blanching, improved enzyme suppression but caused greater losses in several measured quality attributes. These results support the importance of selecting pretreatment conditions according to the intended balance between immediate quality retention and enzyme suppression under the specific operational conditions tested.
The present findings indicate that mild thermal pretreatment can modify several quality-related attributes of sea grapes before further processing. Under the specific conditions tested, steaming generally caused smaller changes in pigment and antioxidant-related properties than blanching, whereas blanching produced stronger enzyme suppression. This difference should be interpreted as the combined effect of heating medium, heat-transfer behavior, direct water contact, and treatment temperature, rather than as the isolated effect of heating medium alone. The lower degree of quality loss observed after steaming may be partly associated with the absence of direct hot-water immersion, which can reduce opportunities for leaching of water-soluble constituents and tissue disruption during heating (Corsetto et al., 2020; Nurjanah et al., 2019).
The practical implication of these findings is that short-time steaming may be considered as a potential pretreatment option when processors aim to retain measured quality attributes while partially suppressing endogenous enzymes. S15 may be suitable when immediate quality retention is the primary objective, whereas S30 may be selected when greater enzyme suppression is desired. However, the present study evaluated quality attributes immediately after pretreatment only. Storage stability, microbial quality, instrumental color, texture, sensory quality, drying behavior, freezing performance, and shelf-life extension were not evaluated. Therefore, the suitability of these pretreatments for refrigerated, frozen, dried, or other value-added sea grape products should be regarded as a potential implication requiring further validation under product-specific processing and storage conditions (Nofiani et al., 2018; Nurjanah et al., 2019; Yap et al., 2019).
4. Conclusions
Blanching and steaming affected the measured physicochemical, functional, enzymatic, relative lipid, and amino acid-related attributes of sea grapes immediately after pretreatment. Increasing treatment duration generally reduced pigment contents, phenolic compounds, antioxidant activities, relative PUFA-related indices, and quantified amino acid contents, while also reducing residual activities of PPO, POD, and chlorophyllase. Under the specific operational conditions tested, steaming generally retained pigment and antioxidant-related attributes more effectively than blanching, whereas blanching produced stronger enzyme suppression.
The integrated weighted analysis indicated that S15 achieved the highest overall score, reflecting the strongest immediate retention of measured quality attributes. However, S30 provided greater enzyme suppression while maintaining acceptable quality-retention scores. Therefore, mild steaming for 15-30 sec may be considered according to the intended processing objective, with S15 favoring maximum immediate quality retention and S30 favoring greater biochemical stabilization. Because storage stability, microbial quality, instrumental color, texture, sensory quality, drying performance, freezing performance, and shelf-life extension were not evaluated, the application of these pretreatments to refrigerated, frozen, dried, or value-added sea grape products requires further validation.


