
1. Introduction
Radish (Raphanus sativus L.) is a cool-season root vegetable of the family Brassicaceae that is widely cultivated in Europe, America, China, Japan, and Korea (Curtis, 2003). It is valued for its nutritional content, which includes vitamin C, minerals, and dietary fiber, as well as its bioactive compounds, such as coumaric acid, kaempferol, quercetin, luteolin, and glucosinolates (Cartea et al., 2010; Geng et al., 2025; Kajszczak et al., 2024). The colored radish (black, red, pink, and purple) is rich in flavonoids, phenolic compounds, and a diverse range of anthocyanin glycosides, such as cyanidin, delphinidin, and pelargonidin (Jing et al., 2012; Koley et al., 2020; Singh et al., 2017). Consumer and industrial interest in colored radish has steadily increased due to its potential applications as a functional food ingredient and natural colorant. These bioactive compounds have been reported to exhibit various physiological activities, including antioxidant, anticancer, hepatoprotective, cholesterol-lowering, immunostimulatory, and skin-protective effects (Cartea et al., 2010; Geng et al., 2025; Kajszczak et al., 2024), while also contributing to important quality characteristics, including color, flavor, texture, and processing suitability.
The “Boraking,” a radish cultivar widely cultivated in Korea, is distinguished by the diversity and high levels of cyanidin glycosides produced relative to other purple radish cultivars (Chae et al., 2024). Boraking produces high biomass and yield, making it suitable for value-added functional food processing. Its abundance of bioactive compounds, including cyanidin glycosides, kaempferol glycosides, glucosinolates, and anthocyanins, has attracted interest in its use as a promising functional crop. However, industrial utilization requires not only high concentrations of functional compounds but also consistent quality and standardized raw materials. Therefore, understanding growth stage-dependent changes in quality characteristics and metabolite composition is essential for determining the optimal harvest stage and maximizing industrial utilization.
The functional compound content and composition in plants are known to vary according to environmental conditions and cultivation periods, which also determine quality parameters, including coloration, firmness, flavor, and biological activity (Godlewska et al., 2021; Liu et al., 2024; Park et al., 2022). In Brassica oleracea (cabbage and broccoli) and Arabidopsis spp., primary metabolites that support cell division and tissue formation predominate during early growth stages, while secondary metabolites accumulate during the later growth stage as part of the plant’s defense mechanism and physiological modulation (Charron and Sams, 2004; Hanschen and Schreiner, 2017). In white radish, higher proportions of glucoraphanin have been reported during the early growth stage, whereas glucoraphasatin gradually accumulates during root hypertrophy and the later stages of development (Blažević et al., 2020; Hanschen and Schreiner, 2017; Kliebenstein et al., 2001). These changes in glucosinolate content and composition are regarded as an important factor affecting crop quality attributes, such as functionality, sensory characteristics, and antioxidant capacity (Brown et al., 2003). The synthesis and accumulation of secondary metabolites, such as flavonoids, phenolic compounds, glucosinolates, and anthocyanins, have been reported to be influenced by environmental conditions and cultivation period (Ninkuu et al., 2025). Furthermore, phenolic compounds and anthocyanins are known to be involved in plant responses to environmental stress and developmental regulation (Nakabayashi and Saito, 2015; Zhang et al., 2014). Therefore, growth stage-dependent metabolic changes may directly influence physicochemical quality, harvest maturity, processing suitability, and postharvest utilization of purple radish. Understanding these metabolic responses is essential for establishing harvest strategies and producing high-quality functional raw materials.
This study evaluated changes in growth parameters, including length, width, fresh weight, and color values (L*, a*, and b*), in the leaves and roots of Boraking radishes throughout their growth. Liquid chromatography-mass spectrometry (LC-MS) based non-targeted metabolite analysis was utilized to identify alterations in bioactive compound profiles. The objectives of this study were to characterize growth stage-dependent changes in physicochemical properties and metabolite composition, identify quality-related metabolic markers associated with harvest maturity, provide scientific evidence for determining the optimal harvest stage, and generate data that can be used to improve the industrial utilization of purple radish.
2. Materials and methods
Purple radishes (R. sativus L. cv. ‘Boraking’, F1 hybrid) were cultivated in Hampyeong (Jeonnam, Korea) from September 2024 to November 2024. The soil was treated with a fertilizer mixture consisting of 13 kg of urea, 60 kg of fused phosphate, 8 kg of potassium chloride, 65 kg of calcium hydroxide, and 1.5 kg of borax per 0.16 ha. Purple radishes were cultivated in three replicates of 8-12 plants each. Starting 40 days after sowing, radishes were harvested at intervals of 10 days (40, 50, 60, 70, and 80 days). Radish roots and leaves were then freeze-dried and ground into powder.
Atmospheric temperature data were collected from the Korea Meteorological Administration. Growing degree day (GDD) was defined using an equation from a previous study (Hou et al., 2014), with modifications:
where TMax, TMin, and Tbase are the maximum, minimum, and base (10°C) temperatures for each day (n).
At each sampling, the widths, lengths, and fresh weights of the roots and the lengths and fresh weights of the leaves were measured at 10 days intervals. The proximal end ratio (%) was calculated as the ratio of the length of the dark purple portion to the total length of the root. The color values (L*, a*, and b*) of each purple radish were determined using a chroma meter (CR-500DX-S, Sun Scientific Co., Ltd., Tokyo, Japan). The hardness of the purple radishes’ peel and flesh was assessed using a hardness tester with a test speed of 120 mm/min, distance of 10 mm, and sample height of 10 mm.
To determine the TFC of the purple radish roots and leaves, 100 mg of root powder and 30 mg of leaf powder were subjected to extraction in 1 mL of 70% methanol (MeOH), with sonication for 30 min. The extract was centrifuged at 3,000 ×g for 10 min at 4°C using a Varispin 12R centrifuge (Cryste, Gyeonggi, Korea). The supernatant (40 μL) was mixed with 180 μL of diethylene glycol and allowed to react for 3 min. After adding 10 μL of 1 N NaOH, the reaction mixture was incubated at 37°C for 90 min. The TFC was measured by determining the absorbance at 427 nm with a spectrophotometer and expressed as mg naringin equivalent (NAE)/100 g.
Root (100 mg) and leaf (30 mg) samples were extracted with 1 mL of 70% MeOH containing 1% HCl for 1 h in the dark. The extract was centrifuged at 3,000 ×g for 10 min at 4°C, and 100 μL of the supernatant was used to measure absorbance. The TAC was measured by determining the absorbance at 530 nm with a spectrophotometer and was reported as mg cyanidin-3-O-glucoside equivalent (C3G)/100 g.
Glucosinolates were analyzed following the methods described in a previous study (Chae et al., 2024). A 100 mg of freeze-dried purple radish root and leaf powder was subjected to extraction in 2 mL of 70% MeOH at 95°C for 10 min. After cooling for 5 min, sinigrin was added as an internal standard. The sample was vortexed and centrifuged at 3,000 ×g for 10 min at 25°C. The resulting pellet was subjected to a second extraction in 2 mL of 70% MeOH. A 150 μL aliquot of a mixture of 1 M lead acetate and 1 M barium acetate (1:1, v/v) was added to 1 mL of pooled extract. After vortexing, the sample was centrifuged at 12,000 ×g for 1 min to precipitate the protein. One mL of extraction solution was allowed to react with Sephadex A-25 resin (GE Healthcare, Piscataway, NJ, USA) in poly-prep columns. The pooled extract and 3 mL of 0.02 M pyridine acetate were loaded onto a pre-equilibrated column, and 3 mL of deionized distilled water was added. Then, 500 μL of sulfatase solution was added to the column, and the reaction was allowed to proceed by incubating the column overnight at 20-22°C. The next day, an additional 3 mL of deionized distilled water was passed through the column, and the resulting eluate was collected. The eluate was then filtered through a 0.22 μm nylon syringe filter prior to analysis. To quantify glucosinolates, 1 μL of the filtered sample was injected into an ACQUITY UPLCⓇ HSS T3 column (100 Å, 2.1 × 100 mm, 1.8 μm). Mobile phases A and B were 0.1% formic acid (FA) in deionized distilled water and 0.1% FA in 100% acetonitrile, respectively. Separation was carried out at a flow rate of 0.2 mL/min using the following gradient program: 5% B (0-4 min), 10% B (6 min), 19% B (35 min), 50% B (37 min), and 90% B (50 min). The column temperature was maintained at 40°C throughout the analysis. Metabolites were monitored using a photodiode array detector by recording absorbance over the wavelength range of 210-400 nm.
MS analysis was performed in both positive and negative electrospray ionization modes over an m/z range of 50-1,500 with a scan time of 0.2 sec. The capillary voltage and sampling cone voltage were set to 2.5 kV and 40 V, respectively. Cone and desolvation gas flow rates were maintained at 50 and 600 L/h, respectively, while the desolvation and ion source temperatures were set to 200°C and 130°C. Collision energies of 6 eV and 25-50 eV were applied for low- and high-energy acquisition, respectively. For quality control, an equal volume of each sample collected from the different cultivation periods was pooled and analyzed. Qualitative metabolite identification was performed using MassBank (https://massbank.eu/MassBank/) and PubChem (https://pubchem.ncbi.nlm.nih.gov/), and glucosinolate content was quantified using the internal standard (sinigrin) and relative response factors.
Purple radish root (200 mg) and leaf (100 mg) powders were subjected to extraction in 1 mL of 70% MeOH at 25°C with sonication for 30 min; the extract was then centrifuged at 3,000 ×g for 10 min at 4°C, and the supernatant was collected. As an internal standard, 2,4,5-trimethoxycinnamic acid was added to each sample. One mL of the supernatant was then loaded onto a reversed-phase solid-phase extraction cartridge (Sep-Pak Vac 35 cc, Waters, Milford, MA, USA). The cartridge was sequentially eluted with 10 mL of deionized water and 2 mL of acetonitrile. The eluted fractions were concentrated using a rotary evaporator (Eyela, Tokyo Rikakikai Co., Ltd., Tokyo, Japan) and subsequently reconstituted in 1 mL of deionized water. This solution was filtered through a 0.22 μm syringe filter prior to analysis. An aliquot (3 μL) of each sample was injected into a UPLC-QToF-MS system (ACQUITY UPLC™, Waters Co.) coupled with a Xevo G2-XS QToF mass spectrometer (Waters Co.). Chromatographic separation of purple radish root extracts was performed using an ACQUITY UPLCⓇ HSS T3 column (100 Å, 2.1 × 100 mm, 1.8 μm), and the column oven temperature was maintained at 40°C. Mobile phases A and B, 0.1% FA in deionized distilled water and 0.1% FA in 100% acetonitrile, respectively, were used at a flow rate of 0.4 mL/min. For the gradient condition, solvent B was at 5% for minutes 0-4, increasing to 10% at minute 6, then to 19% by minute 35, to 50% by minute 37, and finally to 90% by minute 50. Photodiode array was measured by absorbance within the range of 210-400 nm.
The MS settings were the same as those used for glucosinolate quantification (see Section 2.6). For quality control, equal volumes of samples from each cultivation period were pooled and analyzed. Metabolites were putatively identified by comparing their Tandem mass spectrometry (MS/MS) fragmentation patterns with spectral information available in MassBank and PubChem. Theoretical and observed m/z values were compared, and metabolites with mass errors of less than 4 ppm were included in the identification.
One-way analysis of variance (ANOVA) and partial least squares discriminant analyses (PLS-DA) were performed in MetaboAnalyst 6.0 (Chae et al., 2021; Pang et al., 2022) using autoscaling for feature normalization. Tukey’s honest significant difference (HSD) tests were performed using SPSS version 28 (IBM Co., Chicago, IL, USA).
3. Results and discussion
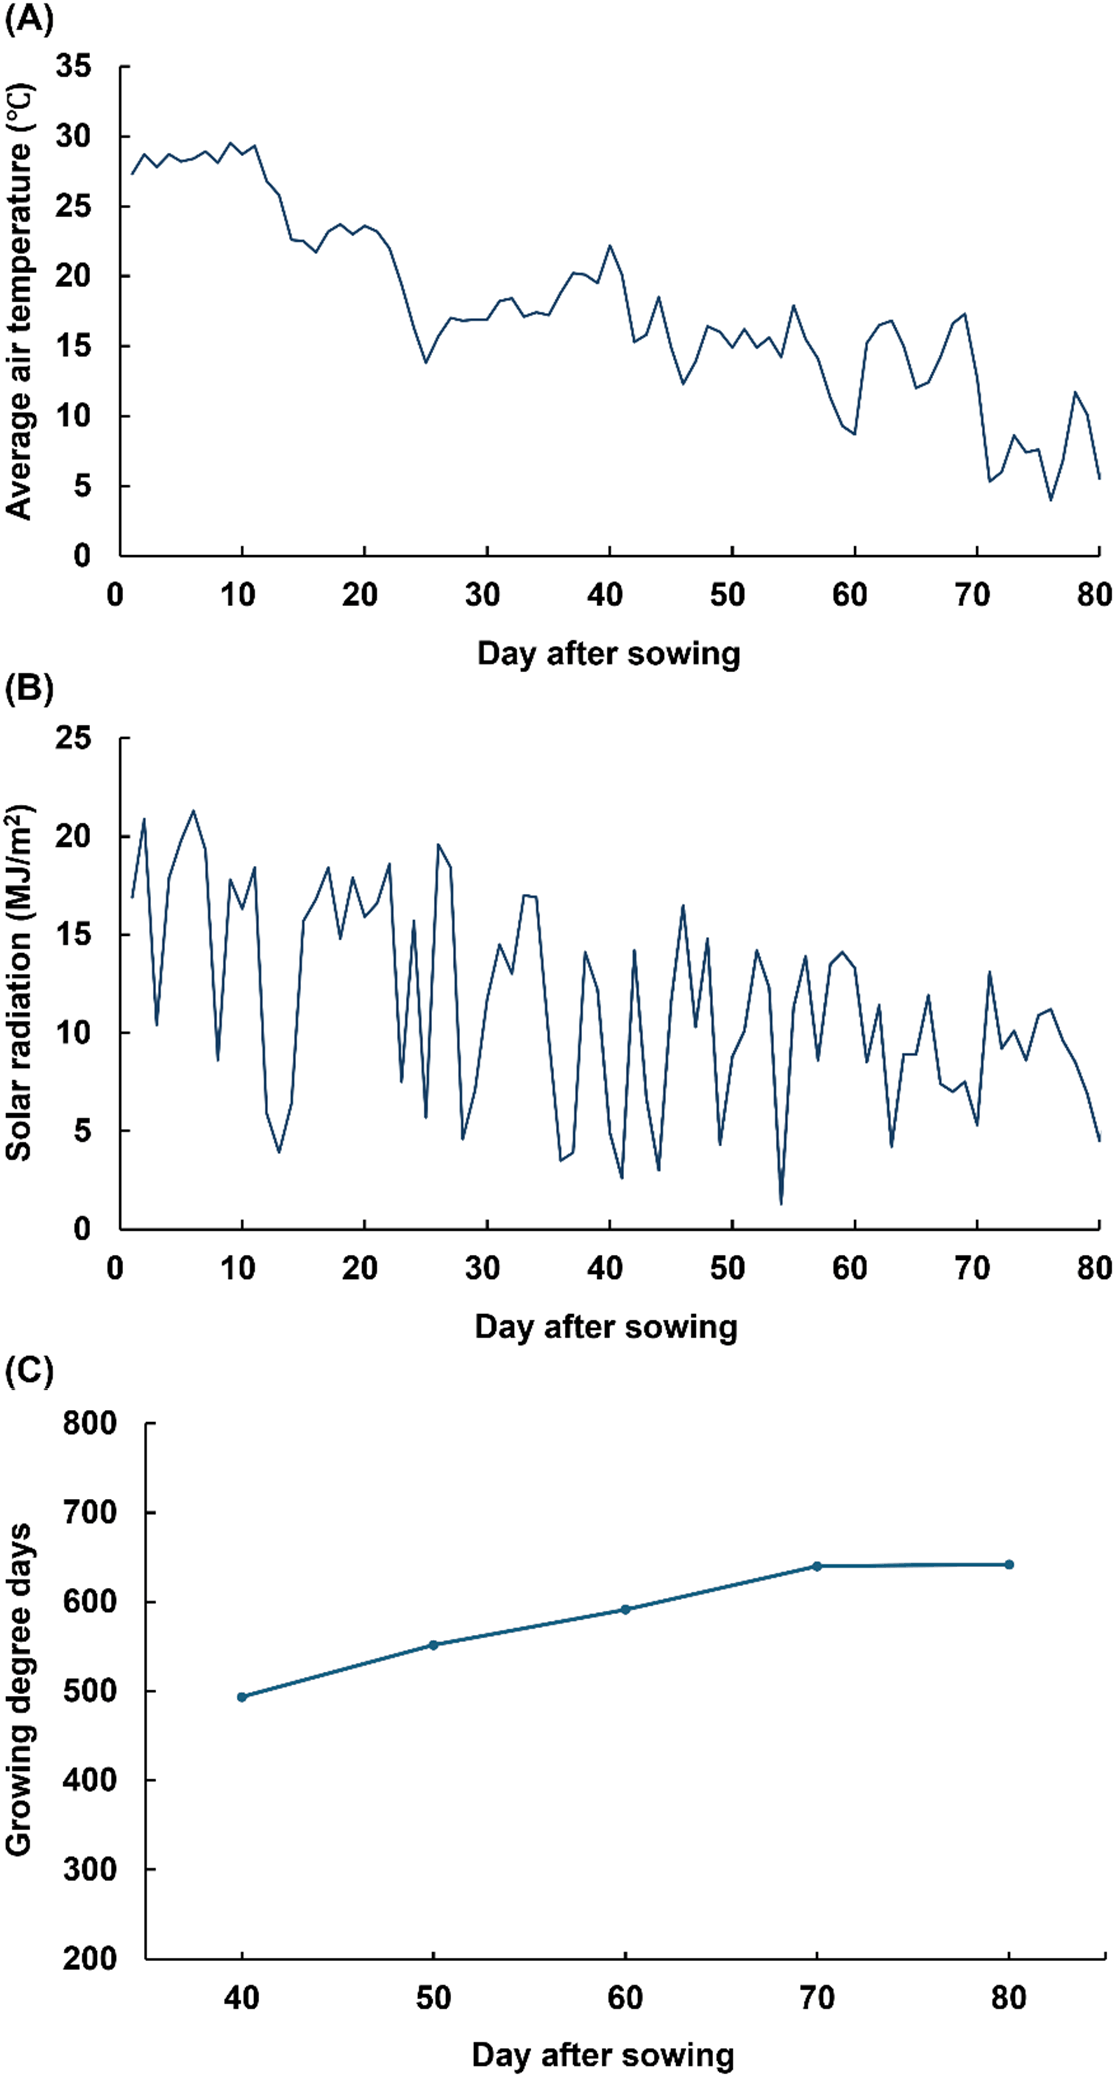
During the cultivation period, the average atmospheric temperature and solar radiation were 17.5°C and 11.47 MJ/m2, respectively, with both gradually decreasing throughout (Fig. S1). During the middle-growth stage (days 60-70), approximately 50% of the days had a daily mean temperature below 15°C. In the late-growth stage (after day 70), the daily mean temperature consistently remained below 15°C. The GDD at the experimental site gradually increased during the early-growth stages, reaching 640.1 by day 70 after sowing. However, the rate of GDD accumulation decreased in the late season, resulting in a final GDD value of 641.9 on day 80 (Fig. S1).
The root widths of purple radish plants at day 70 (11.3 ± 0.8 cm) were 2.3 times greater than at day 40 (4.9 ± 0.5 cm; Table 1), and the root lengths increased 1.7-fold over the same period (Table 1). The fresh weights of the roots showed a 9.1-fold increase between days 70 (1,980.8 ± 442.2 g) and 40 (217.6 ± 46.4 g; Table 1). However, all three root growth parameters declined after day 70. Similarly, the proportion of the proximal end ratio gradually increased, reaching 31.6% by day 70 and then rapidly increased to 48.6% by day 80 (Table 1). The optimal temperature for radish root development was previously reported to be 15-20°C (Oh et al., 2022). During the early growth period (days 40-60), the daily mean temperature remained within this optimal range, resulting in significant increases in root width, length, and fresh weight. In contrast, the daily mean temperature consistently decreased below 15°C after day 70, coinciding with a marked reduction in the growth rate. These results indicate that low-temperature conditions after day 70 limited further root development. Previous studies have reported that reductions in temperature and GDD influence the accumulation of both primary and secondary metabolites (Chen et al., 2025; Ninkuu et al., 2025; Sharma et al., 2019).
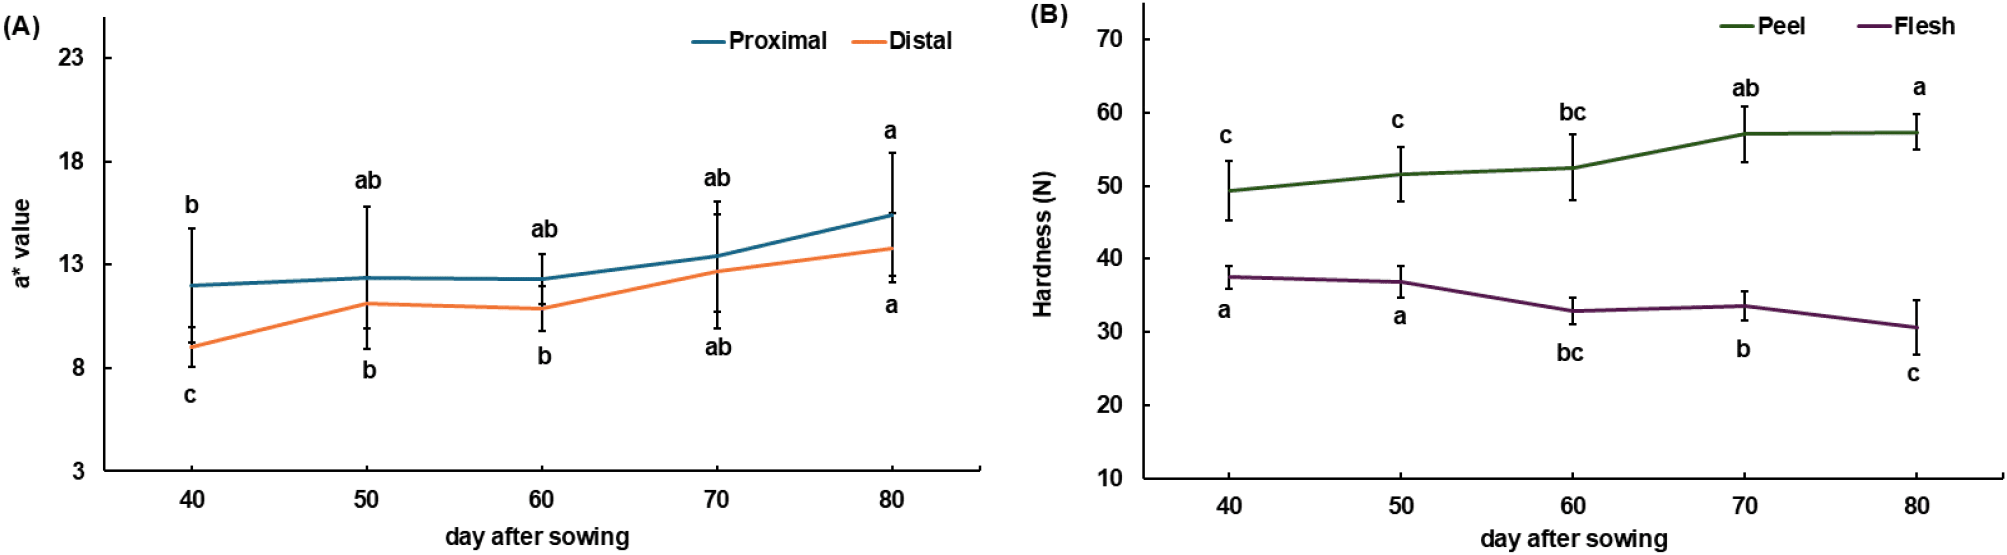
The chromaticity (a* value) of purple radish root changed significantly throughout the cultivation period (Fig. 1A). The a* values in the proximal and distal root regions were lowest on day 40 (12.0 ± 2.8 and 9.0 ± 1.0, respectively) and highest on day 80 (15.4 ± 3.0 and 13.8 ± 1.7, respectively). The chromaticity of colored radishes is reported to be influenced by the composition and content of anthocyanins (Zhang et al., 2021). Thus, the increase in a* values may be linked to both an increased content and an altered composition of anthocyanins. Peel hardness was significantly higher on day 80 (57.3 ± 2.4 N) than on day 40 (49.3 ± 4.1 N; Fig. 1B). However, the hardness of the flesh was highest on day 40 (37.5 ± 1.6 N) and gradually declined, with the lowest value observed on day 80 (30.7 ± 3.7 N). The hardness of radishes can be affected by lignin, cellulose, and moisture contents (Chen et al., 2025; Ninkuu et al., 2025), which are known to be affected by environmental stress or physiological aging, accompanied by the activation of the phenylalanine pathway, in various crops. The increase in peel hardness during the late growth stage may be attributed to lignification, accompanied by the accumulation of lignin, cellulose, and their precursors. The decrease in flesh hardness observed during the cultivation period may be attributable to increased moisture contents in the purple radishes’ tissues.
Leaf lengths gradually increased throughout the cultivation period (Table 1). Average leaf fresh weight was 558.3 ± 42.2 g on day 80, approximately twice the average on day 40, 244.7 ± 55.8 g (Table 1). Increases in the fresh weight and photosynthesis rate of radish leaves have been reported to be inhibited by low temperature and reduced light intensity (Sirtautas et al., 2011). Leaf growth occurred under optimal temperature and light conditions during the early-growth stage. However, the rates of increase in leaf length and weight gradually decreased due to the cold temperature (below 15°C), reduced light intensity, and physiological aging during the late-growth stage, with a reduction of approximately 29% between the early-growth and late-growth stages. In a previous study, low temperatures, reduced light intensity, and physiological aging were demonstrated to reduce metabolic activity in purple radish leaves during the late-growth stage, causing decreases in the levels of bioactive compounds like vitamin C, TFC, total phenolic content, and glucosinolate, as well as pigment compounds (Podsędek, 2007). Thus, bioactive compound levels may have also gradually decreased in the purple radish leaves during the cultivation period.
Both TFC and TAC were measured using a spectrophotometer to better understand the changes to the bioactive compound profiles of purple radish leaves and roots over the cultivation period (Table 2). In roots, TFC was relatively low on days 40 and 50 (149.0 ± 15.5 and 136.2 ± 12.7 mg NAE/100 g dry weight [DW], respectively), and the highest TFC was observed on day 80 (191.8 ± 8.1 mg NAE/100 g DW). Similarly, root TAC was low on days 40 and 50 (165.4 ± 5.4 and 166.6 ± 4.5 mg C3G/100 g DW, respectively), and gradually increased, reaching the highest value on day 80 (265.1 ± 12.0 mg C3G/100 g DW). Low temperatures (4-10°C) and reductions in GDD have been reported to promote the generation of reactive oxygen species, increasing the expression of key genes in the phenylpropanoid pathway, including chalcone synthase, cinnamate 4-hydroxylase, and 4-coumarate-CoA ligase, and stimulating the accumulation of flavonoids and anthocyanins (He et al., 2023; Li et al., 2025; Schulz et al., 2016; Zhao et al., 2024). Accordingly, the increased TFC and TAC observed in the purple radish roots during the late growth stage are consistent with previous reports describing enhanced accumulation of phenylpropanoid-derived metabolites under low-temperature conditions.
The TFC of leaves was significantly higher than that of roots, and no significant change in leaf TFC was observed during the cultivation period. The TAC of the leaves was highest on day 40 (110.7 ± 2.0 mg C3G/100 g DW), and decreased over most of the cultivation period, reaching its lowest levels on day 70 (35.0 ± 2.3 mg C3G/100 g DW). In leaves, the accumulation of flavonoids functions as a photoprotective mechanism against high-intensity light and ultraviolet stress (Ferreyra et al., 2021). Therefore, in the purple radish plants, flavonoid contents were likely higher in the leaves than in the roots due to their continuous exposure to high-intensity light and ultraviolet radiation during the cultivation period. Anthocyanins are also believed to function as photoprotective compounds in plants, and reduced solar radiation has been reported to inhibit their biosynthesis and reduce accumulated levels (Agati et al., 2021). A decline in solar radiation may have contributed to the reductions in anthocyanin levels seen in the purple radish leaves during the late-growth stage.
Glucosinolates in purple radish roots were analyzed using UPLC-QToF-MS. Two types of glucosinolates, glucoraphenin and glucoraphasatin, were identified (Table 2). Changes in glucoraphenin levels were not statistically significant during the cultivation period (p > 0.05), while glucoraphasatin levels were greatest on day 40 (2.52 ± 0.08 mmol/100 g DW), and gradually decreased throughout the cultivation period, with the lowest levels observed on day 80 (2.05 ± 0.21 mmol/100 g DW). In Brassicaceae plants, cold stress has been reported to suppress the expression of glucoraphasatin synthase 1, a key regulatory protein in the glucosinolate biosynthetic pathway, reducing the synthesis of glucoraphasatin (Nugroho et al., 2020). Therefore, the observed reductions in glucoraphasatin in the purple radish roots may be attributed to limited biosynthesis under low-temperature conditions during the late growth stage. The phenylpropanoid and glucosinolate pathways in Arabidopsis thaliana exhibit metabolic competition, whereby increased accumulation of anthocyanins leads to reduced glucosinolate biosynthesis (Kim et al., 2015). The decrease in glucoraphasatin and the increase in anthocyanins observed in purple radish during the late growth stage may reflect coordinated changes in secondary metabolite composition under low-temperature conditions. In purple radish, the phenylpropanoid pathway may be activated at low temperatures during the late-growth stage, this would result in enhanced anthocyanin biosynthesis and suppressed glucosinolate biosynthesis. On day 80, when anthocyanin levels peaked, purple radishes exhibited reduced pungency and bitterness, this was a peak in both sensory appeal and processing suitability. This suggests that day 80 is the optimal time for both consumer preference and industrial application.
Glucoraphenin, glucobrassicin, and glucoraphasatin were detected in purple radish leaves (Table 2). The highest glucoraphasatin content was observed on day 40 (17.4 ± 0.30 mmol/100 g DW), which was followed by a sharp decrease, reaching 11.21 ± 0.73 mmol/100 g DW by day 50, and a continuous decline thereafter. The lowest glucoraphasatin levels were observed on day 80 (8.20±0.78 mmol/100 g DW). On the other hand, glucobrassicin content gradually increased during the cultivation period, reaching its highest levels on day 80 (3.22 ± 0.19 mmol/100 g DW). Glucoraphenin remained at relatively low levels throughout the cultivation period, with the highest content seen on day 40 (1.51 ± 0.20 mmol/100 g DW). However, the increasing leaf area over the cultivation period may have resulted in a dilution effect, decreasing the glucoraphasatin content per unit leaf area. Glucosinolate contents in leaves have previously been reported to decrease during the cultivation period due to physiological aging-associated senescence (Baenas et al., 2014; Fazal et al., 2016; Šalić and Šamec, 2022; Wurst et al., 2006). Therefore, the reductions in glucoraphasatin content seen in purple radish leaves may be attributable to both senescence induced by physiological aging and the dilution effect. In contrast to the roots, where anthocyanins and coniferyl alcohol derivatives accumulated during the late growth stage, leaves exhibited a gradual decline in glucosinolates and anthocyanins. These contrasting metabolic patterns indicate tissue-specific responses to environmental conditions during cultivation, with roots preferentially accumulating metabolites associated with pigmentation and structural reinforcement, whereas leaves primarily underwent metabolic decline associated with maturation and senescence.
Glucobrassicin levels have exhibited temperature-dependent patterns in previous research, tending to increase under low temperatures during the growing period (Ciska et al., 2000; Liu et al., 2021; Malik et al., 2010; Wang et al., 2022). However, we observed an increasing trend in glucobrassicin levels in the purple radish leaves during the same period. When temperatures are low, purple radish exhibits a distinct metabolic response associated with the activation of the anthocyanin biosynthetic pathway, which relates to glucobrassicin (Kim et al., 2015; Seo and Kim, 2017).
Changes in the glucosinolate contents of purple radish roots and leaves were influenced by the environmental factors and physiological aging during the cultivation period. A reduction in pungency and bitterness during the late-growth stage improves the flavors of the root and leaf, enhancing consumer preference.
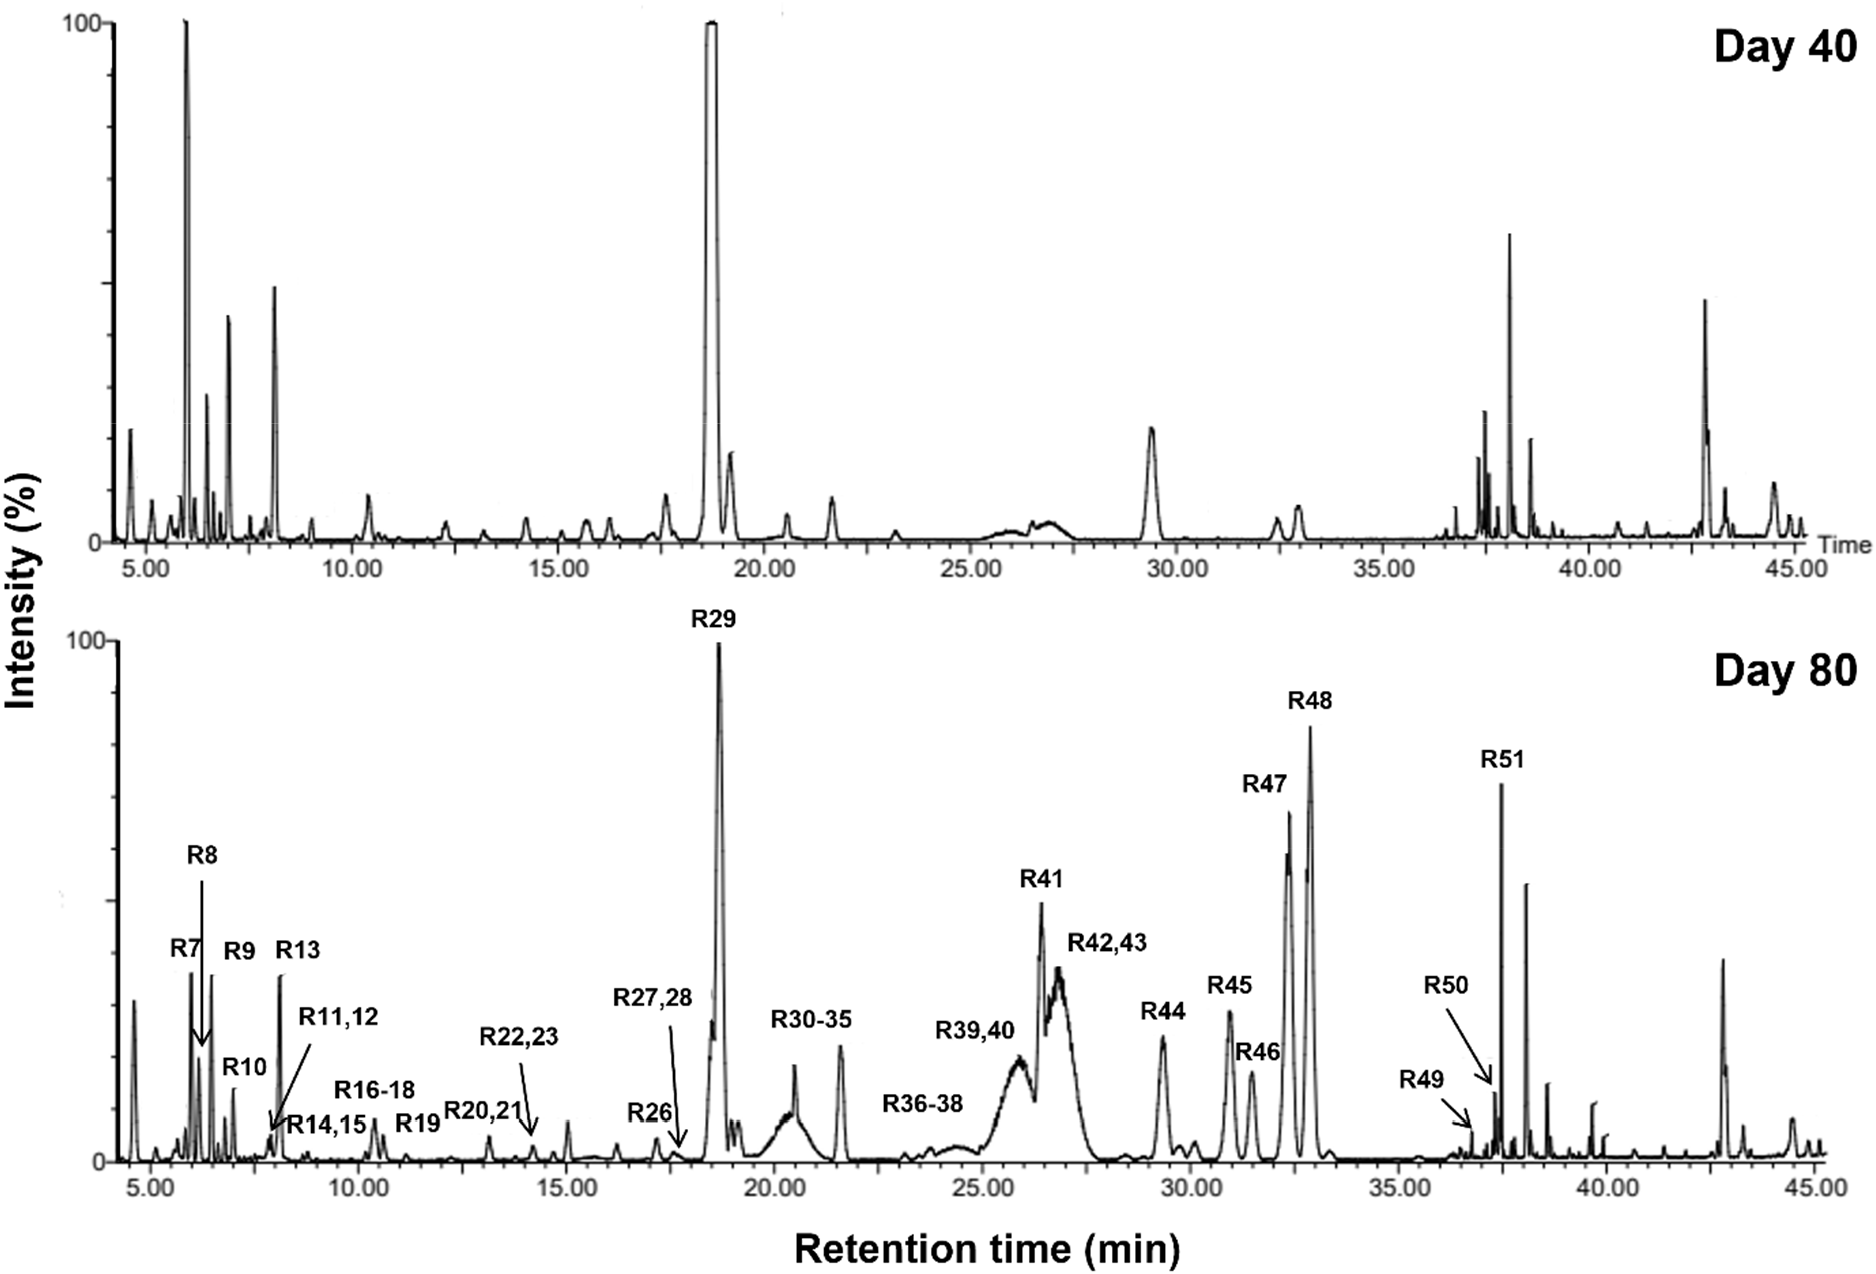
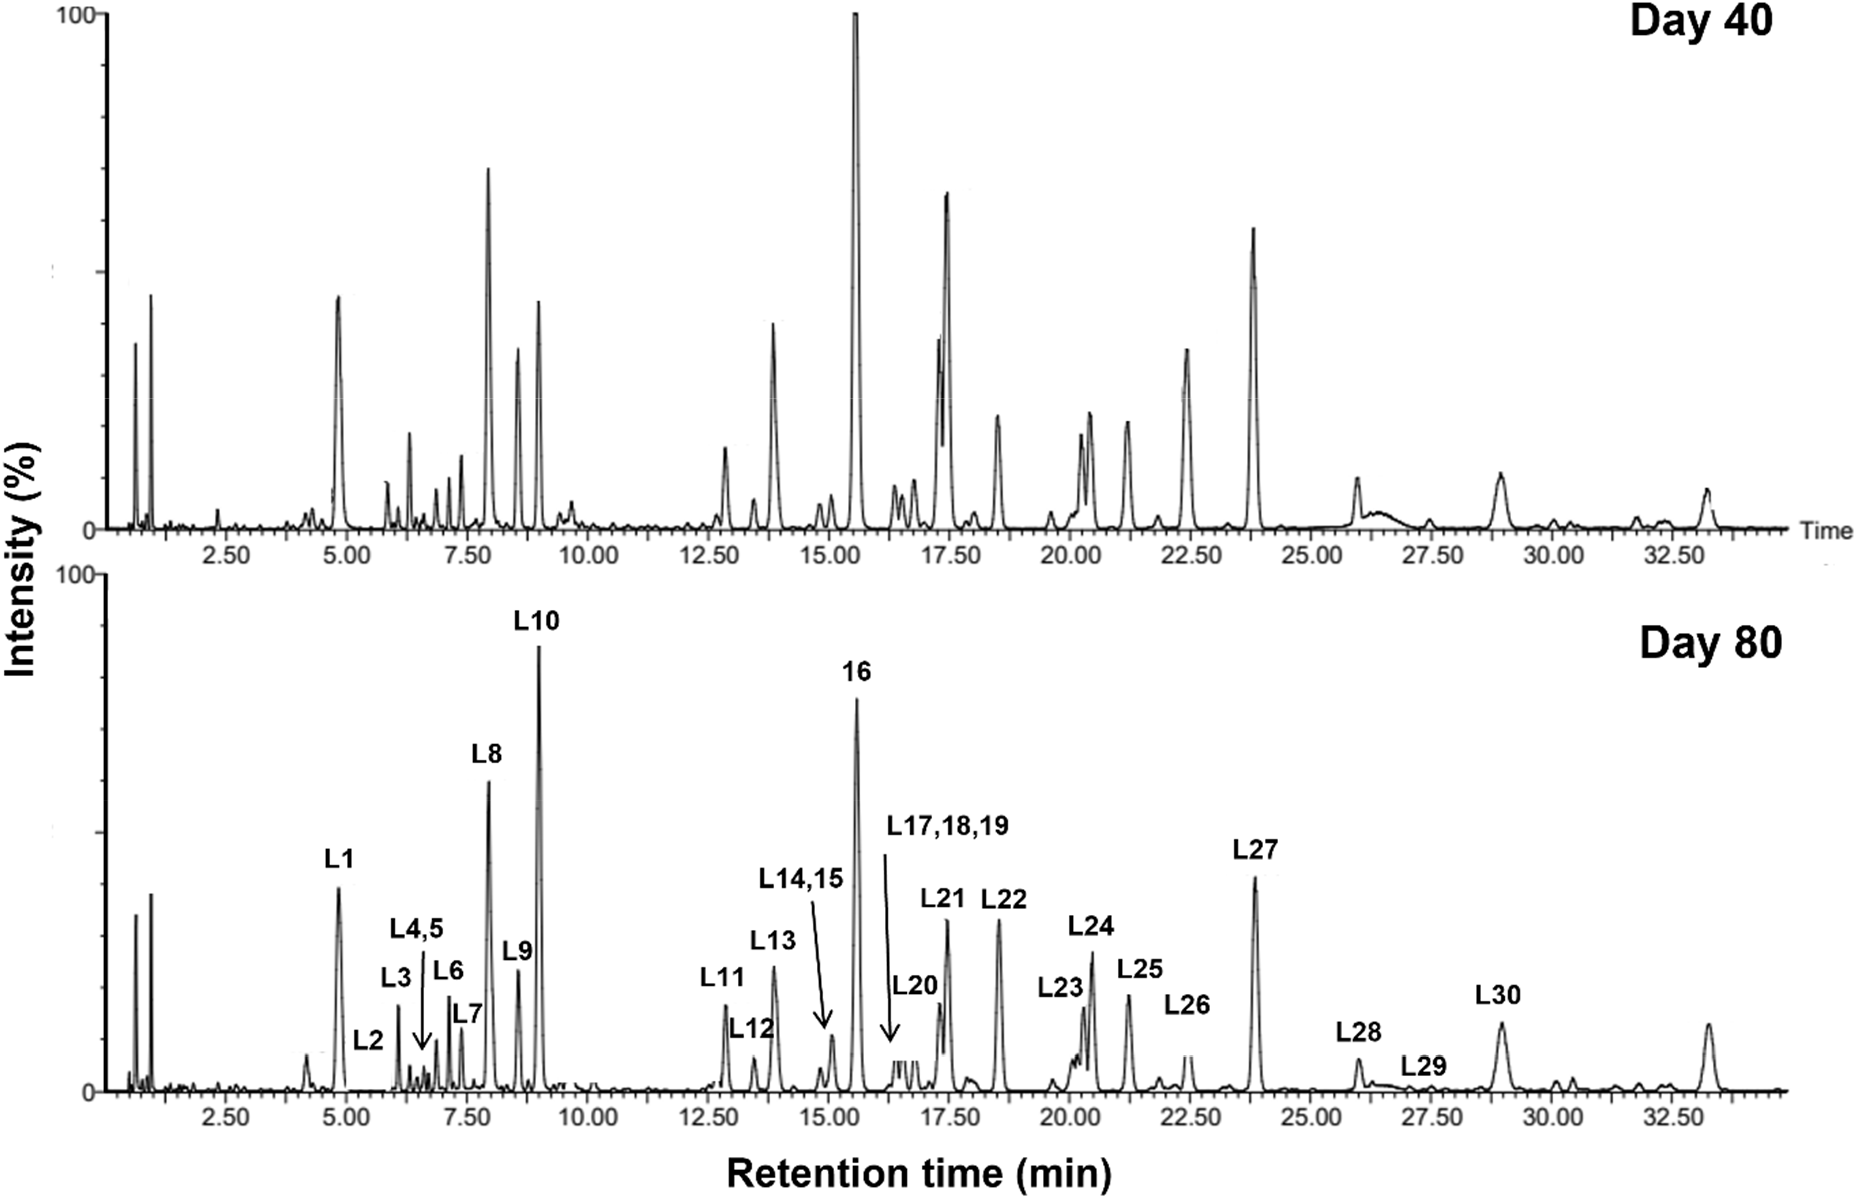
Metabolites in purple radish roots were profiled using UPLC-QToF-MS to characterize changes in functional compounds, such as flavonoids and anthocyanins, during the cultivation period. A total of 51 metabolites were detected, including 2 glucosinolates, 22 cyanidin glycosides, 2 lignans, and 1 fatty acid (Fig. S2, Table 3). Red and purple radishes have been reported to contain kaempferol, quercetin, pelargonidin, delphinidin, and cyanidin glycosides (Koley et al., 2020; Lin et al., 2011). However, Boraking radishes are known to contain cyanidin glycosides as the major anthocyanin (Chae et al., 2024). This distinctive anthocyanin composition was considered to reflect Boraking’s cultivar-specific metabolic traits. Twenty-two cyanidin glycosides, conjugated with coumaric acid, caffeic acid, ferulic acid, and malonic acid, were characterized using UPLC-QToF-MS based on fragmentation patterns (Koley et al., 2020; Lin et al., 2011). Cyanidin-O-feruloylsophoroside-O-malonylglucoside produced a precursor ion at m/z 1035.2624 and characteristic fragment ions at m/z 787.2093 and 287.0563. Cyanidin-O-coumaroylferuloylsophoroside-O-malonylglucoside generated ions at m/z 1181.3008, 933.2479, and 535.1090, whereas cyanidin-O-diferuloylsophoroside-O-malonylglucoside yielded ions at m/z 1211.3108, 963.2581, and 535.1099. The fragmentation patterns were consistent with the proposed structures.
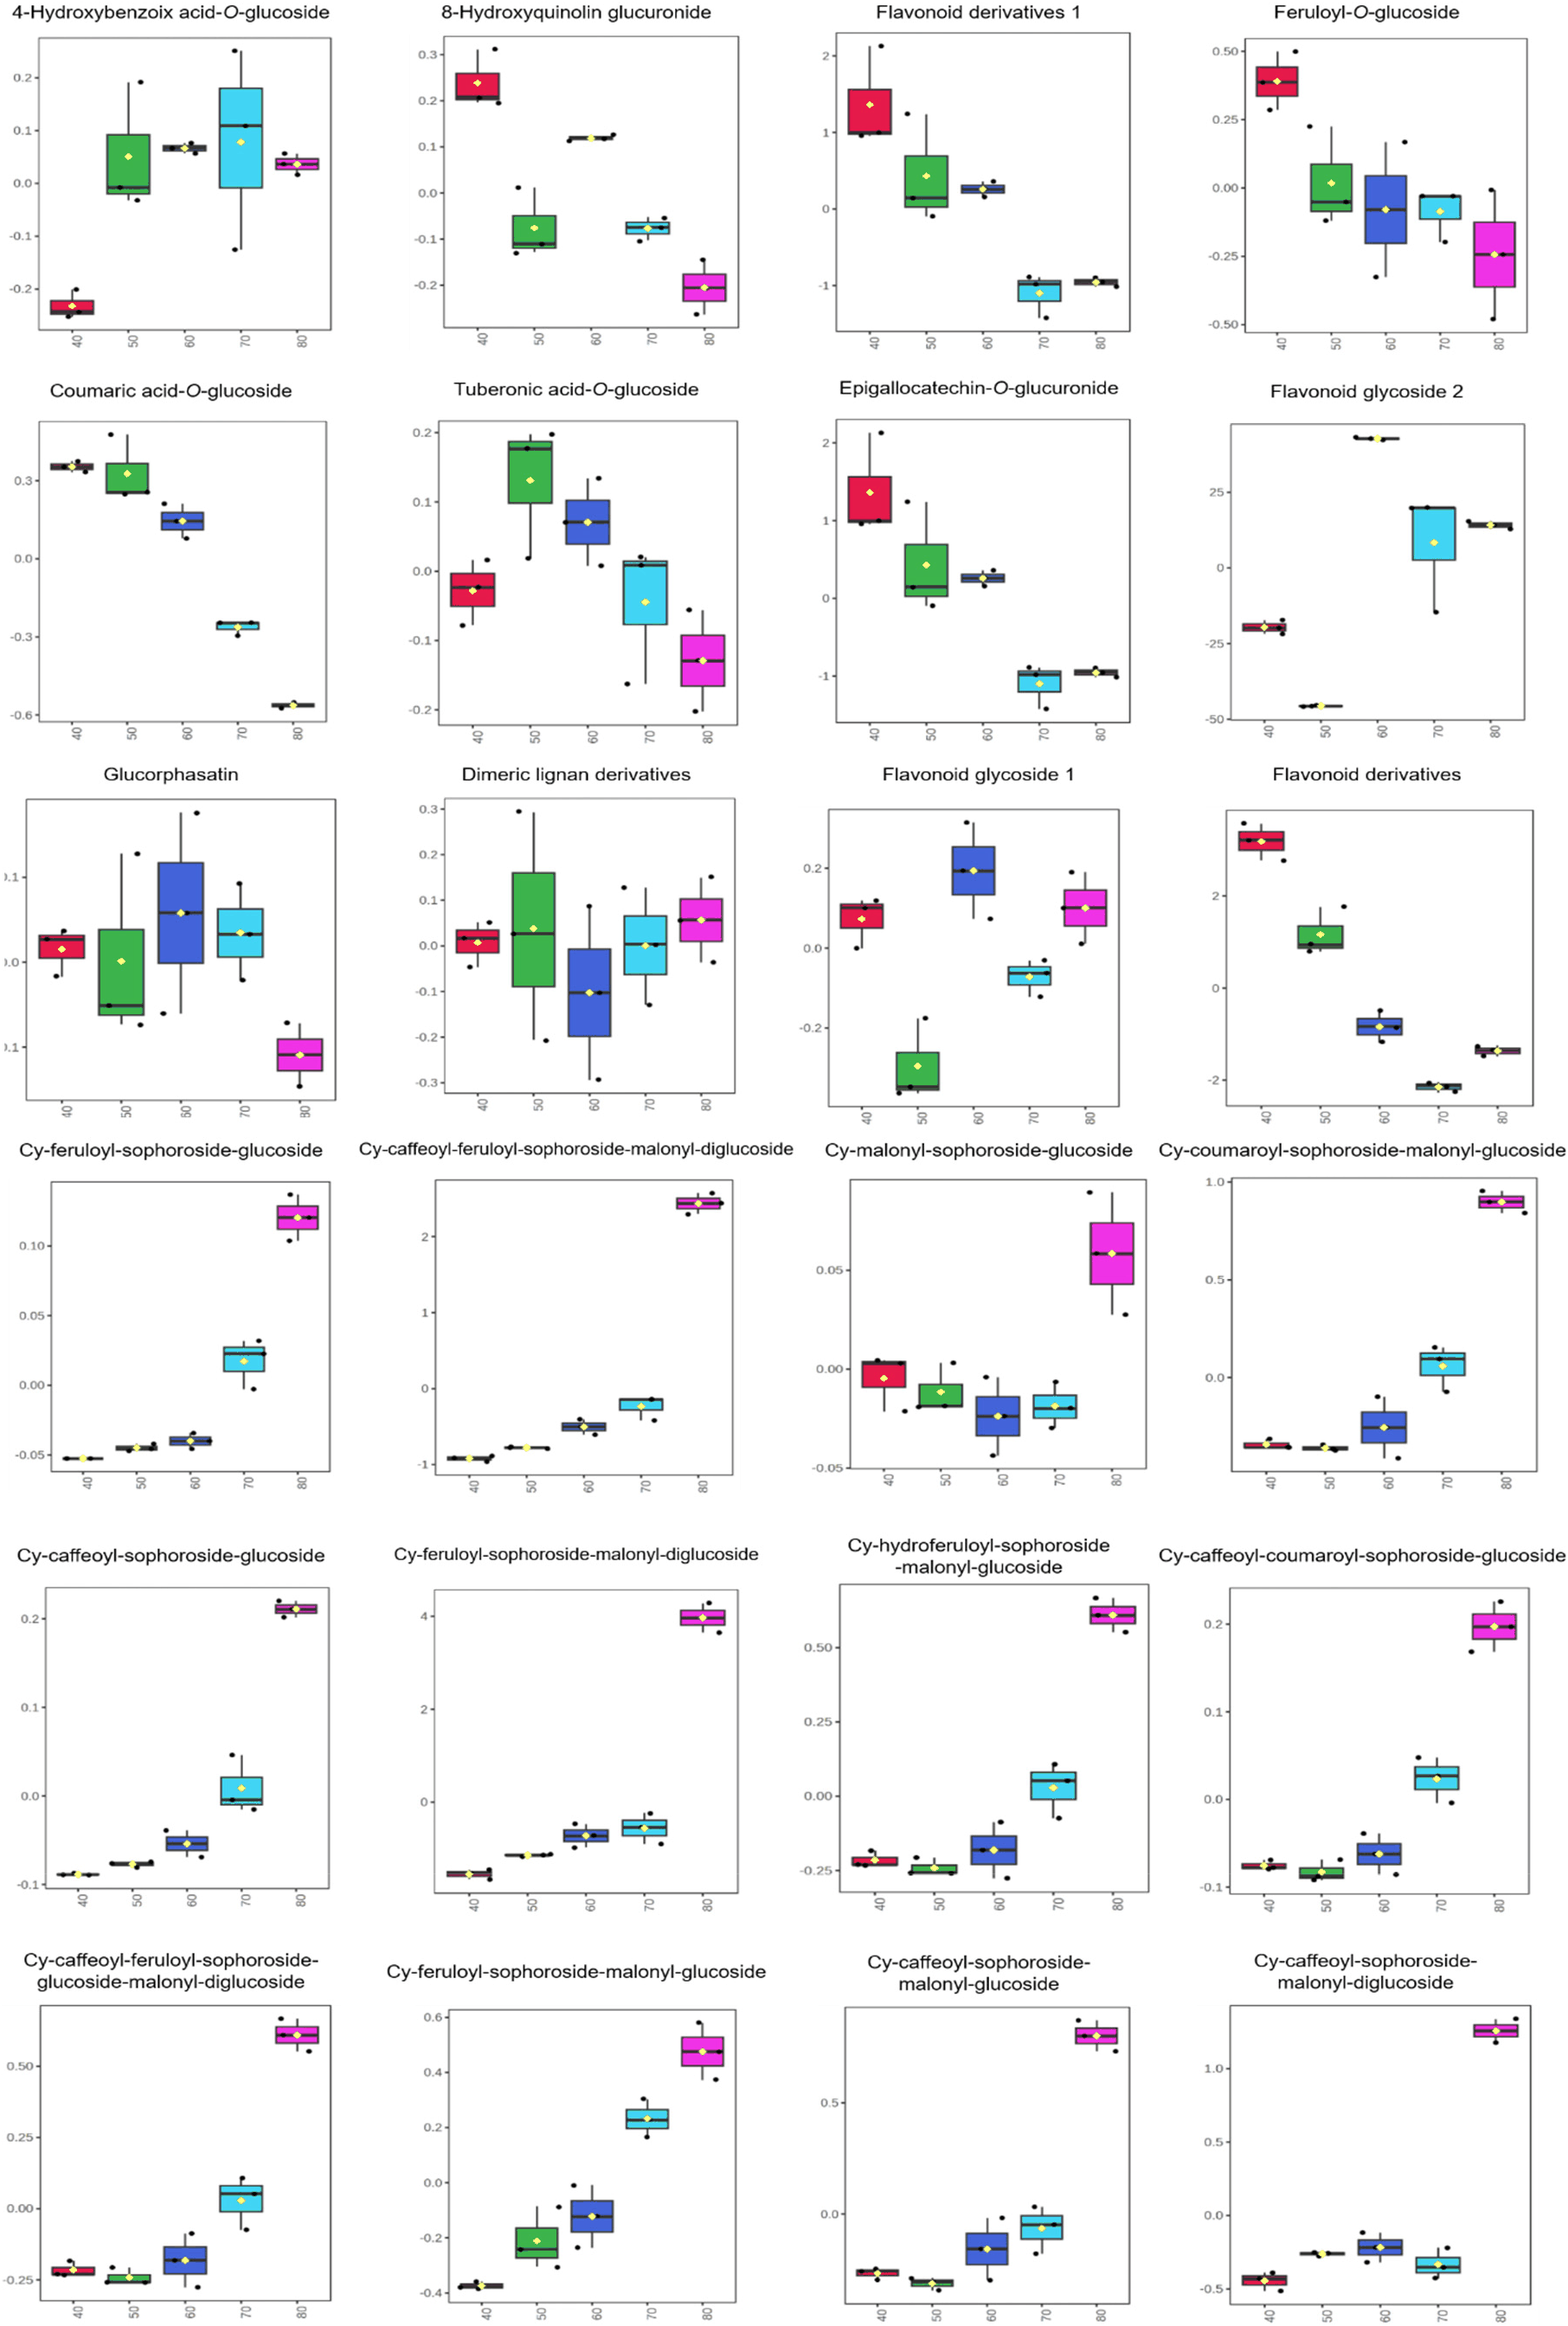
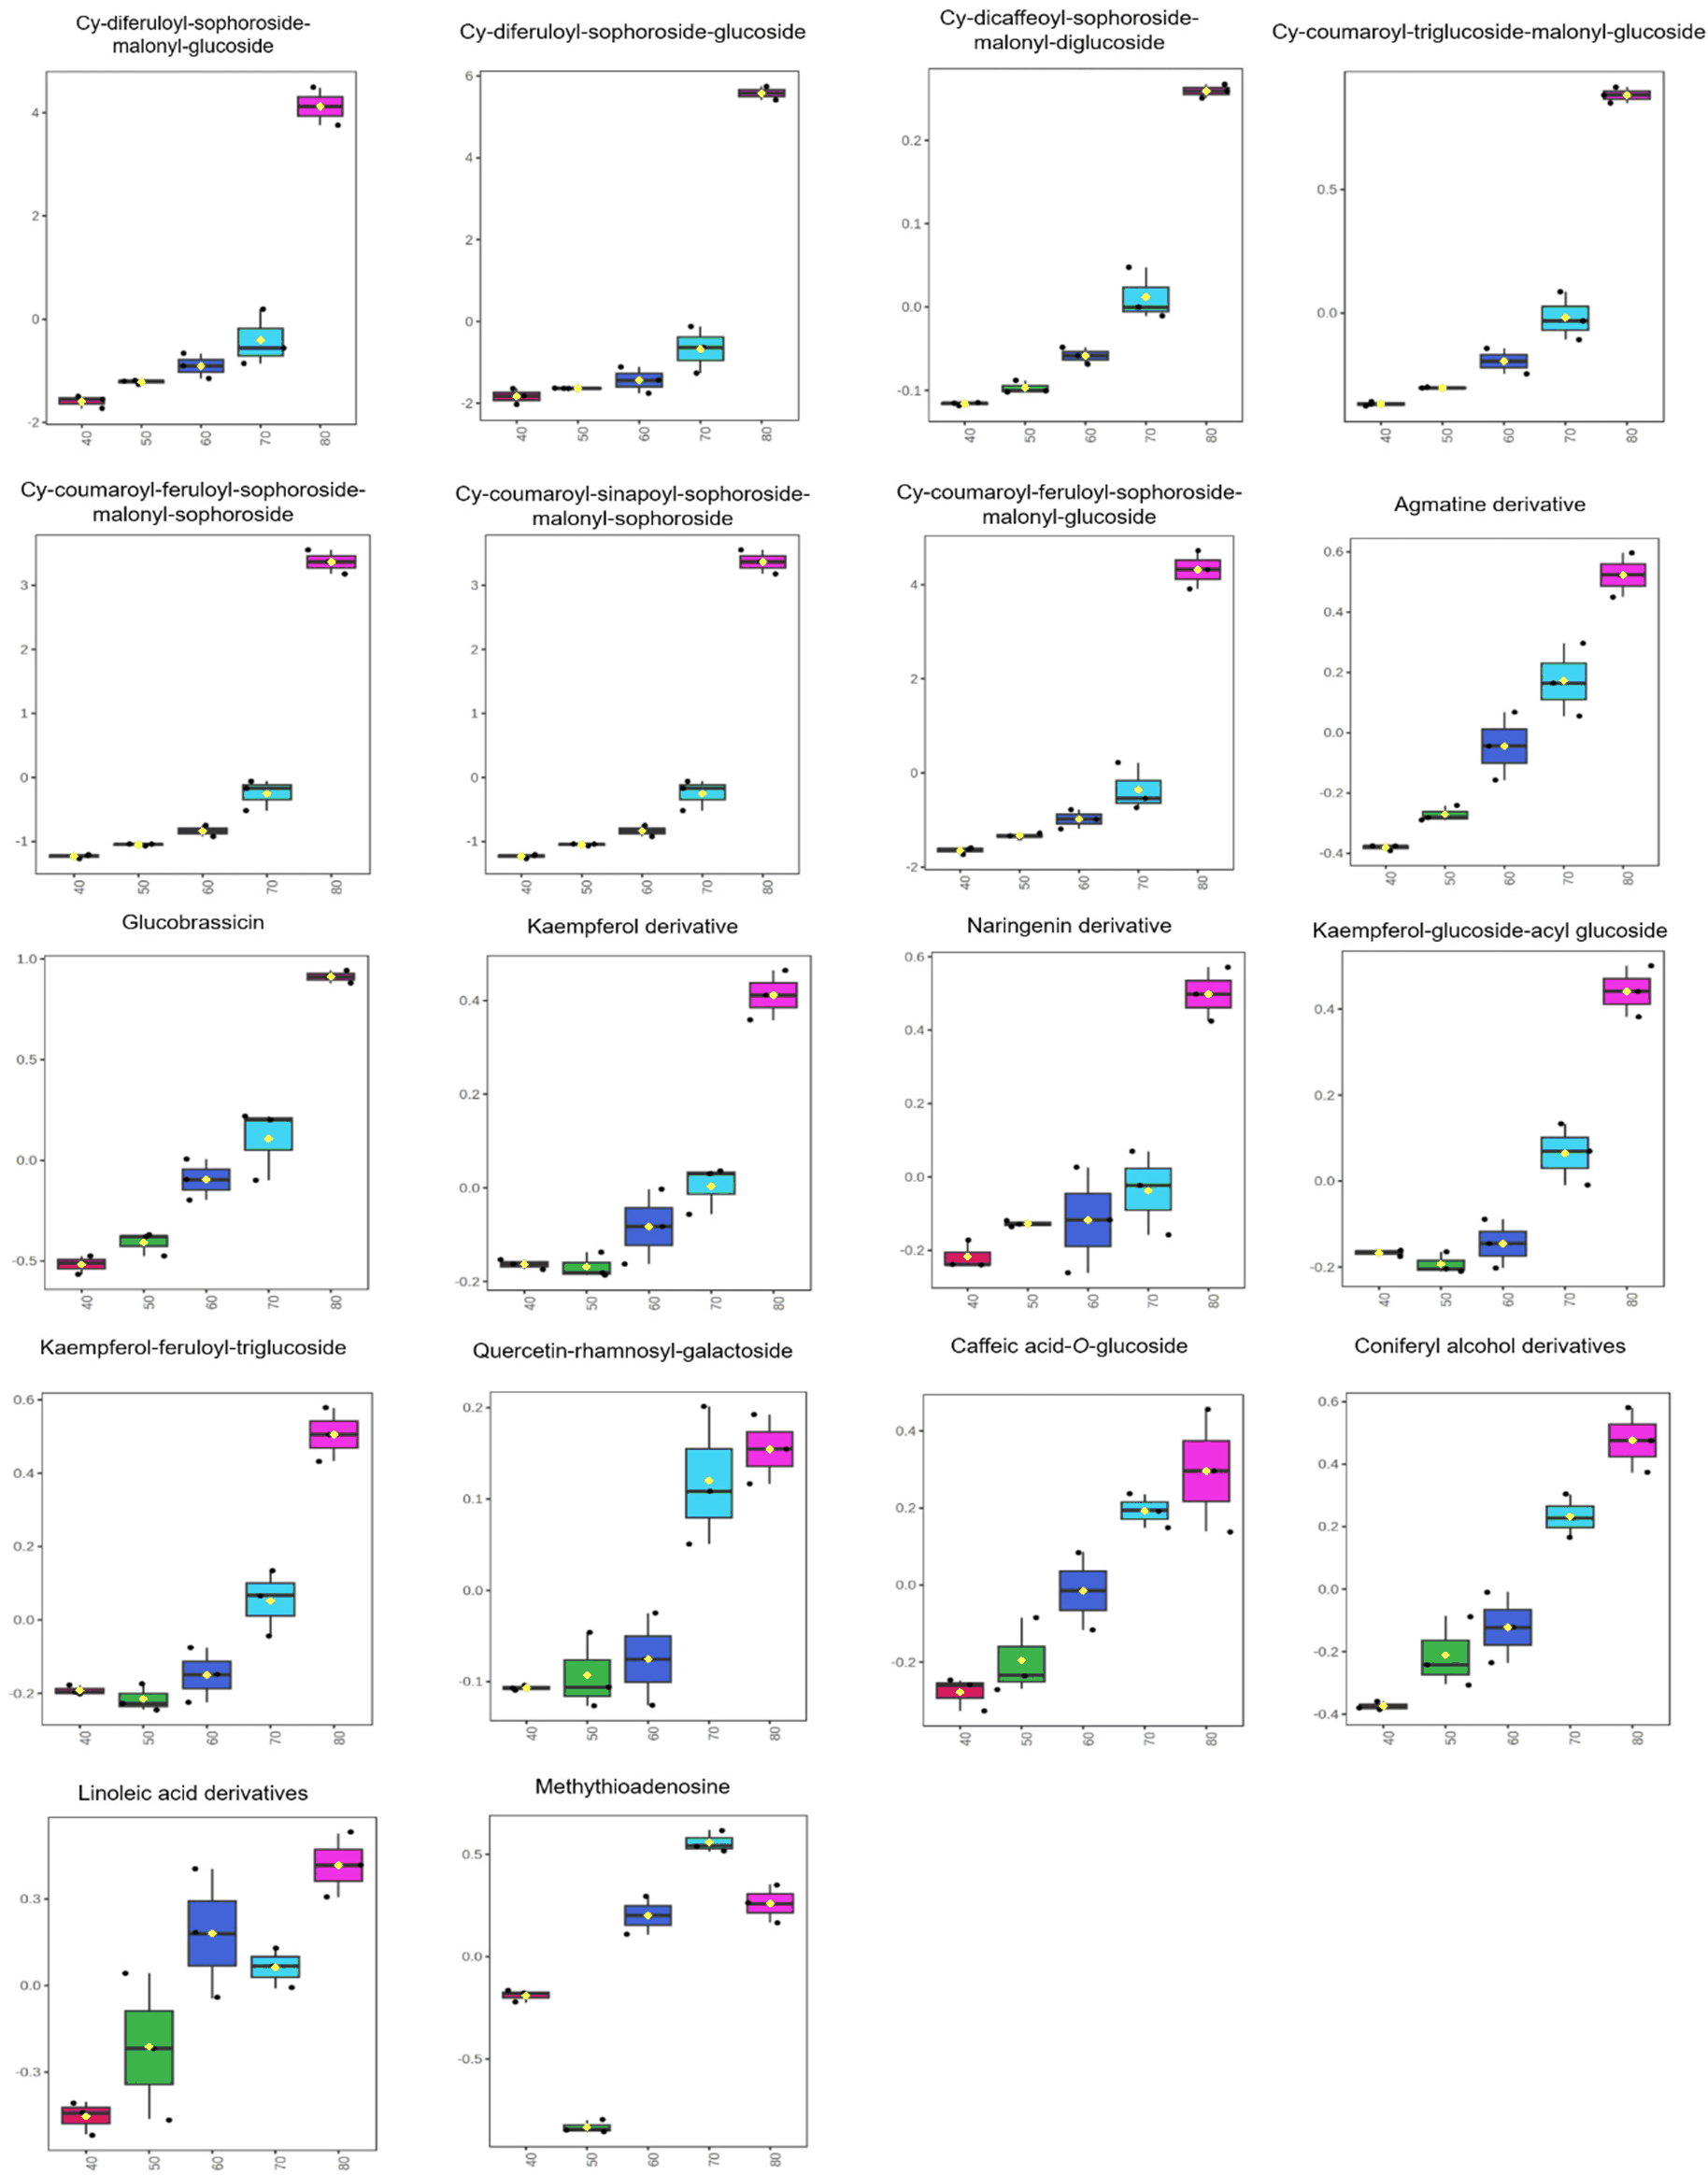
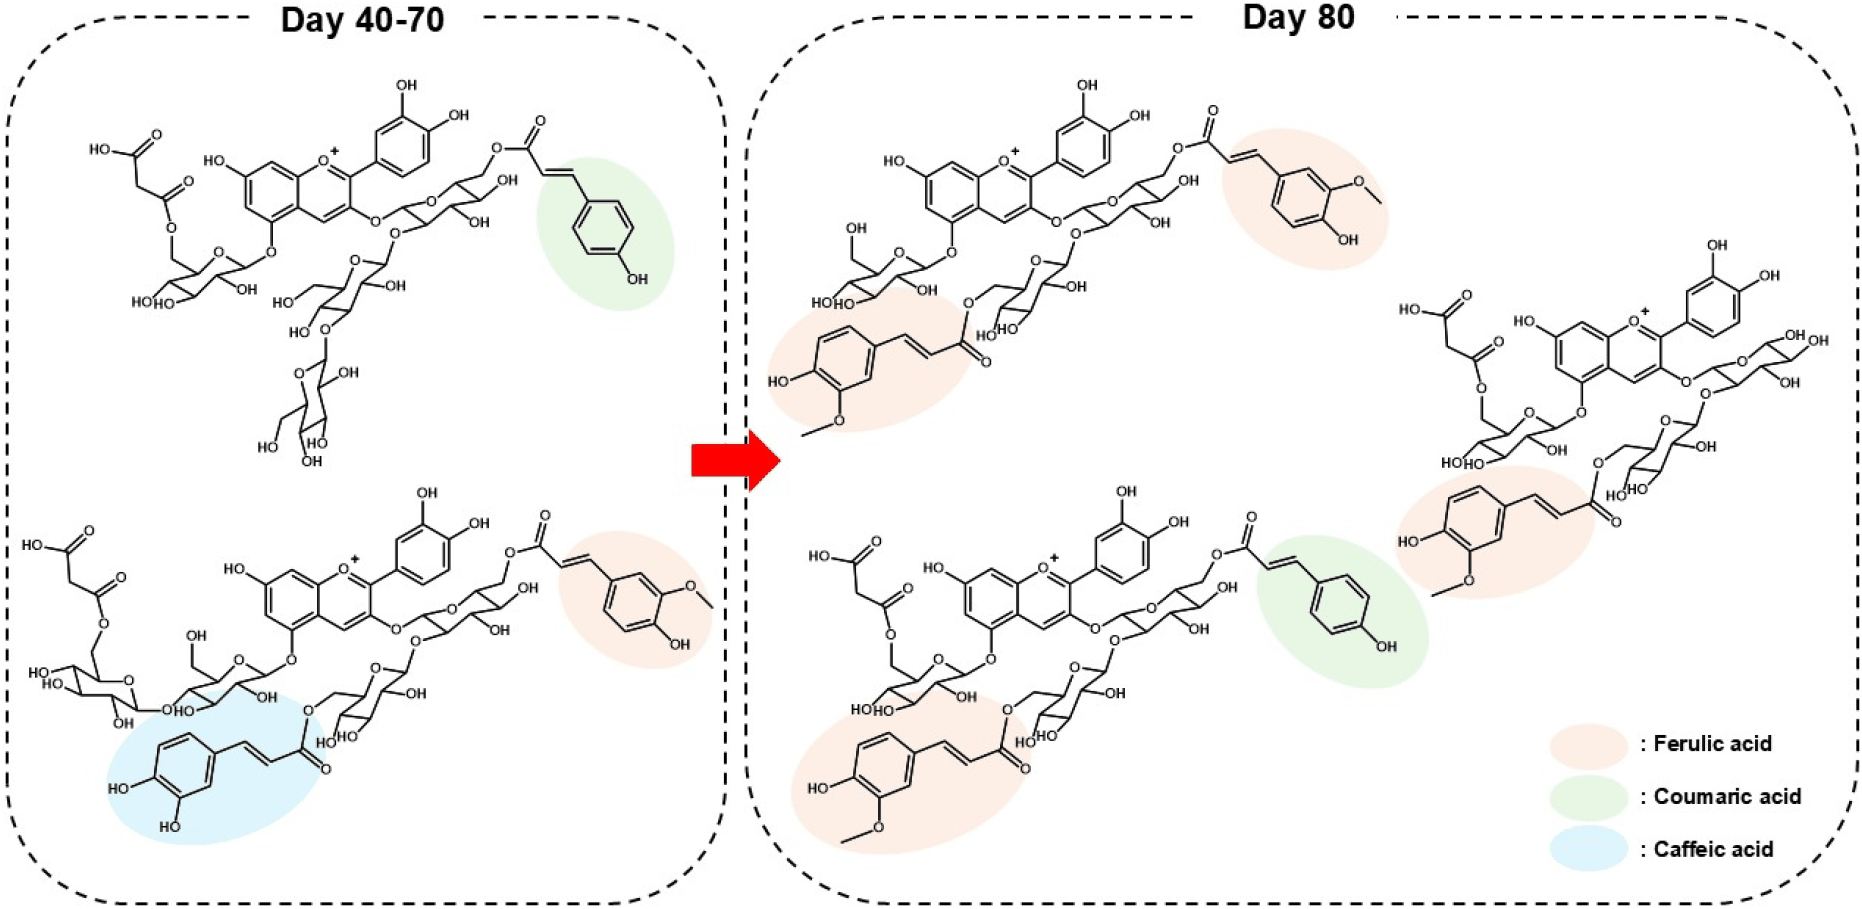
These metabolites were further examined using PLS-DA scores plot, in which components 1 and 2 explained 76.5% and 7.7% of the variation associated with the cultivation period, respectively (Fig. 2A). The contents of agmatine derivatives, glucobrassicin, kaempferol derivatives, naringenin derivatives, kaempferol-O-glucoside-O-acylglucoside, kaempferol-O-feruloyltriglucoside, quercetin-O-rhamnosylgalactoside, caffeoyl-O-glucoside, and coniferyl alcohol derivatives significantly increased over the cultivation period (Fig. S3), while the levels of 8-hydroxyquinoline glucuronide, feruloyl-glucoside, coumaric acid-O-glucoside, tuberonic acid-O-glucoside, epigallocatechin-glucuronide, and glucoraphasatin significantly decreased. Among these, seven cyanidin glycosides—cyanidin-O-coumaroylferuloylsophoroside-O-malonylsophoroside, cyanidin-O-coumaroyl-sophoroside-O-malonylglucoside, cyanidin-O-feruloylsophoroside-O-malonyldiglucoside, cyanidin-O-diferuloylsophoroside-O-glucoside, cyanidin-O-caffeoylsophoroside-O-malonylglucoside, cyanidin-O-coumaroylferuloylsophoroside-O-malonylglucoside and cyanidin-O-diferuloylsophoroside-O-malonylglucoside—were identified as exhibiting significant changes during the cultivation period (Variable importance in projection score > 1.5 and p < 0.001; Fig. 2B). From days 40 to 70, cyanidin glycosides were conjugated with caffeic or coumaric acids and tri- or di-glycoside moieties. On day 80, these compounds were conjugated with ferulic or coumaric acids and di- or mono-glycoside moieties (Fig. S4). Cyanidin derivatives containing coumaric and caffeic acids were identified between 40 and 70 days, while cyanidin derivatives containing ferulic acid were identified at day 80. Anthocyanins containing phenolic acids and organic acids are reported to enhance structural stability by increasing electronic stability (Zhao et al., 2017). When compared with non-acylated forms, acylated anthocyanins exhibit enhanced resistance to light degradation, pH instability, high temperature, and oxidative stress, improving color stability (Teng et al., 2022; Uzun et al., 2025; Zhao et al., 2017). In addition, significant increases in the levels of acylated cyanidin glycosides, including the seven identified above, were observed at the late-growth stage (Fig. 2C). Therefore, the changes in the structural characteristics of cyanidin glycosides are believed to be biochemical reactions that enhance the stability of cyanidin at later growth stages. Changes in anthocyanin composition during the growth period may be attributed to the structural modification of functional groups, which has been suggested to influence their physiological stability and storage characteristics.
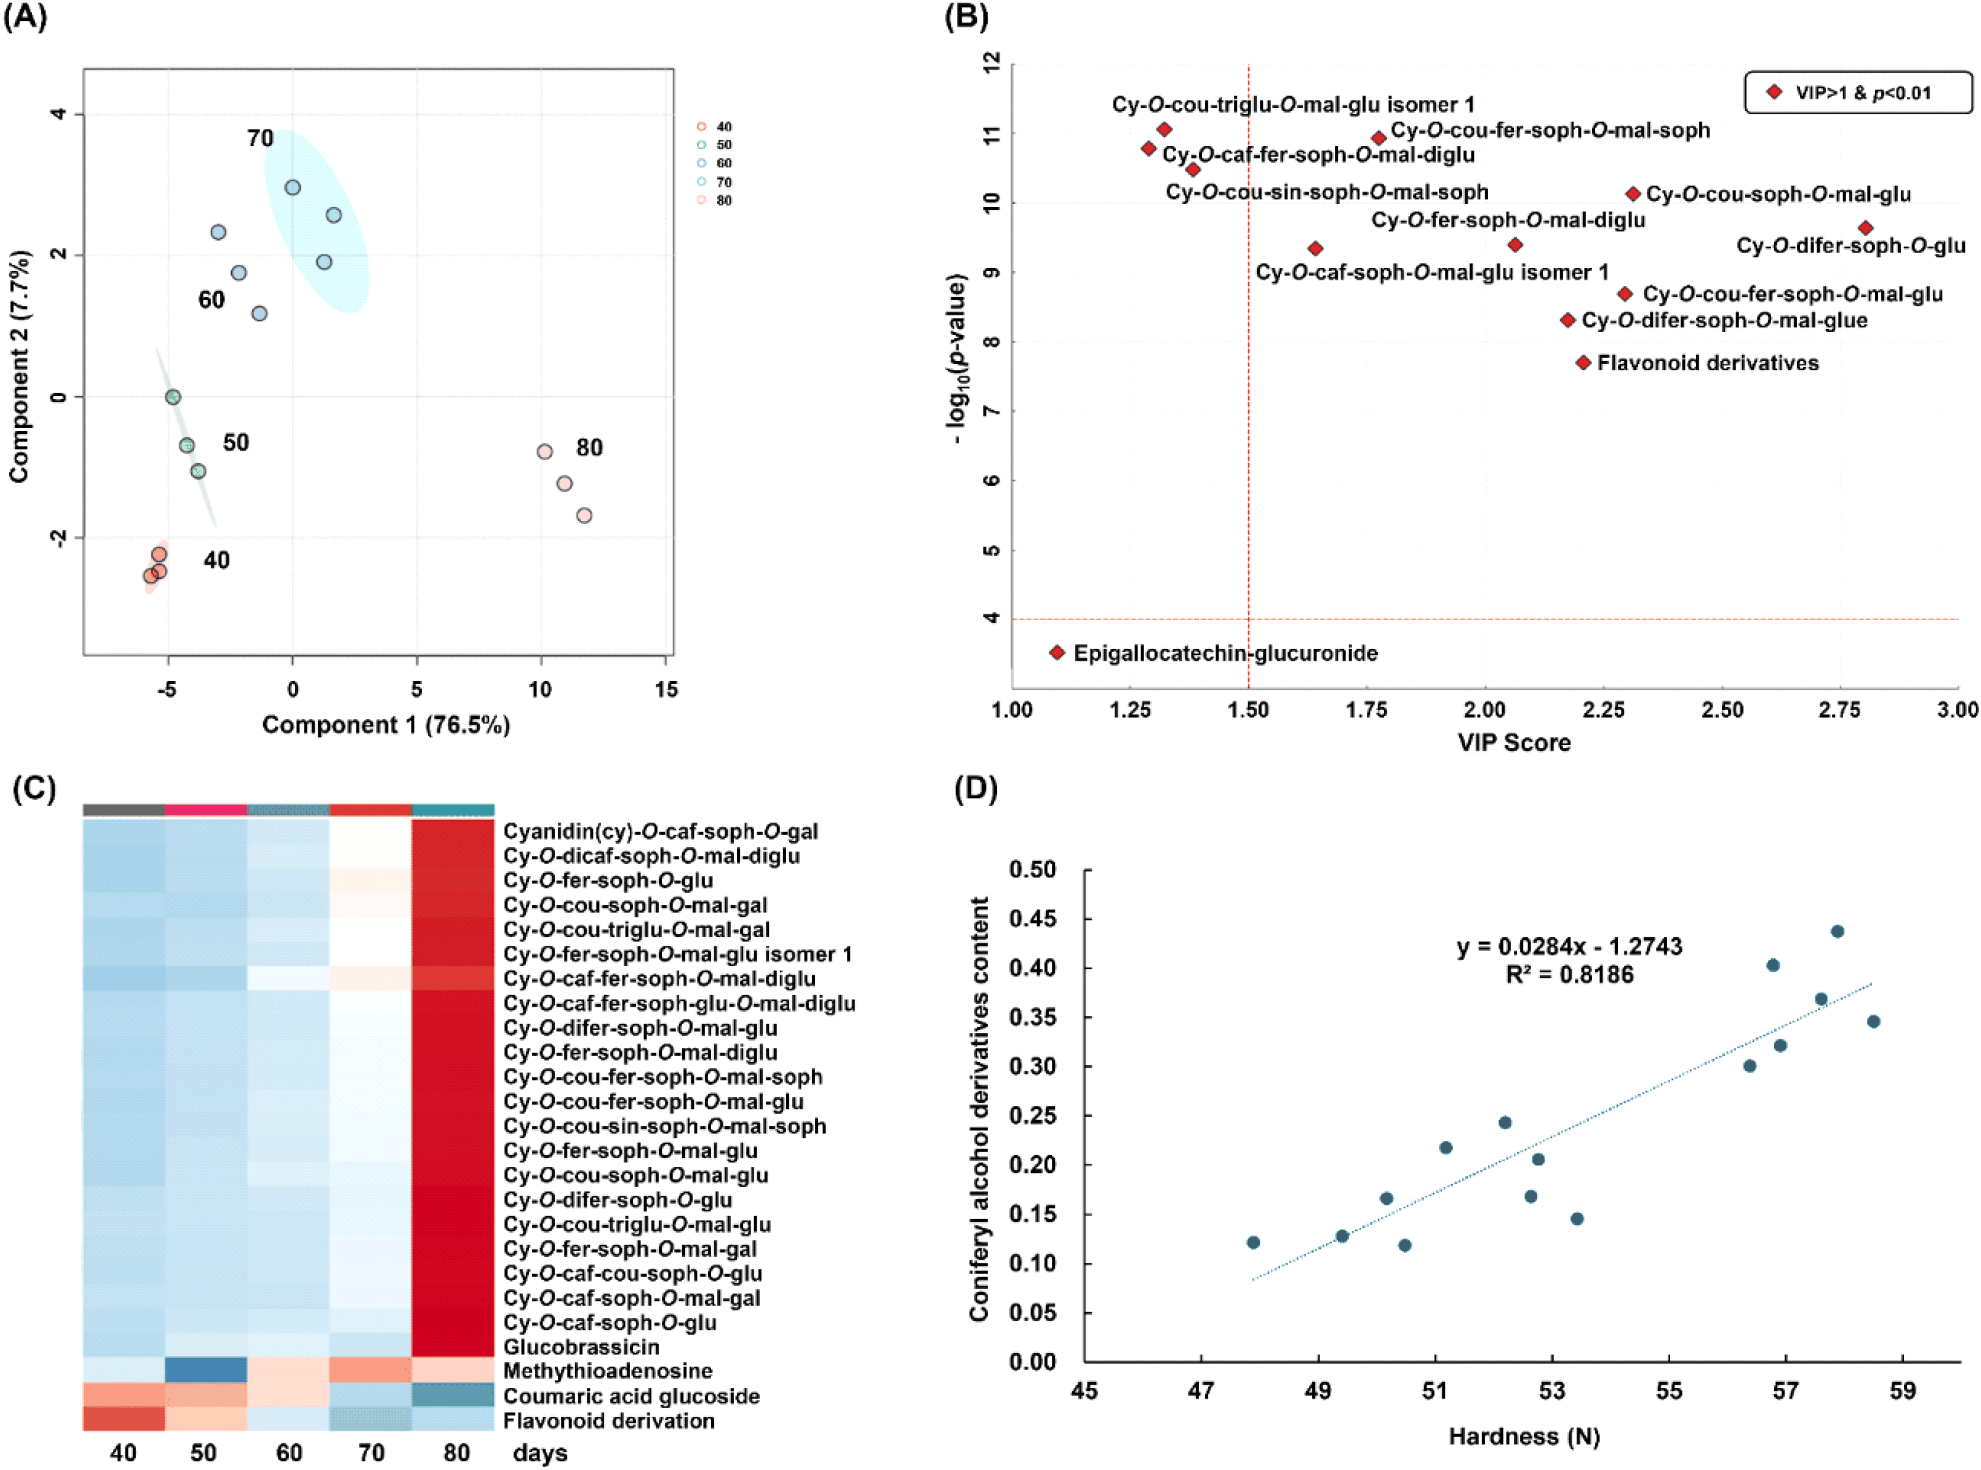
The accumulation of cyanidin glycosides observed in purple radish roots may reflect increased metabolic flux through the phenylpropanoid pathway during the late growth stage. In this pathway, phenylalanine is sequentially converted into anthocyanins through the coordinated action of key enzymes, including phenylalanine ammonia-lyase, chalcone synthase, and dihydroflavonol 4-reductase, leading to the biosynthesis of cyanidin-based anthocyanin (Cai et al., 2025; Crifò et al., 2012; Liu et al., 2019; Wang et al., 2020). These metabolite profiles are consistent with enhanced anthocyanin biosynthesis through the phenylpropanoid pathway during root development. The phenylpropanoid pathway is reported to be involved not only in anthocyanin accumulation, but also in the production of other secondary metabolites, such as flavonoids and lignin (He et al., 2024). In a previous study, lignin biosynthesis was promoted by cold stress and aging, which also led to increases in coniferyl alcohol and lignin contents (Wang et al., 2025). Similarly, in the present study, coniferyl alcohol derivatives increased during the late growth stage in Boraking radish and were positively correlated with peel hardness (R2 = 0.82, Fig. 2D), suggesting enhanced cell wall reinforcement during root maturation.
Previous studies have suggested that phenylpropanoid- and glucosinolate-derived metabolites are coordinately regulated in Brassicaceae species, indicating potential interactions between these metabolic pathways (Ahmed et al., 2015; Tang et al., 2023). The metabolite profiles observed in the present study are consistent with these reports, although the underlying molecular mechanisms were not directly investigated. The coordinated changes in cyanidin glycosides, glucoraphasatin, and coniferyl alcohol derivatives suggest a shift in secondary metabolite composition during the late growth stage under decreasing temperature conditions. The metabolite changes observed in the Boraking radishes may reflect a cultivar-specific environmental adaptive metabolic strategy. In particular, these results suggest that cultivation temperature may contribute to the accumulation of bioactive compounds during root development, thereby affecting the functional properties of purple radish. These growth stage-dependent metabolic changes provide useful information for understanding quality development during cultivation and may contribute to determining the optimal harvest stage for producing high-quality purple radish raw materials.
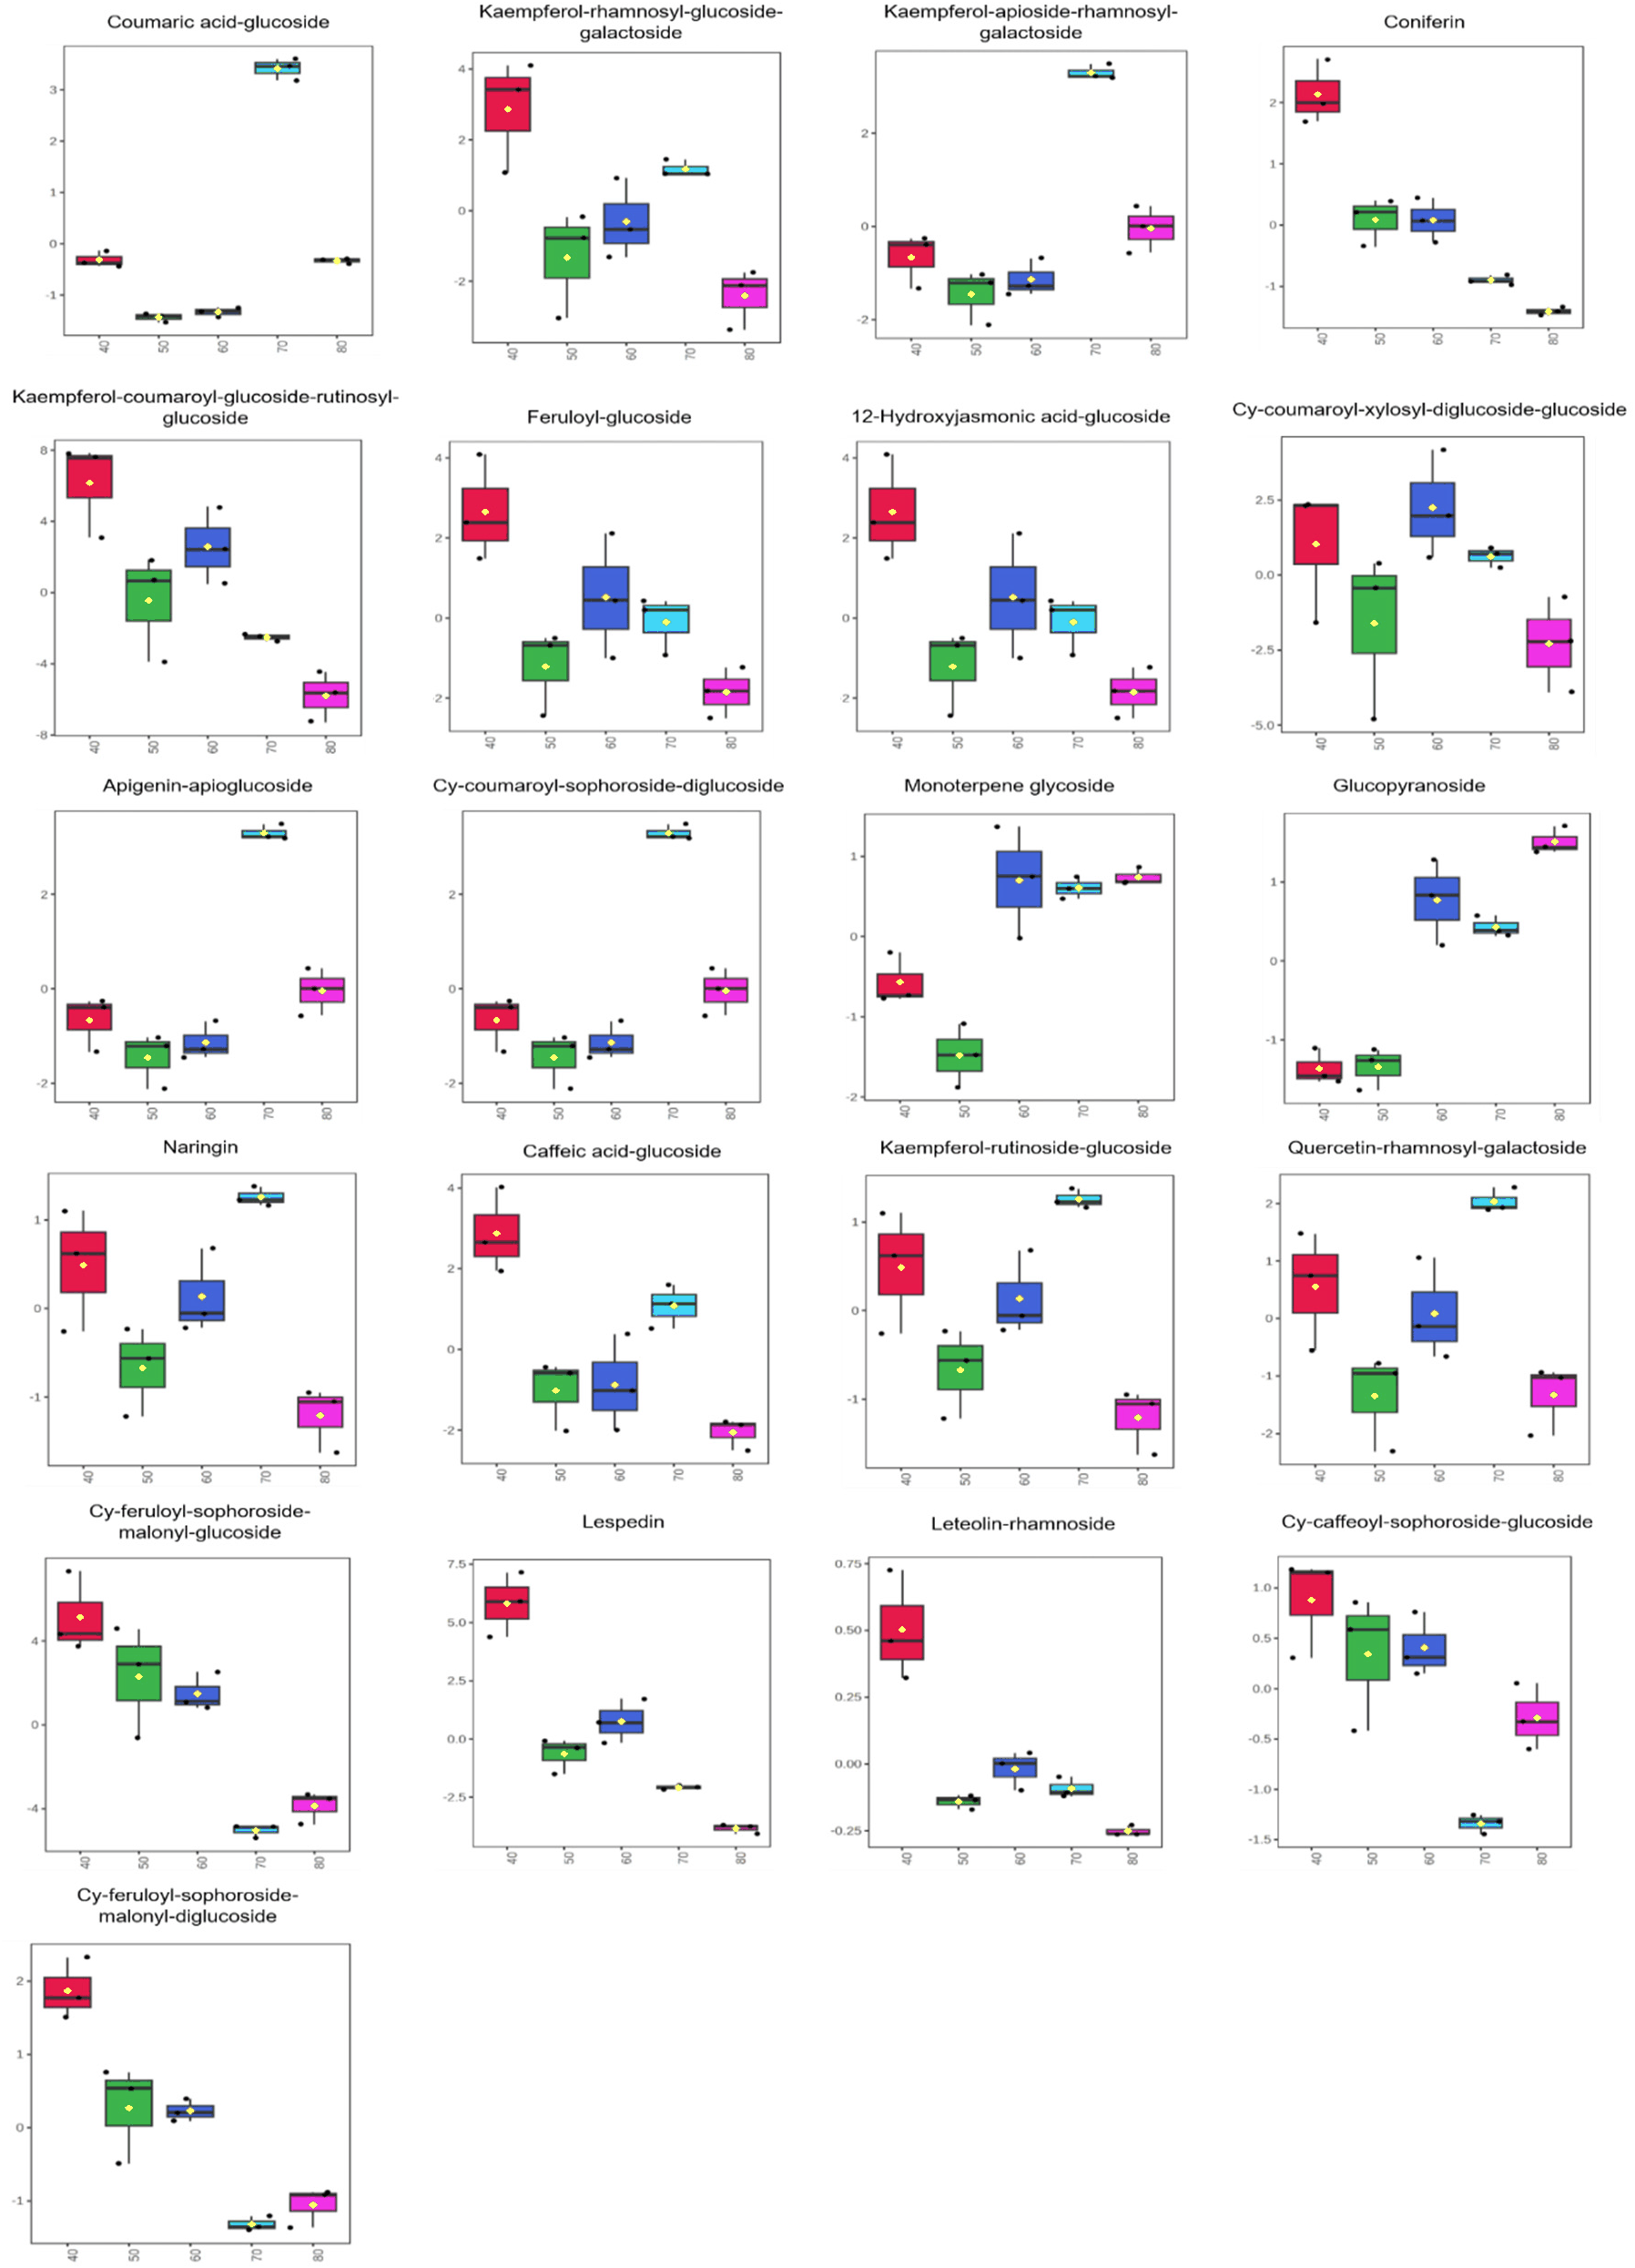
The metabolites in purple radish leaves were analyzed using UPLC-QToF-MS to identify changes in bioactive compounds, such as flavonoids and anthocyanins, throughout the cultivation period. A total of 30 metabolites were identified, including 7 phenolic acids, 13 flavonoids, and 6 cyanidin glycosides (Fig. S5, Table 4).
These metabolites were examined using a PLS-DA scores plot, in which components 1 and 2 explained 66.4% and 21% of the variation, respectively (Fig. 3A). From days 40 to 80, a gradual decline was observed in the contents of the anthocyanin derivatives cyanidin-O-feruloylsophoroside-O-malonyldiglucoside and cyanidin-O-feruloylsophoroside-O-malonylglucoside, and several bioactive compounds, including ferulic acid-glucose, lespedein, coniferin, kaempferol-O-coumaroylglucoside-O-rutinosylglucoside, luteolin derivatives, apigenin-apioglucoside, and caffeic acid glucosides (Fig. 3B). The levels of some kaempferol glycosides—kaempferol-O-apioside-O-rhamnosylgalactoside, kaempferol-O-rutinoside-O-glucoside, and kaempferol-O-rutinoside-O-galactoside—were observed to increase during the late growth stage (Fig. S6).
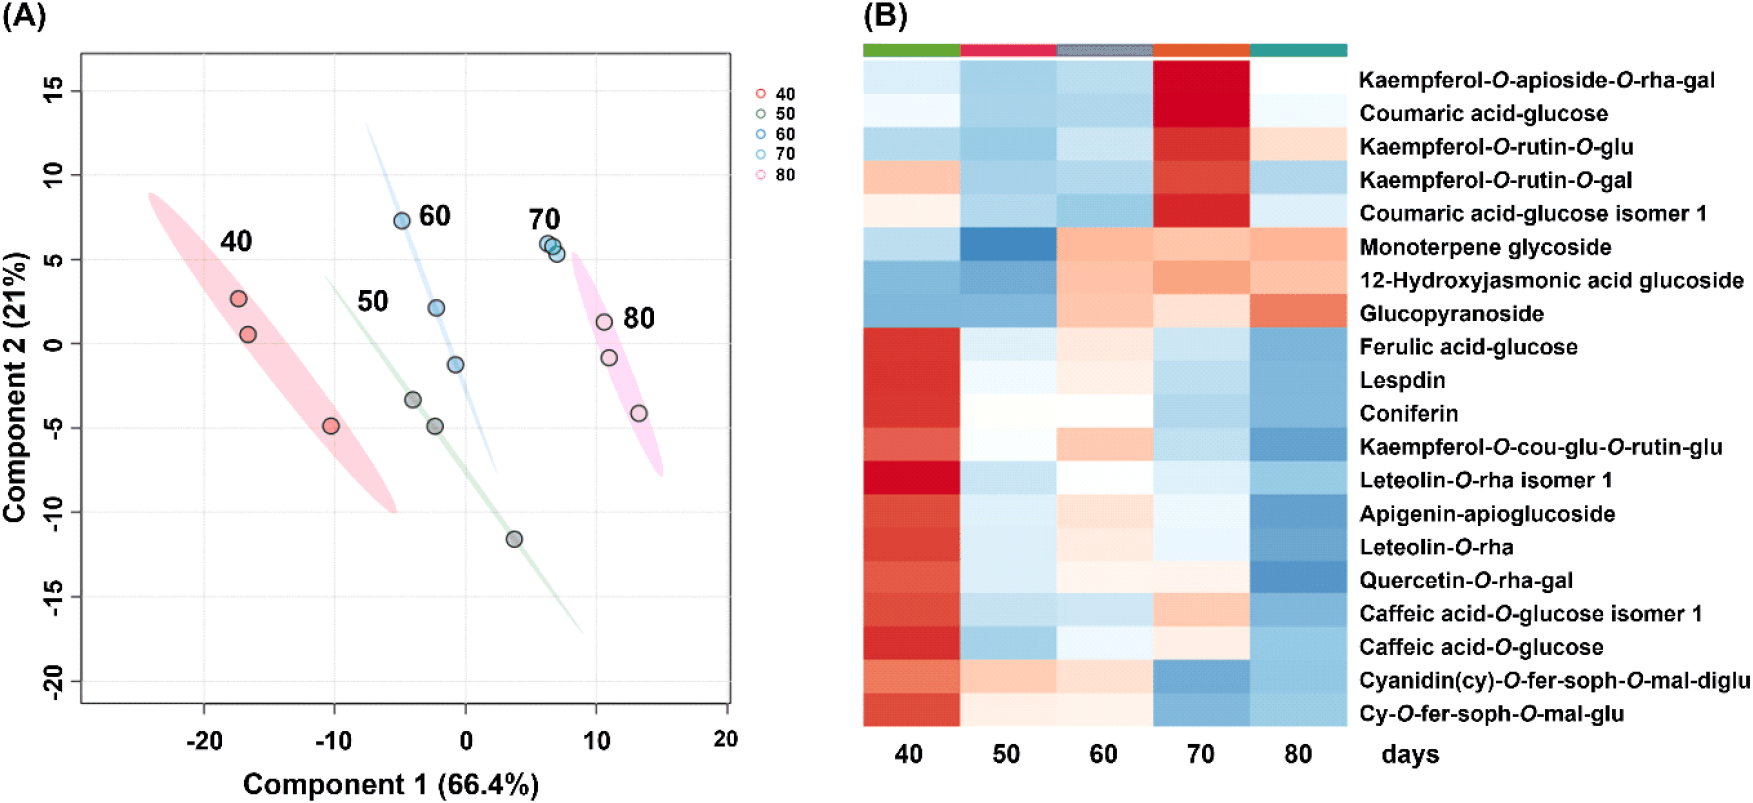
Although leaf length and fresh weight increased progressively during the later growth stages, the levels of most bioactive compounds, including flavonoids, phenolics, and anthocyanins, showed declining trends. This pattern may be explained by a dilution effect, in which leaf biomass growth surpasses secondary metabolite synthesis, resulting in a lower concentration per unit mass. Dilution effects influencing bioactive compound contents have been reported in several Brassicaceae crops (Baenas et al., 2014; Fazal et al., 2016; Šalić and Šamec, 2022; Wurst et al., 2006). Furthermore, the decline in functional compound levels in purple radish leaves may be attributed to the suppression of the secondary metabolism due to factors like physiological maturation; senescence-inducing environmental factors, such as low temperature and reduced light availability; and physiological aging (Padilla-González et al., 2020; Park et al., 2020; Silva et al., 2023). Kaempferol glycosides exhibit stability under high environmental stress, protect cells from oxidative damage, and accumulate efficiently within plant organs (Astarita and Santarém, 2008; Laoué et al., 2022). The changes seen in the kaempferol glycoside profiles of purple radish leaves may reflect metabolic stability and stress-associated metabolic responses during aging and environmental adaptation.
This study’s characterization of secondary metabolite changes in purple radish across different growth stages contributes to the understanding of the physiological mechanisms that regulate the accumulation of bioactive compounds. Root fresh weight increased progressively throughout development, while root peel hardness and anthocyanin accumulation also increased during the late growth stage. These results suggest that 80 days after sowing may be an appropriate harvest stage to obtain purple radishes with desirable agronomic characteristics and enhanced functional metabolite content for use as raw materials in functional food applications. These findings may provide a strategic basis for optimizing harvest timing, enhancing specific functional metabolites, and identifying metabolic markers for breeding programs, and they provide valuable insight into the stress-induced metabolic reprogramming associated with low temperatures and aging, adding to our knowledge of the capacity for adaptive metabolic regulation in response to environmental stress in plants.
4. Conclusions
This study investigated changes in growth parameters and bioactive compound profiles of purple radishes throughout their cultivation. During the late growth stage, anthocyanin composition shifted toward structurally more stable acylated cyanidin glycosides, resulting in the accumulation of cyanidin glycosides and lignin precursors. These compositional changes may enhance pigment stability and increase the potential value of purple radish as a functional food ingredient and natural colorant. These metabolites gradually increased throughout the cultivation period and were associated with elevated chromaticity (a* value) and tissue hardness. These results suggest that 80 days after sowing may be an appropriate harvest time for obtaining purple radishes with desirable agronomic characteristics and enhanced functional metabolite content. The content of bioactive compounds gradually declined in the purple radish leaves during the same period. This reduction was attributed to a combination of dilution effects caused by biomass expansion and the suppression of secondary metabolic activity due to cold temperatures, low light, and physiological aging. The proposed harvest stage may facilitate the production of purple radishes with enhanced functional quality and provide practical guidance for their utilization as high-value raw materials for functional food applications. These findings provide a scientific basis for establishing harvest strategies that maximize both crop quality and functional value according to the intended end use.