

1. Introduction
Fish is an important component of human diets worldwide as it provides high-quality protein, essential fatty acids, vitamins, and minerals. In Nigeria, Clarias gariepinus (African catfish) and Oreochromis niloticus (Nile tilapia) are among the most widely consumed freshwater species owing to their availability, affordability, and consumer preference (Adeyeye et al., 2016; Bawa, 2024; Onwenwaori et al., 2024). These species provide a significant source of polyunsaturated fatty acids (PUFAs), particularly omega-3 fatty acids, which are associated with reduced risk of cardiovascular diseases and improved overall health (Badoni et al., 2021; Phogat et al., 2022). However, the nutritional and sensory qualities of fish are largely influenced by post-harvest handling and cooking practices (Ali et al., 2021; Moussa et al., 2014).
Cooking is necessary for enhancing the flavor, texture, safety, and digestibility of fish. Nevertheless, different cooking methods, such as boiling, frying, grilling, smoking, and baking, have varying effects on the lipid composition, oxidative stability, and sensory acceptability (Abraha et al., 2018; Ali et al., 2021). Heat treatment can alter the balance of saturated, monounsaturated, and polyunsaturated fatty acids by promoting lipid oxidation or degradation of thermolabile compounds (Castro-González et al., 2015). Consequently, the choice of cooking method determines consumer satisfaction and the health-promoting potential of fish-based diets (Abraha et al., 2018; Ali et al., 2021).
Despite the importance of catfish and tilapia in Nigerian diets, limited information is available on the impact of common domestic cooking methods (boiling, frying, and smoking) on their fatty acid profiles and sensory attributes. Understanding these changes is crucial for guiding consumers toward healthier cooking practices and promoting the nutritional value of fish in the local food system. Therefore, this study evaluated the influence of different cooking methods on the fatty acid compositions and sensory characteristics of catfish and tilapia in Nigeria.
2. Materials and methods
The fresh fish samples used in this study were from fishponds in the Lower Niger River Basin, located in Ilorin, Kwara State, Nigeria. Forty samples, each of catfish (Clarias gariepinus) and tilapia (Oreochromis niloticus), were collected in a water bath. The average weights of the catfish and tilapia samples were 600.00 ± 2.39 g, and 500.00 ± 2.50, respectively. The samples were then transported to the Agricultural Laboratory at Kwara State University, Malete, Nigeria. After being gutted, the fish were adequately cleaned in water and subjected to different cooking methods.
Ten catfish and tilapia samples (≈1.5 kg each) were boiled in 1 L of water at 100°C on a gas stove for 10 min (Oluwaniyi et al., 2010).
Ten catfish and tilapia samples (≈1.5 kg each) were fried in 12-inch nonstick pans using a blended vegetable oil containing palmitic, stearic, oleic, and linoleic acids (specific gravity: 0.8366 g/cm3) at 176°C for 10 min. The fish were turned every 2 min to ensure even cooking (Nursyahirah and Rozzamri, 2022).
Ten catfish and tilapia samples (≈1.5 kg each) were smoked in a locally fabricated cylindrical mud stove (490 × 290 × 100 mm) fueled with African balsam wood. Batches of 10 kg were exposed to hot smoke (60-110°C) for 5 h, with turning every 45-60 min. The smoked fish were then air dried and cooled at 27°C for 30 min (Issa et al., 2020).
Following the procedure described by Chémat et al. (2015), the meat samples were oven-dried to enhance the lipid extraction. The dried samples were finely ground to increase the surface area exposed to the solvent, and the bound lipids were released by acid hydrolysis. Ground fish samples (30 g) were homogenized in a blender (Smart Leaf VTCL, 18,000 rpm, India) with 60 mL methanol and 30 mL chloroform for 2 min. After 30 sec, an additional 30 mL of chloroform and distilled water were added, and the homogenate was stirred and filtered through Whatman No. 1 filter paper using a Buchner funnel under suction. The lower phase was drained into a 250 mL round-bottom flask and concentrated at 40°C using a rotary evaporator (RE-52A Model, England).
The extracted fatty acids were transmethylated to fatty acid methyl esters (FAMEs) using 0.66 N KOH in methanol and 14% methanolic boron trifluoride (Signia Chemical Co., St. Louis, MO, USA) according to AOAC (2005). Eicosanoic acid (10 μg/mL) was used as the internal standard. The FAMEs were separated on a gas chromatograph equipped with a flame ionization detector (GC-FID; Model 6890, Agilent Technologies, Santa Clara, CA, USA) using fused silica capillary columns with a 10:1 split injection and helium as the carrier gas with an injection volume of 1 μL.
The water-holding capacities (WHCs) were determined using the method of Zhang et al. (1995). 1 g of the sample was mixed with 10 mL of distilled water in centrifuge tubes (Rotina 420 R Benchtop Centrifuge, Germany) for 30 sec. The mixture was left at room temperature for 30 min and then centrifuged at 3,000 rpm for 25 min. The WHCs were calculated using the following equation:
where Wa is the weight of the solution added to the sample, Wr the weight of the solution removed after centrifugation, and Wm the weight of the meat sample.
Fish samples (200 g) from each cooking method were trimmed to remove external fat, labeled, wrapped in cellophane, and stored at room temperature until the evaluation. A sensory assessment was conducted by 20 trained panelists using the procedure described by Meilgaard et al. (2006). A structured questionnaire and 9-point hedonic scale (1 = dislike extremely, 9 = like extremely) were used to evaluate the appearance, taste/flavor, texture/consistency, aroma/smell, and overall acceptability of the smoked, boiled, and fried fish samples. Ethical approval for this study was granted by the Kwara State University Ethical Committee (Ref. No. KWASU/CR&D/REA/2024/0081), in accordance with the 1964 Helsinki Declaration and its subsequent amendments on animal and human experimentation.
For fatty acid profiling, the experiment used a 4 × 2 factorial design with four cooking methods (raw, boiling, frying, and smoking) and two fish species (catfish and tilapia) in a completely randomized design. For the sensory evaluation, a 3 × 2 factorial arrangement was employed, with three cooking methods (boiling, frying, and smoking) and the same two fish species. The data were subjected to an analysis of variance (ANOVA) appropriate for each factorial design to test the main effects of cooking method and fish species, as well as their interactions. When ANOVA indicated significant differences (p < 0.05), Duncan’s multiple range test was used to separate the means. All the statistical analyses were performed using SPSS (IBM, Version 21). A principal component analysis (PCA) was performed using XLSTAT (Trial version, 2021).
3. Results and discussion
The fatty acid compositions of catfish and tilapia subjected to different cooking methods are listed in Table 1. The main effects of the fish species and cooking methods, as well as their interactions were significant (p < 0.05) (Table 2).
Among the saturated fatty acids (SFAs), palmitic acid (C16:0) was predominant, with raw tilapia exhibiting the highest value (175.94 ± 0.02 mg/g), whereas frying reduced its concentration in both species, particularly in catfish (2.49 ± 0.01 mg/g). Similar trends were observed for stearic (C18:0) and myristic (C14:0) acids, with the raw samples containing higher levels than their cooked counterparts, indicating a heat-induced degradation. Interestingly, butyric (C4:0), capric (C10:0), and lauric (C12:0) were almost absent except in fried and smoked tilapia, suggesting a method-specific generation or concentration of short- and medium-chain fatty acids during the cooking.
For the monounsaturated fatty acids (MUFAs), Oleic acid (C18:1n-9) was only detected in raw catfish (32.20 ± 0.10 mg/g) and was absent in all the processed samples, supporting the earlier findings that MUFAs are susceptible to oxidation and thermal breakdown during heat treatments (Neff et al., 2014; Zhang et al., 2013).
Notable changes were observed in the profiles of the PUFAs. Linoleic acid (C18:2n-6) content was significantly higher in the boiled samples of both species, particularly tilapia (36.72 ± 0.01 mg/g), indicating that boiling may help retain or even concentrate n-6 fatty acids. Conversely, frying eliminated the linoleic acid in catfish. Linolenic acid (C18:3n-3) was only detected in smoked catfish (87.87 ± 0.02 mg/g), suggesting that smoking enhances the stability of certain n-3 fatty acids. Arachidonic acid (C20:4n-6) appeared exclusively in boiled catfish and raw tilapia, whereas eicosapentaenoic acid (EPA) (C20:5n-3) was only found in boiled catfish (20.67 ± 0.01 mg/g), confirming that both species and cooking methods interactively influence long-chain PUFA profiles. Fish accumulate fat in their bodies, and based on their fat content, catfish and tilapia are classified as medium- and low-fat fish, respectively (Imtiaz et al., 2022). This may account for the differences in fatty acid composition between the species. The differences in fatty acids between raw catfish and tilapia have been consistently documented (Osibona et al., 2009). The differences in fatty acids between frying and other cooking methods were likely due to the cooking oil (blended oil) used (Nieva-Echevarría et al., 2016). Consistent with these findings, Neff et al. (2014) and Moussa et al. (2014) have reported differences in the fatty acid profiles of different fish species subjected to different cooking methods. In addition, cooking methods have been shown to influence the fatty acid compositions of tilapia (Dhanapal et al., 2012) and grass carp (Zhang et al., 2013).
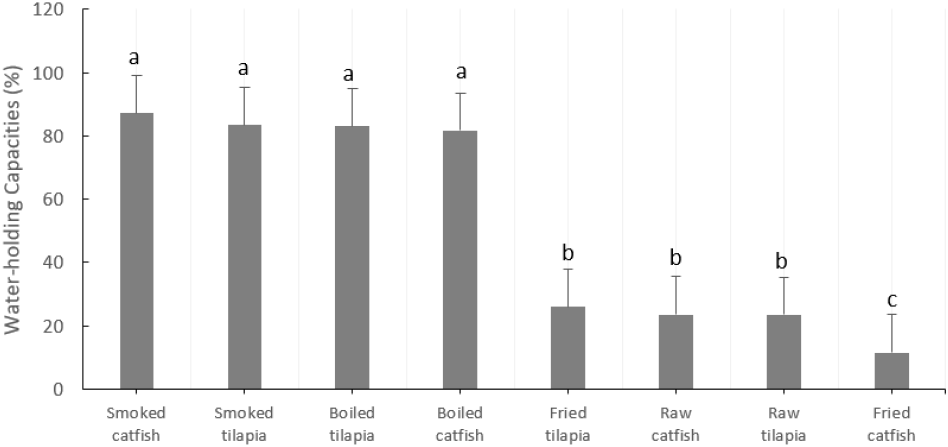
The interaction between species and cooking methods was significant for WHCs (Fig. 1). The WHCs were markedly higher in boiled and smoked samples compared to raw and fried. Smoked catfish recorded the highest WHC (87.24 ± 1.39%), whereas fried catfish had the lowest (11.58 ± 0.56%). The WHC of smoked catfish was similar to those of smoked and boiled tilapia, and boiled catfish. The WHCs of fried and raw tilapia and raw catfish were lower than those of other combinations, except for fried catfish. These variations can be explained by the protein denaturation and structural changes in muscle fibers induced by heating techniques; smoking improved the moisture retention, whereas frying promoted severe dryness due to exposure to oil. Heat-induced protein denaturation causes cooked meat to lose its solubility (Murphy and Marks, 2000).
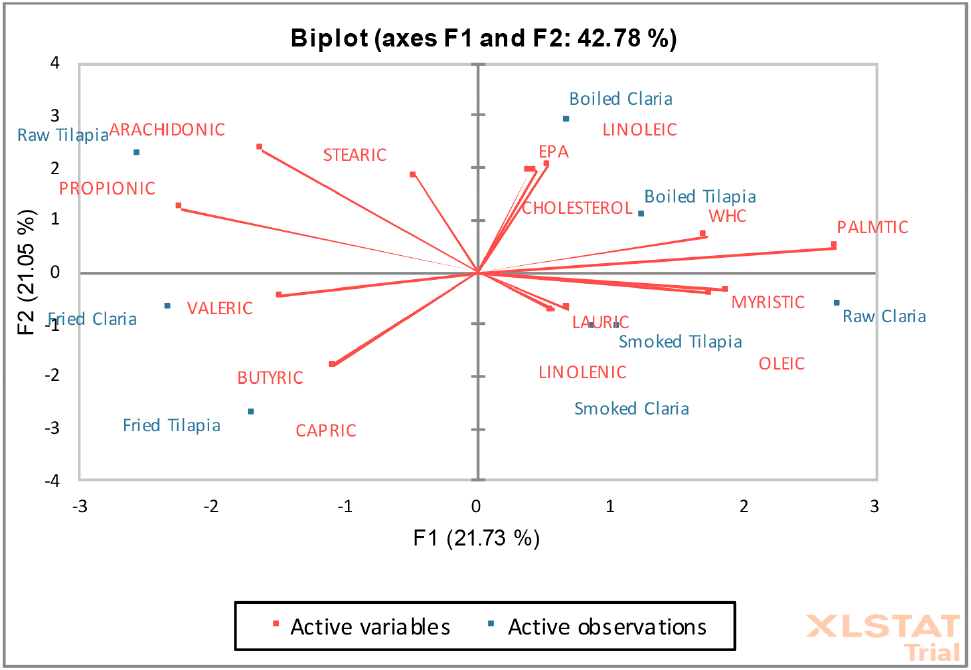
A comparison of the various cooking methods for catfish and tilapia, based on their fatty acid profiles and WHC, was conducted using the PCA biplot shown in Fig. 2. Principal components PC-1 and PC-2 accounted for 21.73% and 21.05% of the data variance, respectively, totaling approximately 42.78%. In the positive PC-1 and positive PC-2, no differences were observed between the boiled catfish and boiled tilapia in terms of linoleic, EPA, and palmitic fatty acids attributes, and their WHCs. Meanwhile, the negative PC-1 and positive PC-2 indicated no differences between the raw catfish, smoked tilapia, and smoked catfish in the myristic, lauric, linolenic, and oleic acid concentrations. However, the negative PC-1 and negative PC-2 results showed that the stearic, arachidonic, and propionic fatty acids attributes were much more significant in raw tilapia. Interestingly, in the positive PC-1 and negative PC-2, both the fried catfish and tilapia showed higher levels of SFAs (valeric, butyric, and capric) for frying compared to those for other cooking methods.
The sensory evaluation revealed that neither fish species (catfish or tilapia) nor cooking method (boiling, frying, or smoking) had a significant effect on the assessed sensory attributes, including appearance, flavor, texture, aroma, and overall acceptability (Table 3). In addition, the interaction between fish species and cooking method was not significant for sensory attributes (Table 4). This indicates that consumers found the two species equally acceptable across the different cooking techniques, suggesting that species-specific differences in muscle composition did not translate into perceptible differences after processing. The absence of significant differences among cooking methods could be attributed to the fact that boiling, frying, and smoking all effectively enhance palatability by developing desirable flavors, aromas, and textures, thereby masking subtle differences that might exist between species. The results of this study are consistent with those of Furuta et al. (2022) and Partanen et al. (2023), who observed that the sensory parameters were not significantly different across fish groups, but the cooking method itself did make a significant difference. Furthermore, trained panelists may have focused on standardized sensory attributes rather than subjective preferences, which may explain the uniformity in ratings. These findings are consistent with reports that consumer perception of fish quality is often more strongly influenced by freshness, safety, and availability than by species or cooking method (Nursyahirah and Rozzamri, 2022; Oluwaniyi et al., 2010). Importantly, the results highlight the versatility of catfish and tilapia in Nigerian diets, as either species can be processed through common household methods without compromising consumer acceptance. From a nutritional and public health perspective, this suggests that consumers may freely choose fish species or cooking techniques based on availability, affordability, or health considerations (for example, reduced oil consumption) without concern for sensory deterioration.
4. Conclusions
This study demonstrated that cooking methods significantly impact the nutritional quality of catfish and tilapia, particularly in terms of fatty acid retention and WHCs, whereas the sensory attributes remained unaffected. Boiling proved most effective in preserving n-6 fatty acids and long-chain PUFAs, such as arachidonic acid and EPA, and smoking enhanced linolenic acid (n-3) content and improved the WHCs. However, frying resulted in the greatest loss of unsaturated fatty acids and the lowest WHCs, making it less desirable from a nutritional perspective. As sensory acceptability did not differ between species or cooking methods, consumers may freely choose between catfish and tilapia. Nonetheless, in terms of maximizing the health benefits, boiling and smoking appear to retain more beneficial fatty acids and better WHCs compared to frying.
Cooking methods, such as frying, can degrade beneficial omega-3 fatty acids at high temperatures. Polycyclic aromatic hydrocarbons could be introduced through smoking and are potentially harmful. Essentially, the chosen cooking method significantly impacts the nutritional value of the fish species.
Further studies should be conducted on the cholesterol profile to establish the nature of cholesterol, whether the amount of low- or high-density lipoprotein is affected by the cooking methods.


