
1. Introduction
Ginseng (Panax ginseng) is a medicinal plant widely used in Asian countries. Recently, the demand for fresh ginseng has increased, particularly in Southeast Asia and the Middle East. Fresh ginseng has a higher market value than dried ginseng roots. Nevertheless, the market for fresh ginseng is limited, as it decays easily due to softening, discoloration, off-flavoring, and the growth of microorganisms (Jin et al., 2016). Spoilage of fresh ginseng during storage or export has become a major concern (Chang et al., 2018). Consequently, an accurate prediction of the shelf-life of ginseng is essential for ensuring food safety and minimizing economic losses.
Accelerated shelf-life testing (ASLT) has been widely used to estimate the shelf-life of food. ASLT is usually performed using the Arrhenius equation, which describes the relationship between temperature and reaction rate during storage (Li et al., 2022a; Zhao et al., 2022). However, the results of ASLT may differ based on the quality attributes selected, since it involves only one quality attribute. Nevertheless, there are several quality attributes that contribute to food quality; therefore, multivariate accelerated shelf-life testing (MASLT) can be applied instead to predict shelf-life. For MASLT, the data is compressed using principal component analysis (PCA) to obtain a principal component (PC) score, and the PC score is applied to prediction models (Zang et al., 2023). The MASLT approach can provide a realistic estimation of shelf-life because it considers various quality parameters simultaneously (Hasbullah and Ismail, 2022). According to our knowledge, there are insufficient studies that have conducted ginseng shelf-life prediction, particularly employing the MASLT method. Therefore, the purpose of this study was to investigate changes in ginseng quality during storage and establish a shelf-life prediction model for ginseng based on MASLT.
2. Materials and methods
Ethanol, acetone, sulfuric acid, sodium tetraborate, galacturonic acid, phenol, sulfuric acid, dimethyl sulfoxide, glucose, trans-1,2-diaminocyclohexane-N,N,N′,N′-tetraacetic acid monohydrate (CDTA), sodium borohydride, and sodium carbonate were purchased from Sigma-Aldrich (St. Louis, MO, USA).
Ginseng was purchased from the Jeonbuk Ginseng National Agricultural Cooperative Federation (Jinan County, Korea). The ginseng was grown in Jinan for five years and harvested in June 2022 (cultivation area=8,030 m2). The washed ginseng (100 g) was packed in an LDPE package (Ziploc bag, Thai Griptech Co., Ltd., Bangkok, Thailand). The thickness and size of the package were 0.035 mm and 26.8× 27.3 cm, respectively. The packed sample was stored at 5, 20, and 35°C in an incubator (BF-150LTI, Biofree, Bucheon, Korea). Quality parameters were measured at intervals for 35 days. All experiments were repeated five times.
Each sample (100 g) was blended with 200 mL of 0.85% sterile saline solution in a sterile sample bag (1930F, 190×300 mm, 3M, Yeoju, Korea) using a stomacher (Stomacher 400 Circulator, Seward Ltd., Norfolk, UK) for 3 min. The population of aerobic bacteria was counted on Petri film aerobic count plates (3M Microbiology, St. Paul, MN), and the film was incubated at 35°C for 24 h. The number of fungi was determined on Petri film yeast and mold count plates (3M Microbiology) after incubation at 25°C for 72 h. The results are expressed as log CFU/g. The modified Gompertz model (Zwietering et al., 1990) and Huang equations (Huang, 2008) were used to describe microbial growth.
The original Gompertz model lacks any direct information about the unique curve features except for a parameter that represents the upper limit of the function. Conversely, the Gompertz model modified by Zwietering et al. (1990) is a re-parameterization of the original Gompertz equation to describe isothermal microbial growth, which additionally considers the maximum specific growth rate, delay time for microbial growth, and maximum reached value as model kinetic parameters (Gil et al., 2011).
Similarly, the Huang model provides information about the adaptation of the bacteria after exposure to a new environment; thus, it is also widely applied to microbial growth analysis in food (Huang, 2013).
The equations were as follows:
Modified Gompertz equation:
and
Huang equation:
where Nt is the microbial count at storage time t, and N0 and Nmax represent the initial and maximum numbers of microbial colonies (log CFU/g), respectively. e, µmax, and λ are the Euler’s number (2.718), maximum specific growth rate (d−1), and delay time for microbial growth (d), respectively.
The firmness of the ginseng was measured using a texture analyzer (TA.XT Plus, Stable Micro Systems, Surrey, UK). A round probe (2 mm) penetrated the ginseng body at a speed of 2 mm/s. The penetration depth was 20 mm, and the results are expressed in grams.
The cell wall material was extracted as described previously (Li et al., 2022b), with slight modifications. Briefly, each sample (50 g) was dissolved in 95% ethanol (250 mL) and boiled at 95°C for 20 min. After filtration, the residue was sequentially washed with 70% ethanol and acetone and dried at 35°C for 16 h to obtain alcohol-insoluble solids (AIS). AIS (0.3 g) was mixed with 30 mL of distilled water at 25°C for 10 h. After filtration, the supernatant was collected as water-soluble pectin (WSP). The residue was sequentially extracted with 0.05 M CDTA containing 0.1 M sodium acetate (pH 6.5), 0.05 M Na2CO3 in 0.02 M sodium borohydride, and 4 mM NaOH in 0.1 M sodium borohydride at 25°C for 12 h. The supernatants were collected as CDTA-soluble pectin (CSP), Na2CO3-soluble pectin (NSP), and hemicellulose, respectively. After extraction with 4 mM NaOH in 0.1 M sodium borohydride, the residue was hydrolyzed with 10 mL of 72% sulfuric acid at 35°C for 4 h. The mixture was added to 20 mL of distilled water and boiled at 90°C for 1 h. The supernatant was used as the cellulose fraction.
The uronic acid content of WSP, CSP, and NSP was measured according to the method described by Blumenkrantz and Asboe-Hansen (Blumenkrantz and Asboe-Hansen, 1973), with some modifications. Briefly, 200 μL of the sample was mixed with 1.2 mL of 0.0125 M sodium tetraborate in sulfuric acid and then boiled at 100°C for 5 min. The mixture was cooled with ice, and 20 μL of 0.15% 3-phenylphenol in 0.5% NaOH was added. After reacting for 3 min, the absorbance was measured using a microplate reader (Infinite M200 PRO, Tecan, Mannedorf, Switzerland). Galacturonic acid was used as the standard, and the results were expressed as mg/g AIS. The hemicellulose and cellulose contents of each fraction were determined using the phenol-sulfuric acid method (Dubois et al., 1956) with glucose as the standard. The sample (200 μL) was mixed with 5% phenol (200 μL) and sulfuric acid (1 mL). The mixture was then incubated at 25°C for 15 min. The absorbance was measured at 490 nm using a microplate reader. The results are expressed in mg/g AIS.
The lyophilized sample (0.1 g) was mixed with 10 mL of 90% dimethyl sulfoxide for 24 h at 25°C according to the starch extraction method described in previous studies (Wang et al., 2021), with some modifications. The supernatant (5 mL) was added to 15 mL of ethanol to precipitate starch. After centrifugation at 3,000 rpm for 10 min at 5°C, the precipitate was dispersed in 10 mL of 90% dimethyl sulfoxide. The total starch content was measured using the phenol-sulfuric acid method, as previously described. Starch was used as a standard, and the results are expressed in mg/g dry matter (DM).
The ASLT process comprises three main steps. In the first step, the reaction rates at different storage temperatures were calculated using zeroth-, first-, and second-order kinetic models (Corradini and Peleg, 2006). The kinetic equations are as follows:
and
where A is the measured value, A0 is the initial value, k is the reaction rate constant, and t is the storage time (d).
Second, the reaction rate obtained from the kinetic model was applied to the Arrhenius model to determine the temperature dependence of the reaction rate.
The equation of the Arrhenius model (Zhang et al., 2021) is as follows:
where Ea = activation energy (kJ/mol), kref = reaction rate at the reference temperature (K), R = the ideal gas constant (8.314 J/molK), and T = absolute temperature (K).
The acceleration factor (αT), which is analogous to Q10 coefficients, was determined by plotting the PC score against storage time (Pedro and Ferreira, 2006). The acceleration factor can be calculated as follows:
where αT,ref is the acceleration factor at storage temperature T based on the reference temperature, kT is the reaction rate at temperature T, and kref is the reaction rate at the reference temperature.
Finally, the reaction rate estimated from the Arrhenius model was adopted as a kinetic model to predict quality attribute values at different temperatures. The shelf-life of ginseng was determined based on the prediction model values and cut-off points. The experimental data were fitted to the kinetic and Arrhenius models using Microsoft Excel 2013 (Microsoft Co., Santa Rosa, CA, USA).
We applied PC scores and quality attributes to the kinetic models in multivariate and univariate analyses. For multivariate analysis, the data on quality attributes under different storage conditions were arranged in a matrix (95 data points during storage × 10 variables), and the PC score was extracted using PCA. PCA was performed using R Studio (version 4.2.2, RStudio Inc., Boston, MA, USA).
3. Results and discussion
The cell wall is a complex, dynamic polysaccharide matrix. Cell wall polysaccharides have an influential role in cell walls, as the loosening and modification of these polysaccharides contribute to the softening of the cell wall (Fan et al., 2019). Fig. 1 shows the variation in polysaccharide content, including pectin, hemicellulose, cellulose, and starch, during storage.
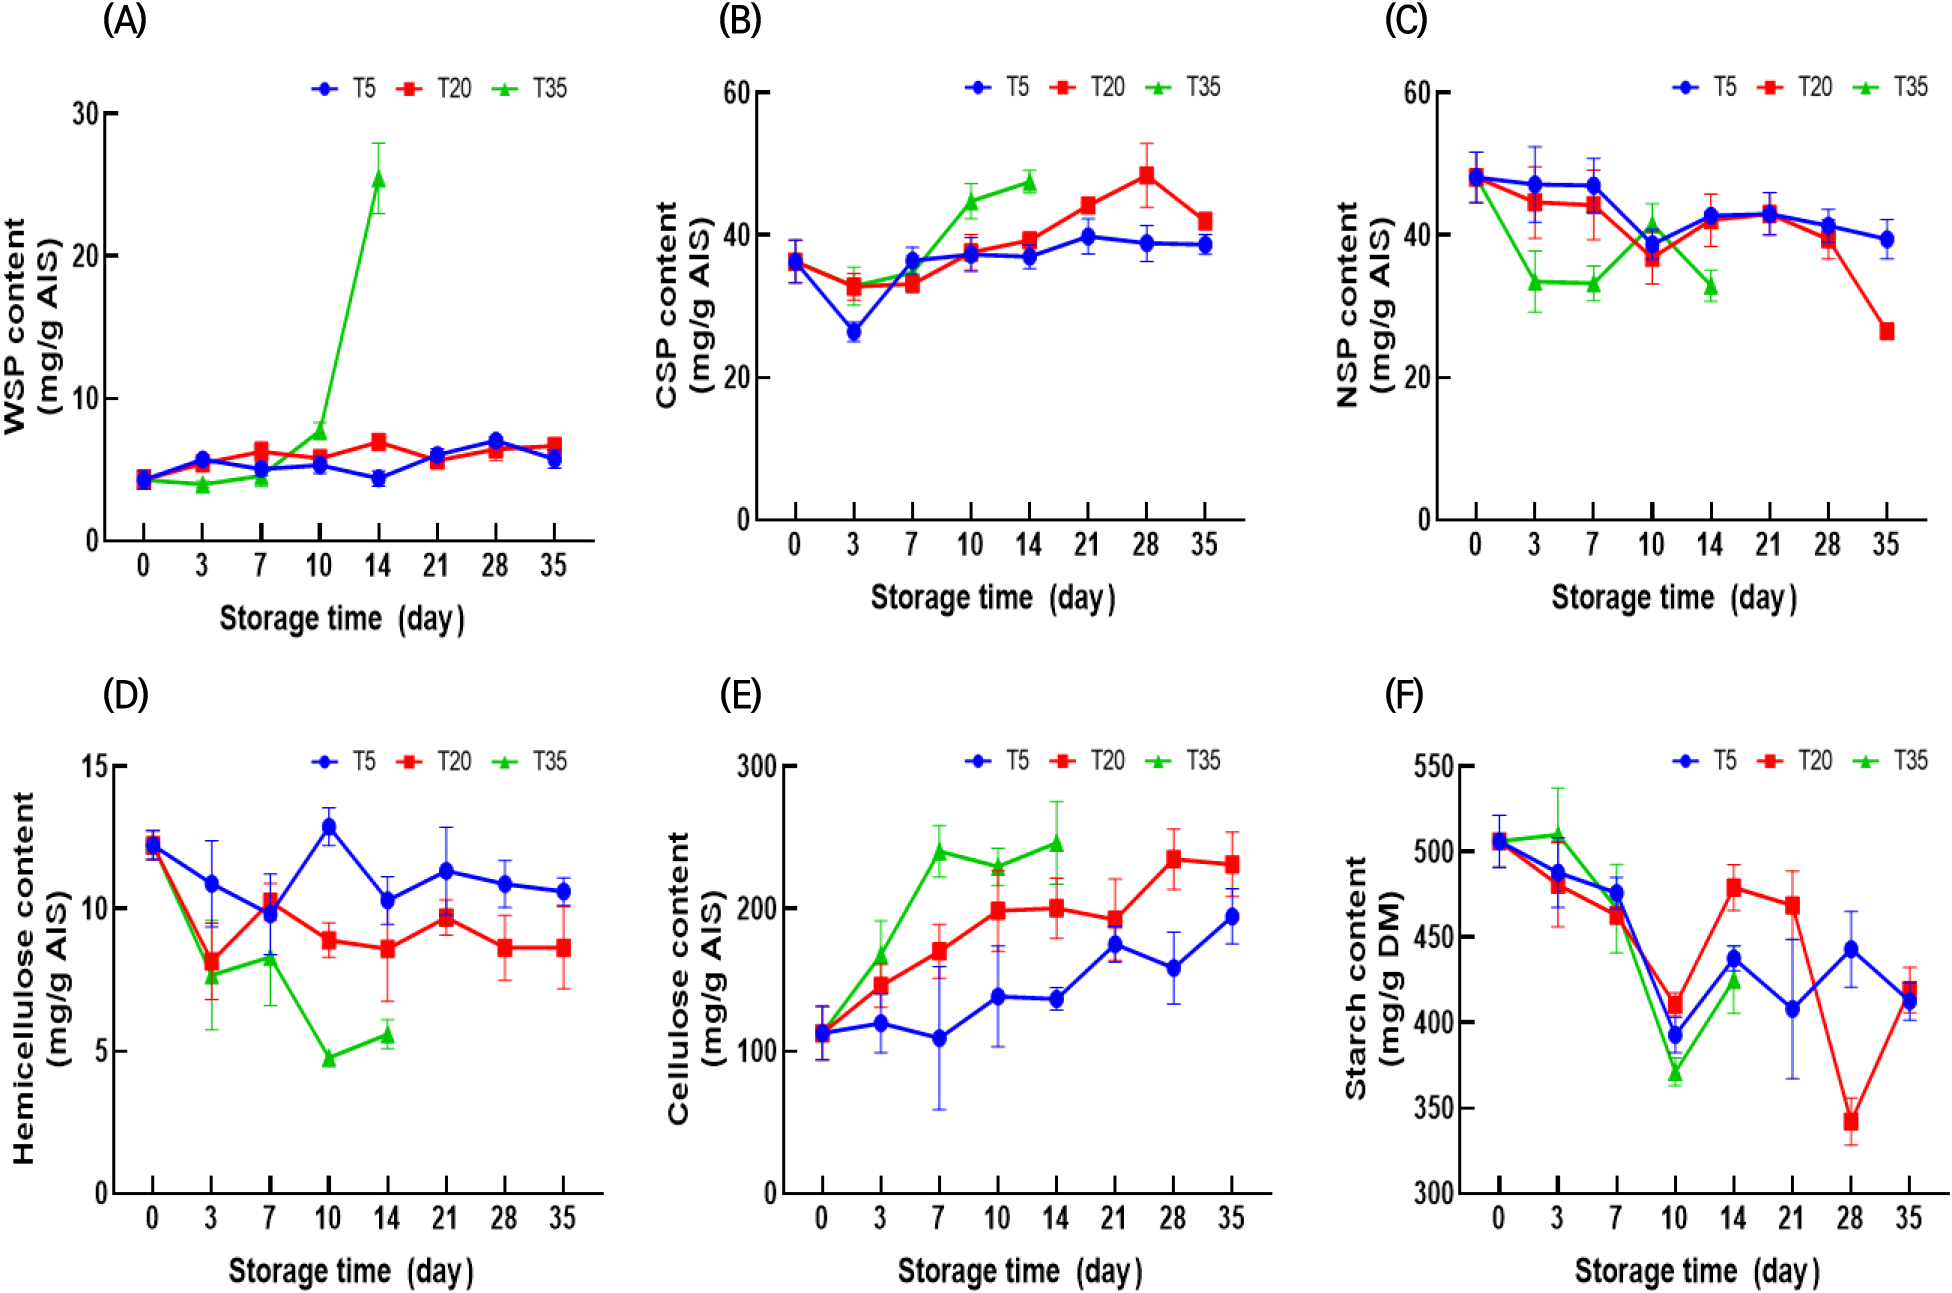
Pectin is a complex structural biopolymer present in the primary cell wall and middle lamella. The cell wall pectin from ginseng was fractionated into WSP, CSP, and NSP. WSP is a solubilized pectin loosely bound in the middle lamella, while CSP binds ionically to calcium and maintains cell wall integrity (Holland et al., 2012). The WSP of ginseng stored at 5°C and 20°C increased gradually over 35 days, whereas that of ginseng stored at 35°C increased rapidly after 10 days (Fig. 1(A)). Similarly, a previous study reported that stored ginseng exhibited a higher WSP content than fresh ginseng (Kim et al., 2002). However, to the best of our knowledge, information on each water-insoluble pectin, including NSP and CSP, in stored ginseng has not been reported. NSPs interact with primary cells via covalent bonds and are considered the last barrier to cell separation (Yu et al., 2023). In previous studies, changes in water-insoluble pectin during storage differed for different products. In some studies, both CSP and NSP decreased (Wang et al., 2021; Win et al., 2021), whereas in other studies, NSP decreased while CSP increased (Fan et al., 2019; Li et al., 2022b). In this study, a similar trend was observed with decreased NSP along with elevated CSP. The CSP content tended to increase, and this increase was promoted by increasing storage temperature (Fig. 1(B)). After 28 days at 5°C and 20°C, the NSP content remained unchanged; however, after 35 days at 20°C, the NSP content (26.54 mg/g) decreased rapidly (Fig. 1(C)). The NSP content at 35°C decreased to 32.95 mg/g after 14 days. The above results indicated the solubilization of NSP into CSP and WSP (Fan et al., 2019) and that a higher storage temperature could accelerate solubilization (Li et al., 2022b).
Starch is the main carbohydrate in ginseng. Here, the starch content decreased gradually during storage at all temperatures. Hu et al. (2005) reported that starch was converted into sugar via respiration. There is prior evidence that ginseng starch degrades during low-temperature storage (Yun and Lee, 2005), which closely aligns with our results.
Cellulose and hemicellulose are major components of ginseng cell walls. Here, the hemicellulose content decreased throughout the storage period. Moreover, higher storage temperatures accelerated the reduction in hemicellulose content. Recently, the importance of pectin metabolism in maintaining cell wall integrity has gained attention. Chea et al. (2019) reported that the content of cellulose and hemicellulose decreased during storage as a result of the degradation of bound pectin, thereby causing the cellulose and hemicellulose to depolymerize. The cellulose content of ginseng tends to increase during storage, and this increase is markedly accelerated at high temperatures. A similar increase in cellulose during storage was observed in previous studies (Cao et al., 2009; Szymanska-Chargot et al., 2016). Zykwinska et al. (2005) observed that pectin could tightly integrate with cellulose microfibrils in the cell wall via specific pectin side chains. Furthermore, pectin-cellulose microfibril interactions are more prevalent than those of hemicellulose xyloglucan-cellulose (Wang et al., 2018). Therefore, it is assumed that the prevalence of pectin, which selectively interacts with cellulose microfibrils, contributes to the variation in cellulose/hemicellulose content during storage.
Ginseng contains cell wall-degrading enzymes from various microorganisms (Cho et al., 2007). A previous study reported that the major microbial strains affecting ginseng decay differed depending on the storage temperature (Chang et al., 2018). Therefore, the variation in cell wall-degrading enzymes with storage temperature may also affect the cell wall polysaccharide composition.
Fig. 2(A) shows the changes in weight loss of ginseng during storage. The occurrence of weight loss in fresh ginseng is a limiting factor in long-term storage (Hu et al., 2005). The weight loss of ginseng increased gradually during storage (Fig. 2(A)). The weight loss of ginseng at 5, 20, and 35°C was 0.25-0.37%, 0.38-4.07%, and 1.41-5.58%, respectively. The surface firmness of all samples declined in the first 10 days, but there was a slight difference between storage temperatures (Fig. 2(B)). In contrast, the texture of ginseng stored at 35°C rapidly deteriorated after 14 days. Overall, weight loss and the reduction in firmness decreased with decreasing storage temperatures. Furthermore, Hu et al. (2014) found that lower temperatures inhibited weight loss and ginseng softening during storage.
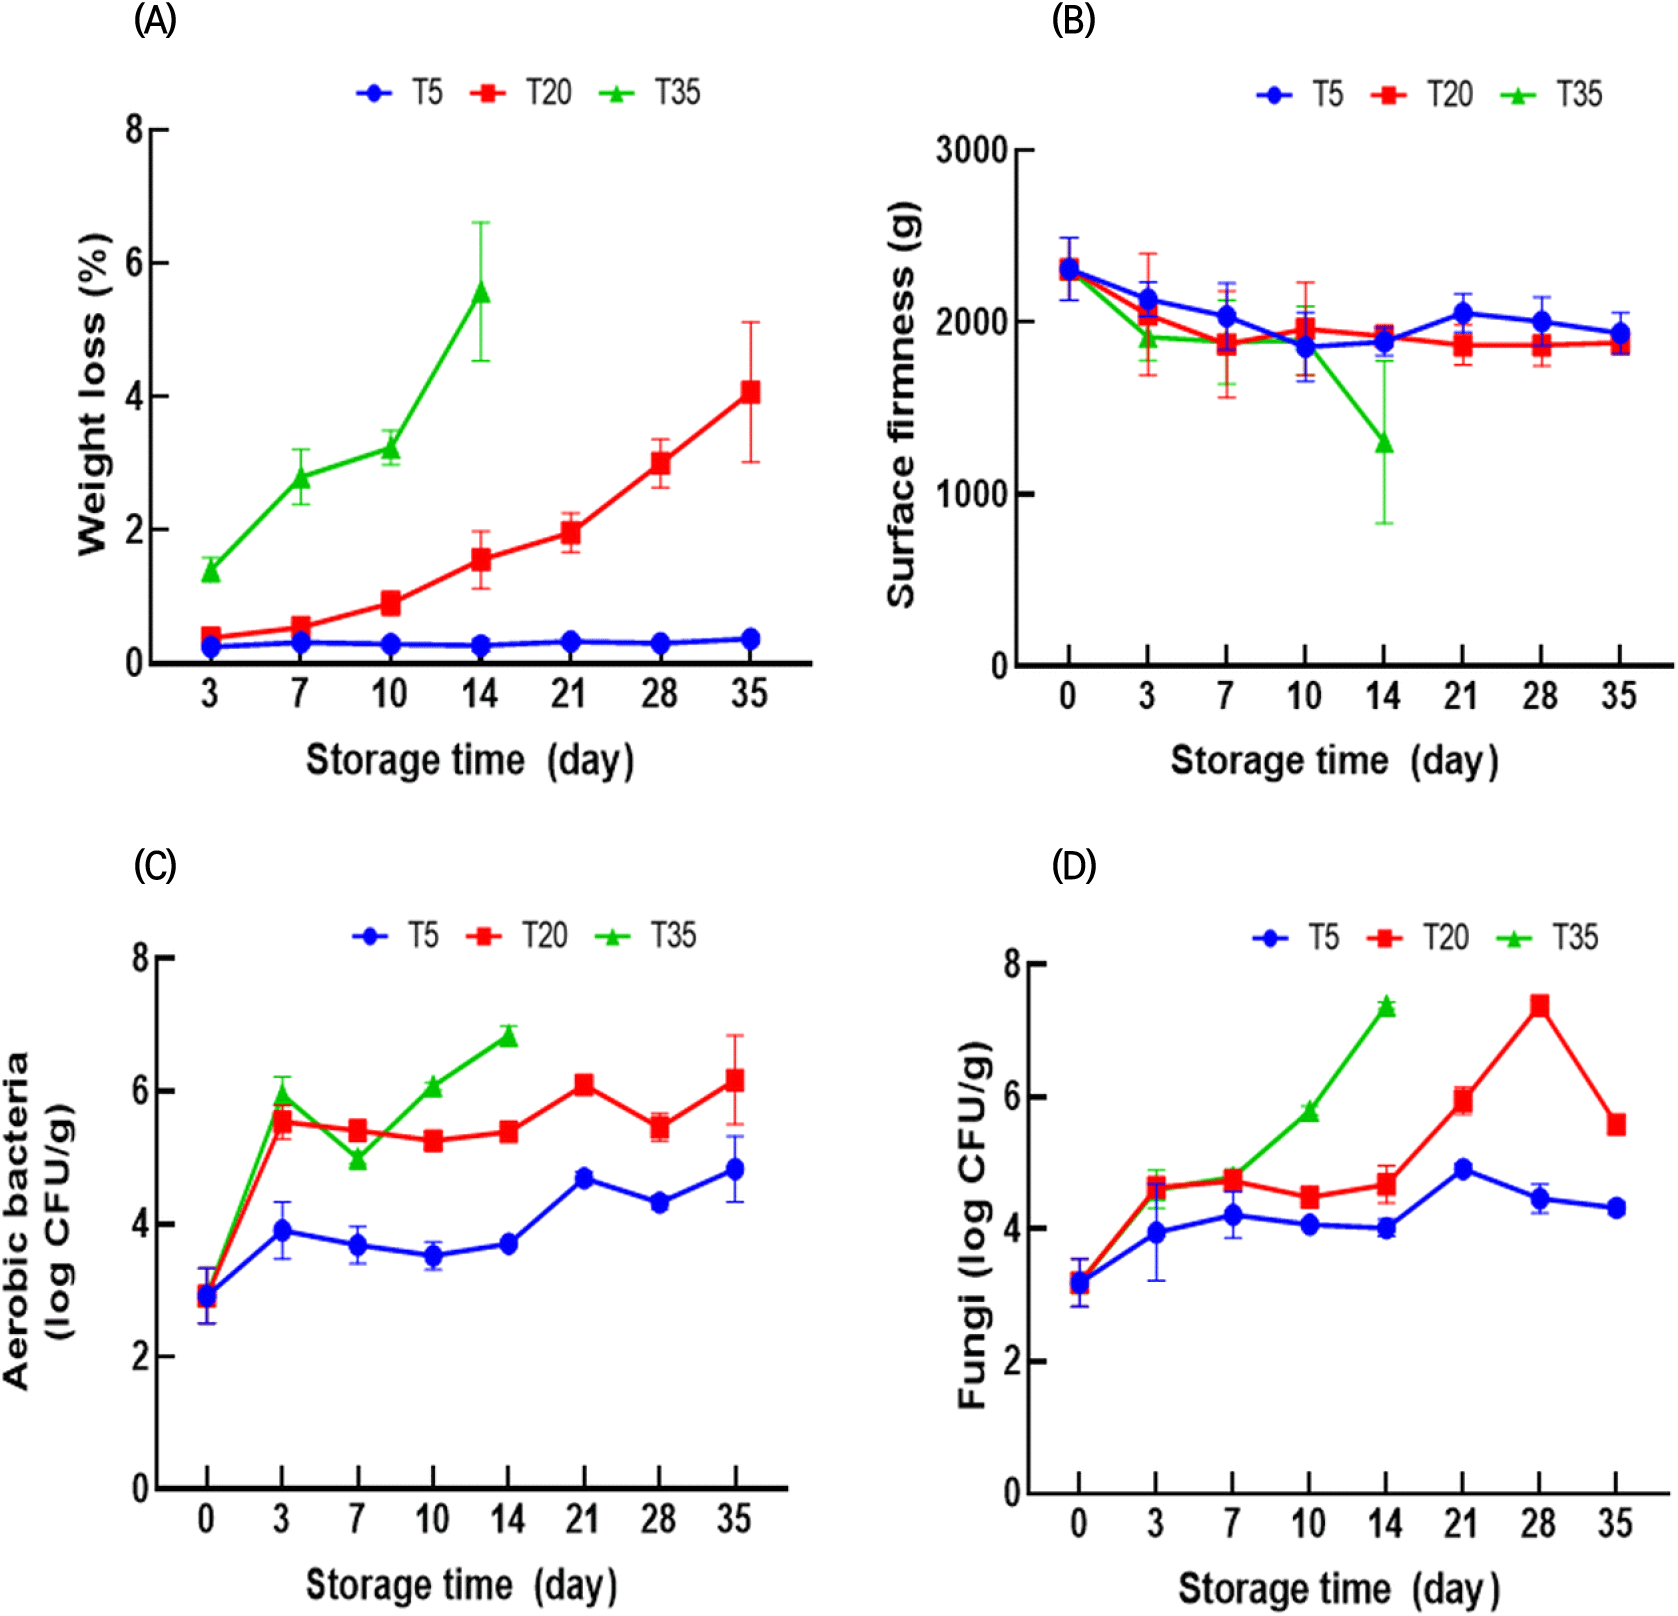
The weight loss and firmness of plants are related to the composition of cell wall materials. Zhang et al. (2018) reported that the degradation of cellular components and internal water transfer can cause moisture loss, resulting in continuous weight loss. Plant tissues contain cell walls composed of pectin, cellulose, and hemicellulose, which contribute to the texture of the tissue (Wang et al., 2021). Therefore, lower temperatures may decrease the rate of cell wall degrading enzyme activity, thereby resulting in a slower decline in softening and weight loss (Zhang et al., 2021).
Microbial growth is a crucial parameter that affects food safety and freshness. Therefore, aerobic bacteria and fungi in ginseng were measured (Fig. 2(C) and (D)). While ginseng microorganism growth may vary according to packaging and washing methods (Jin et al., 2016), it is clear that storage temperature affects microbial growth. After 35 days, the microbial counts at 5°C were below 5 log CFU/g, whereas counts at 20°C were approximately 6 log CFU/g. In contrast, aerobic bacteria and fungi counts in ginseng reached above 6.8 log CFU/g within 14 days at 35°C. As expected, the microbial population of ginseng increased during storage, and microbial growth increased with increasing storage temperatures. Higher temperatures within a suitable temperature range may provide more favorable conditions for microbial growth, such as increased metabolic activity (Nedwell, 1999; Peleg, 2022). Therefore, storage at higher temperatures can lead to a rapid increase in the population of aerobic bacteria and fungi, which can cause spoilage of ginseng and reduce its shelf-life.
The PCA results are shown in Fig. 3. PCA is an effective technique to improve the interpretability of data by reducing its dimensionality; hence, PCA, especially the MASLT approach (Zang et al., 2023), is commonly used to predict shelf-life. The models PC1 (55.0%) and PC2 (11.4%) accounted for 66.4% of the total variability. Overall, the longer the storage time, the higher the positive score in PC1. The clusters of ginseng stored at 35°C for 14 days (T35D14) had a PC1 score above 5.0, whereas those stored at 5°C and 20°C for 35 days (T5D35 and T20D35) had PC1 scores of −1 and 2.5, respectively. This indicated that the clusters rapidly shifted to the right-hand axis of PC1 at higher storage temperatures.
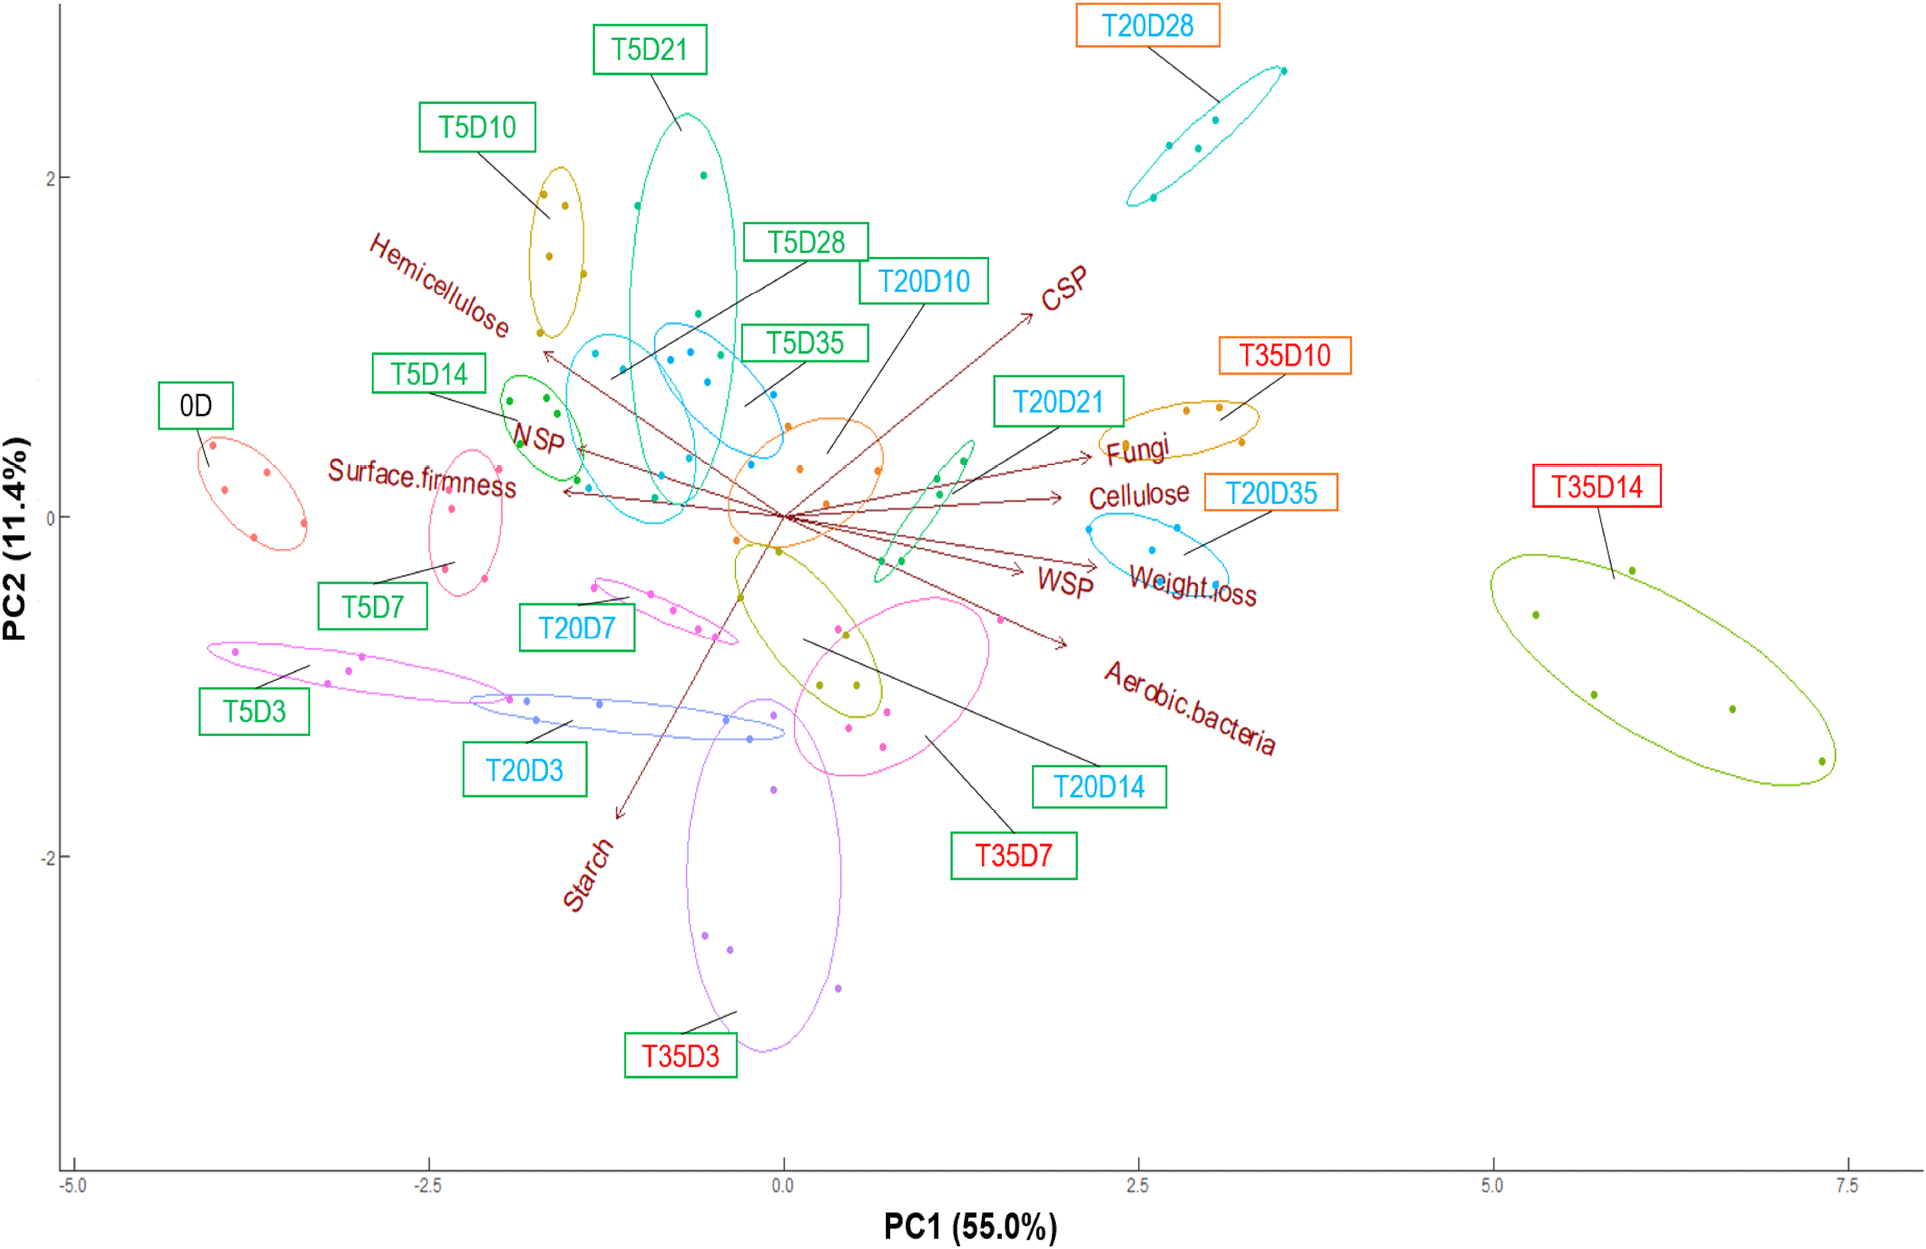
The PCA loading plot shows the degree to which quality attributes contribute to the analysis. Microbial growth (aerobic bacteria and fungi), weight loss, CSP, WSP, and cellulose were positively correlated with PC1, indicating that they increased during ginseng storage. Surface firmness, starch, NSP, and hemicellulose were negatively correlated with PC1, indicating that they decreased with prolonged storage. The relationships between the quality parameters were estimated from the PCA loading plot. Previous studies have found that the composition of cell wall materials is related to texture, but their correlation varies according to the type of agricultural product (Huang et al., 2022; Ren et al., 2020). In this study, the surface firmness of ginseng was positively correlated with NSP and hemicellulose content. This indicates that the deposition of these cell wall polysaccharides affects ginseng softening.
Quantitative microbiological models have been widely applied to predict trends in microbial growth (Liu et al., 2023). The results of the microbial population analysis during ginseng storage were fitted to the Gompertz and Huang models (Table 1). The R2 values of the Gompertz and Huang models were 0.622-0.913 and 0.701-0.910, respectively. The results of the models showed that the maximum specific growth rate (µmax) and maximum microbial colonies (Nmax) increased as the storage temperature increased, whereas the delay time (λ) decreased. These results were consistent with previous studies (Singh et al., 2022).
The results of the quality attributes were fitted to kinetic models (zeroth-, first-, and second-order equations), and the kinetic parameters are listed in Table 2. The absolute value of the reaction rate (k) increased with storage temperature, in accordance with previous studies (Zhang et al., 2021). However, the R2 values varied depending on the storage temperature and quality characteristics. The R2 of weight loss was 0.772-0.983 in the kinetic model at storage temperatures of 20°C and 35°C, whereas it was 0.582-0.594 at 5°C. The kinetic models for hemicellulose, CSP, WSP, and surface firmness also exhibited higher R2 values of 0.651-0.978 at 35°C. Overall, as the storage temperature decreased, the zeroth-, first-, and second-order models exhibited relatively poor performance. This may be due to the suppression of the reaction velocity at low temperatures, which makes it difficult for these models to predict changes in the quality of ginseng over time.
The Arrhenius model is the most widely used equation for describing the kinetics of quality change with temperature. The combination of a kinetic model based on the reaction order (e.g., zeroth-, first-, and second-order) and the Arrhenius model has previously been applied for shelf-life prediction (Li et al., 2022a). Among the parameters, cellulose and PC1 scores showed an acceptable fit (R2>0.8). In particular, the zeroth-order models for cellulose and PC1 scores had higher R2 values than the corresponding first- and second-order models. Therefore, the zeroth-order kinetic model was combined with the Arrhenius model to predict cellulose and PC1 score changes in ginseng. As shown in Fig. 4(A), the zeroth-order kinetic model combined with the Arrhenius model for these parameters exhibited reasonable fitting performance. The activation energy (Ea) of food-related chemical reactions is typically measured within 30-120 kJ/mol (Taoukis, 2001). The Ea for the cellulose and PC1 scores were 37.75 and 41.4 kJ/mol, respectively. The k and αT values increased with storage temperature, indicating that increasing temperature accelerated quality loss.
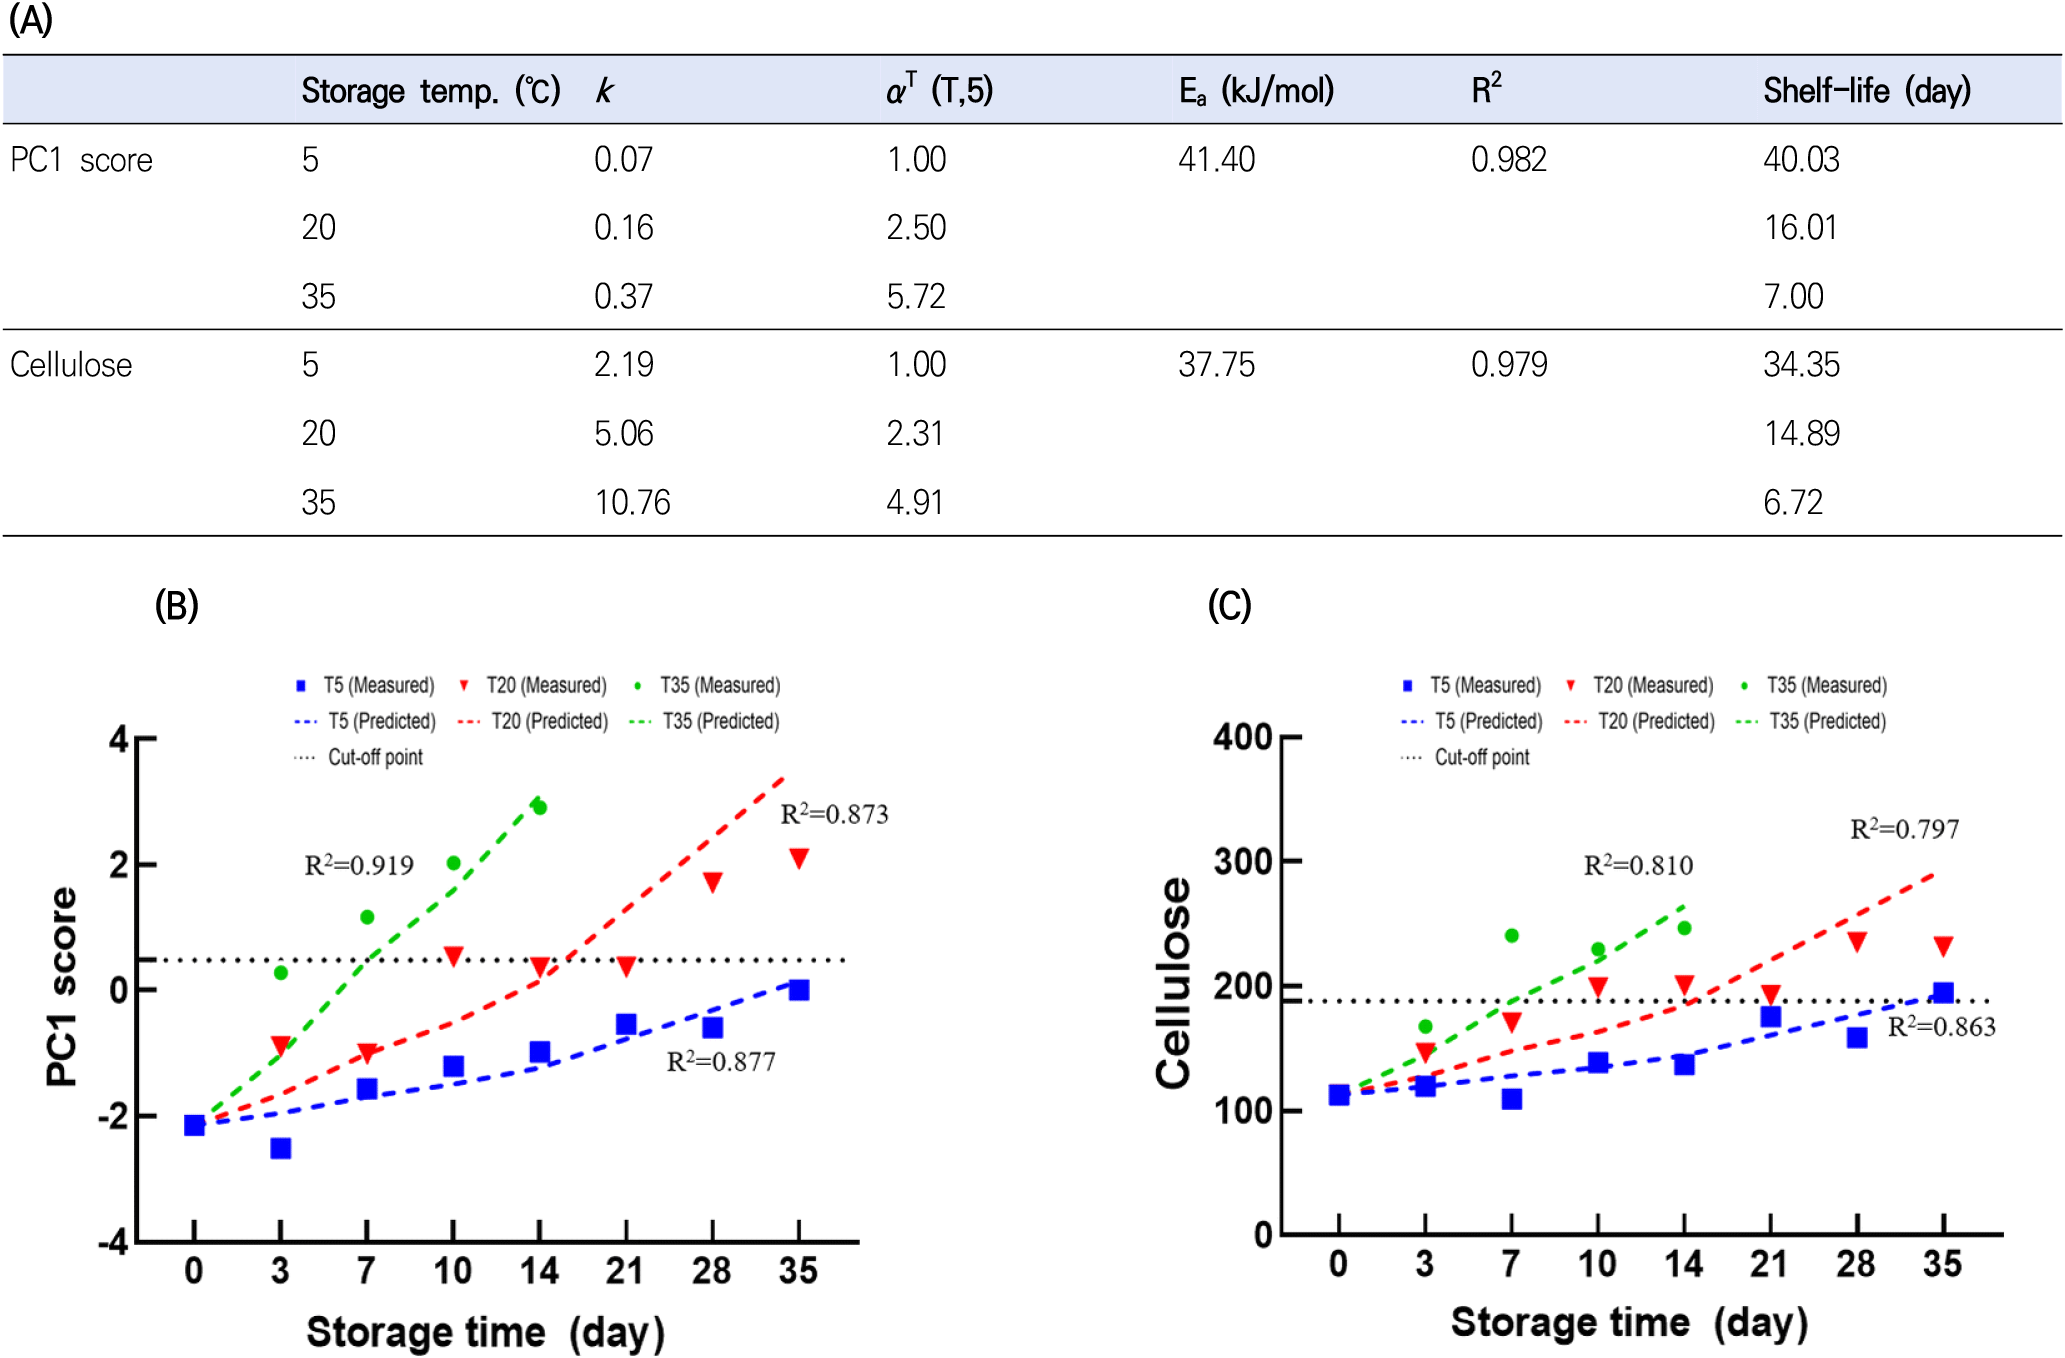
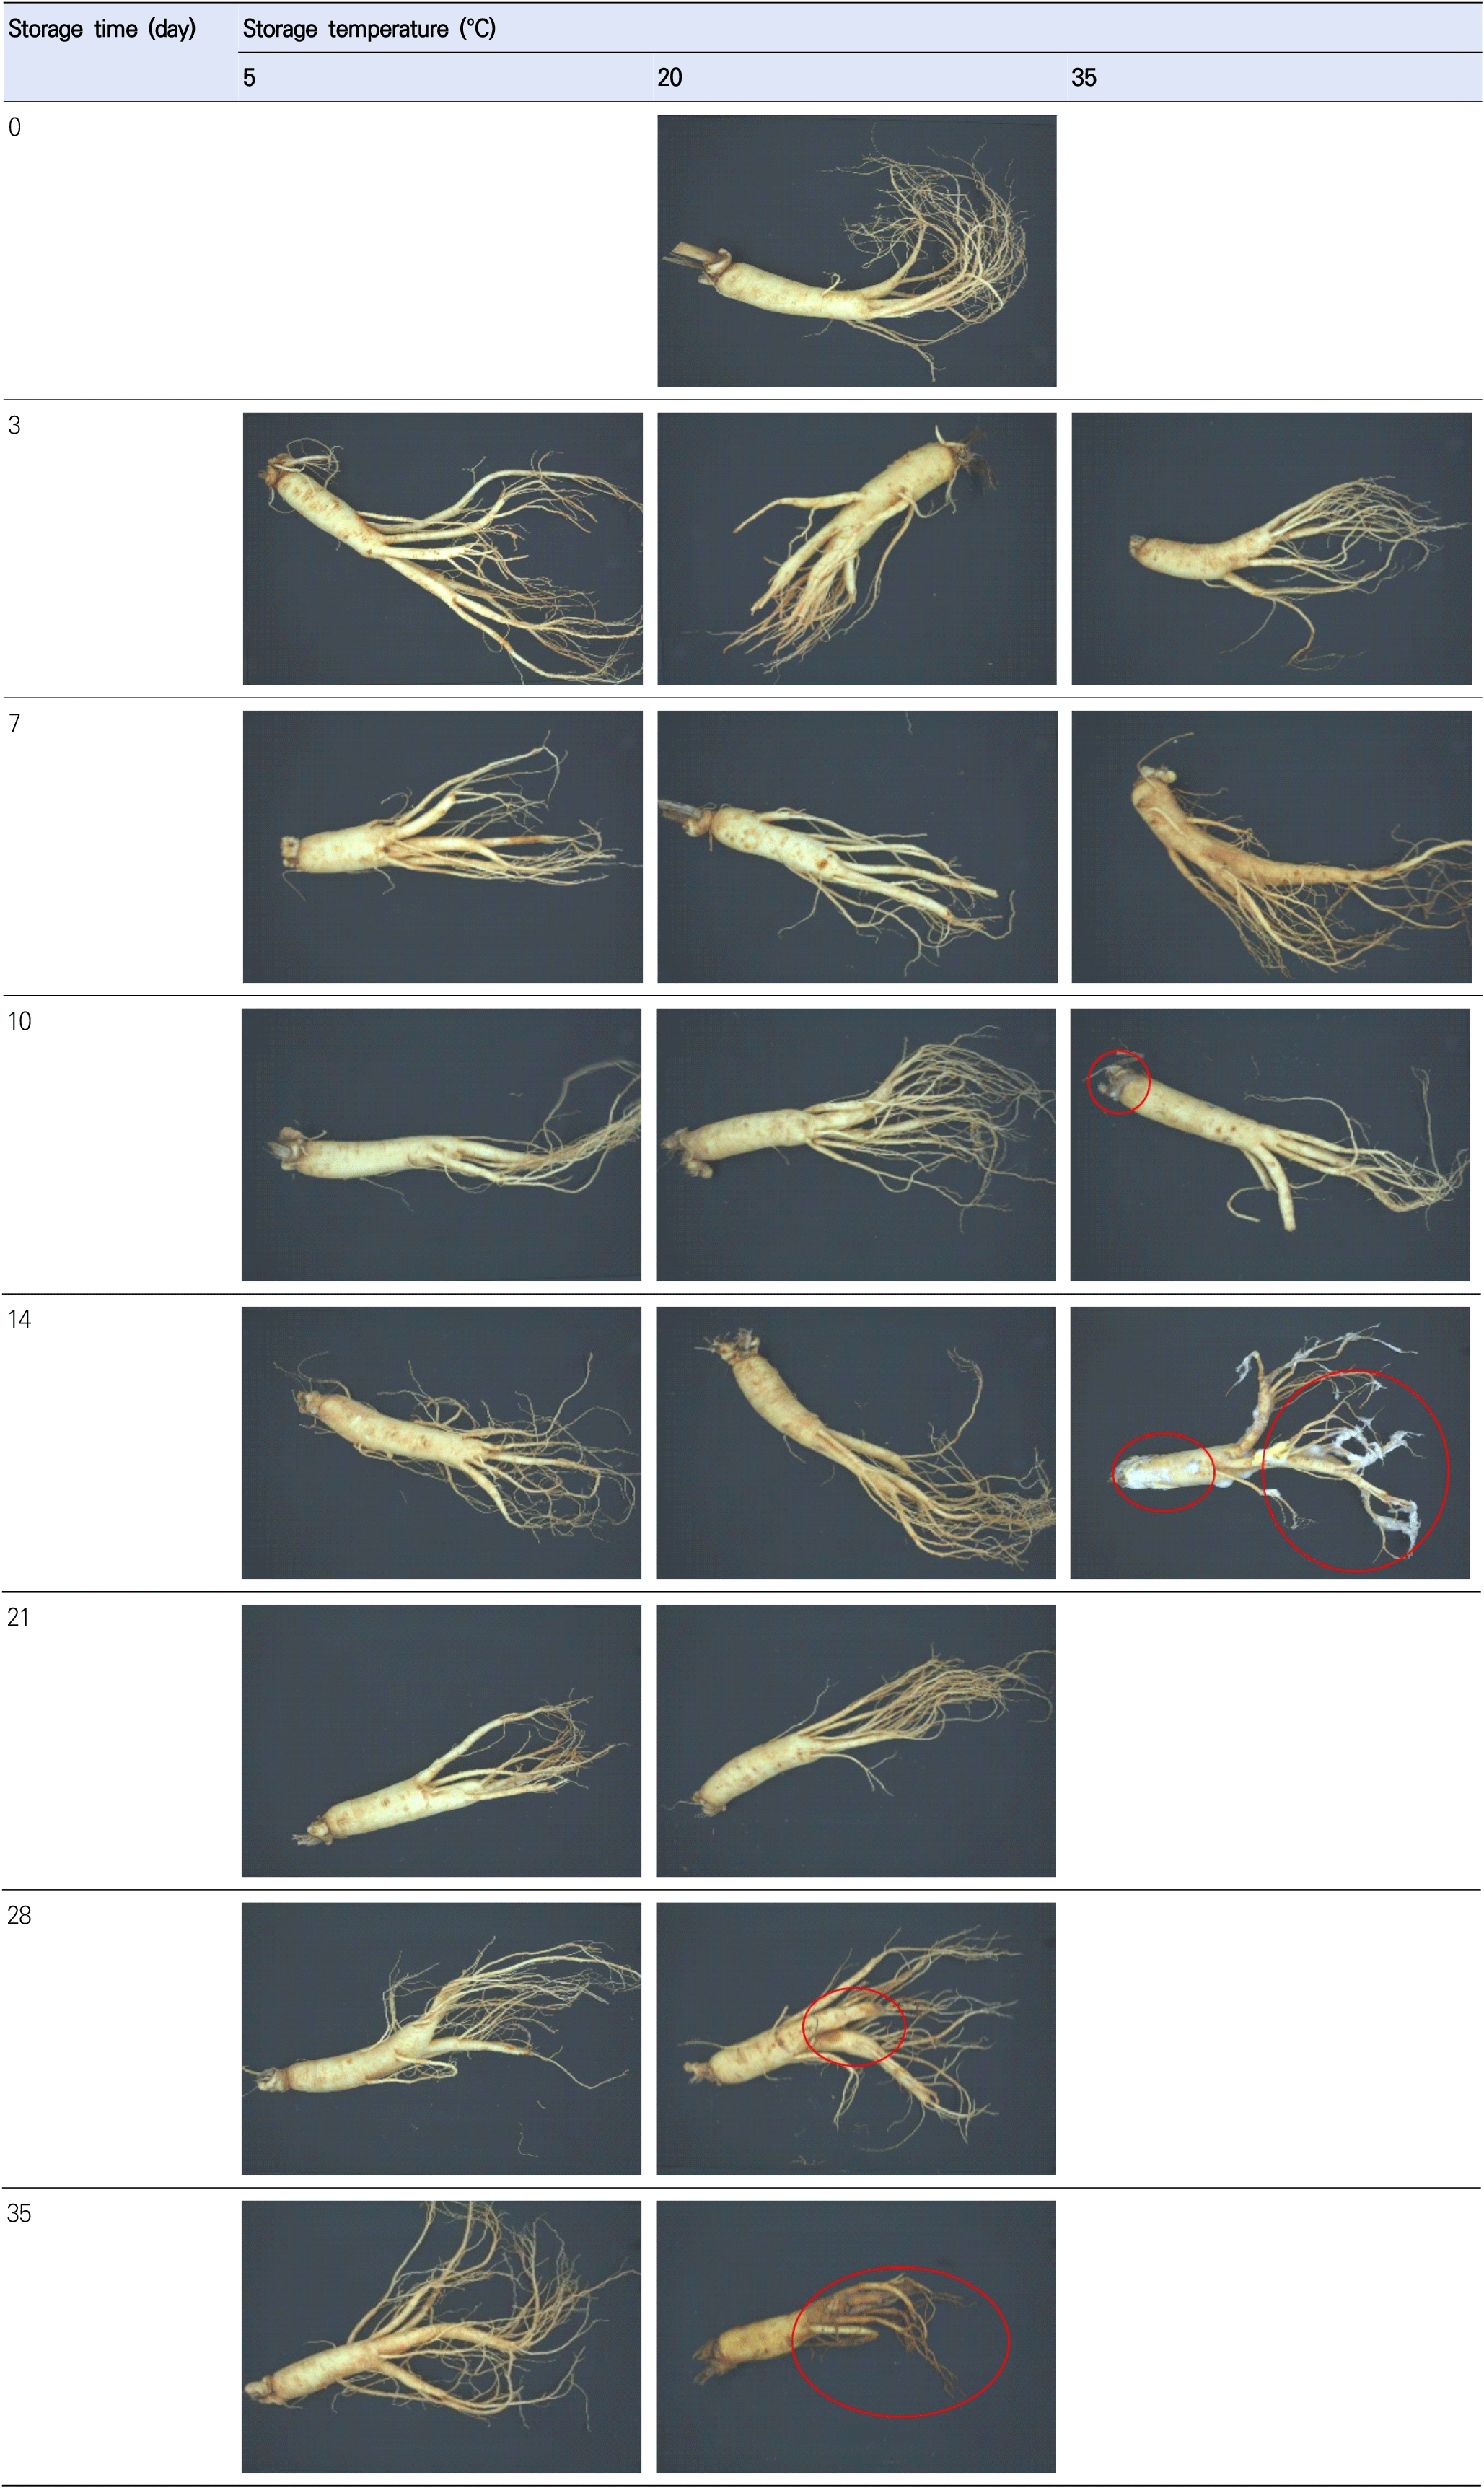
The cut-off point is an important criterion for determining shelf-life. The cut-off point for shelf-life has been determined by various standards, such as legal requirements, developer experience, sensory tests, and the degree to which quality parameters decrease from their initial values (Sehwag et al., 2018). In this study, the cut-off point was determined based on the quality attributes, ginseng features (Fig. 5), and PCA biplot results (Fig. 3). In PCA, the samples could be classified into three groups, namely group A (D14T35; PC1 score>5), group B (D28T20, D10T35, and D35T20; 2.5<PC1 score<5), and group C (samples other than group A and B; PC1 score <2.5). As shown in Fig. 5, ginseng stored at 35°C for 14 days exhibited fungal contamination on the surface and softening. Thus, it can be concluded that group A was decaying. Group B exhibited discoloration and softening of the fine ginseng roots. In addition, the weight loss of ginseng at 20°C after 28 days and 35°C after 10 days revealed high weight loss (>3%), aerobic bacteria counts (>6 log CFU/g), and fungi counts (>5.7 log CFU/g) (Fig. 2). Therefore, each group was labeled as decayed (group A), partially decayed (group B), or acceptable (group C). In this study, the cut-off points for each parameter were defined as the maximum values in the acceptable groups, namely, a PC1 score of 0.48 and cellulose value of 188.11. The shelf-life predictions calculated were 40.03, 16.01, and 7.00 days for PC1 at 5, 20, and 35°C, and 34.35, 14.89, and 6.72 days for cellulose, respectively.
To validate the established model, R2 values between the measured and predicted values were calculated. The combined model incorporating the zeroth-order kinetic and Arrhenius models showed higher R2 values at 5, 20, and 35°C for PC1 score (0.877-0.919) than those of cellulose (0.797-0.863) (Fig. 4(B) and Fig. 4(C)). Similarly, previous studies reported that multivariate kinetic analysis provides more precise shelf-life prediction than univariate kinetic analysis (Li et al., 2022a). This may be because multivariate analysis considers all quality parameters simultaneously, whereas in univariate analysis, the variation of αT and k values by each quality attribute may result in an over-or underestimation of shelf-life (Sehwag et al., 2018).
4. Conclusions
In this study, the cell wall materials (pectin, hemicellulose, cellulose, and starch), firmness, weight loss, and microorganism populations of fresh ginseng varied depending on storage temperature and time. The mathematical model indicated that changes in quality accelerated with increasing temperature. Based on the quality attribute results, the PC1 score was extracted from the PCA and used for multivariate analysis. The mathematical model showed that the prediction model combining the zeroth-order kinetic and Arrhenius models was suitable for describing the change in cellulose and PC1 score during storage. Furthermore, the MASLT model based on the PC1 score exhibited higher performance than the conventional ASLT based on cellulose. In addition to providing shelf-life information, the established MASLT model provides information on kinetic parameters, such as the acceleration factor and kinetic rate constant, at different temperatures. These results can be utilized to predict the shelf-life of ginseng and contribute to quality control during storage.