
1. Introduction
Recently, customer demand for information on the vitamin content and functionality of food has increased due to the high correlation between vitamin intake and health (Awuchi, 2020). In Korea, the nutritional information of specific foods can be found in the food nutrient database developed and maintained by the Rural Development Administration, the Ministry of Food and Drug Safety, and the National Institute of Fisheries Science. Data shown on the website were verified by different government agencies in Korea that prioritized the most highly-consumed and health-related foods in the country. However, most of the information on the nutritional components of food is only focused on the macronutrients, while information on micronutrients such as vitamins is very limited.
Kimchi cabbage (Brassica rapa. L. ssp. pekinensis) is a leafy biennial vegetable belonging to Brassicaceae family. It is among the most widely consumed vegetables in Korea. As of December 2022, the total cultivation area of kimchi cabbage in Korea is 13,953 ha, with a production of approximately 1,352 thousand tons, representing 9,692 kg of production per 10 ha (KOSIS, 2022). Kimchi cabbage can be classified into spring, highland, autumn, and winter kimchi cabbage based on its growing season. It can be further classified according to its shape or form: spherical, semi-spherical and incompletely spherical. One of the optimal conditions for the growth and development of kimchi cabbage is a cool environment, which promotes a spherical shape (Ku et al., 2014; Lee et al., 2013).
Kimchi cabbage contains functional substances, such as flavonoids, carotenoids, phenolic acids, sterols, alkaloids, and glucosinolates (Hounsome et al., 2008). In addition, kimchi cabbage is rich in various minerals and vitamins, including fiber and calcium. Owing to its nutrient content, it is an essential food for Koreans during winter (Gantumar et al., 2013), and is growing in popularity internationally as a dietary component for health-conscious individuals.
Vitamins perform various metabolic functions in the human body and can be ingested in μg or mg levels. However, since our bodies cannot synthesize the required daily intake, vitamins can be supplemented through the diet (Awuchi, 2019). In Korea, kimchi cabbage is mainly used to prepare kimchi, an integral component of the Korean diet. Because of the nature of every meal consumed, the frequency of consumption is very high. The total vitamin level ingested in kimchi cabbage is a very important for evaluating vitamin intake level in Koreans.
Kimchi cabbage shows substantial variability in its genetics and morphological characteristics, which are important for breeding to improve particular characteristic traits (Balkaya et al., 2005; Bhandari et al., 2021; Kibar et al., 2016). Generally, light yellow kimchi cabbages have been widely used for many years. However, genetic variations have recently been introduced to improve the size, nutrient content, and organoleptic characteristics of large varieties. Examples of these improvements includes the development of red and gold kimchi cabbages, which are high in nutrients and currently cultivated in the Haenam region in Korea (Lee et al., 2019; Park et al., 2019; Yang, 2018). But, almost no data available on their nutritional and functional properties. To increase the use of these new varieties in preserved kimchi products, analyzing their nutritional value is an essential step.
In this study, the morphological characteristics, antioxidant capacity, and major water- and fat-soluble vitamin content of gold and red kimchi cabbage produced in Haenam were analyzed. This was done to determine the nutritional content for food processing purposes and to prepare a scientific basis for future research.
2. Materials and methods
Vitamin B6 standard pyridoxine, pyridoxal, and pyridoxamine; vitamin B9 standard folic acid; vitamin E standard α-, β-, γ-, δ-tocopherol; and vitamin K standard phylloquinone were all purchased from Sigma-Aldrich Co. (St. Louis, MO, USA). Standard β-carotene for vitamin A analysis was purchased from FUJIFILM Wako Pure Chemical Co. (Osaka, Japan). The strain used for B9 analysis was Lactobacillus casei subsp. rhamnosus (ATCC 7469) was purchased from the American Type Culture Collection (ATCC; Manassas, VA, USA). All other reagents used were of high grade and HPLC grade or higher.
The red kimchi cabbage (RKC) used in this experiment consisted of a variety of cabbages derived from red lettuce and common cabbage. On the other hand, gold kimchi cabbage (GKC) is a variety derived from common kimchi cabbage (CKC) and tomato. RKC and GKC harvested during the fall season were obtained from Haenam-SungJin kimchi (Haenam, Korea). CKC was purchased from a local market (Suncheon, Korea).
Kimchi cabbages (n=5) were prepared by removing all the inedible parts of the cabbage and cutting them into eight equal parts before washing them with clean water. After draining the water, the kimchi cabbage was sliced and then lyophilized at as −70°C using a freeze dryer (Il-Shin Freeze Dryer Series, Il-Shinbiobase Co. Ltd., Yangju, Korea). It was then pulverized using a food processor (HMF-3250S; Hanil Science Industrial Co., Gwangju, Korea) and mixed homogeneously. The powdered samples were vacuum-packed and stored at room temperature until further analysis. The moisture content of all kimchi cabbages was approximately 92%, and there was no significant difference between the varieties.
To measure the size of kimchi cabbages, five medium-sized kimchi cabbages were randomly selected per variety. For size measurements, two to three layers of outer leaves were removed, as they are part of the inedible portion. The thickness and length of the kimchi cabbage heads were measured (n=5 per variety). The width of the removed outer leaves was also measured (n=5 per variety). The length and thickness of each cabbage head, and the width of the outer leaves, were measured using the International System of Units (SI), and these are expressed as average values.
The lyophilized samples were powdered and mixed homogeneously. A powder sample was used for chromaticity measurement, which were taken using a colorimeter (CR-200; Minolta Co., Osaka, Japan). Before measurement, the meter was calibrated using a standard white plate (L=97.06, a=−0.15, and b=+1.94). All powder samples were measured five times, and the average values were obtained and expressed as L* (lightness), a* (redness), and b* (yellowness).
For the extraction and analysis of vitamin B6, the method of Islam et al. (2022) was used. The powder sample (2.0 g) was weighed into a round-bottom flask, and 20 mL of 10 mM ammonium formate (0.1% formic acid) solution was added and mixed. Extraction was performed at 40°C for 30 min using an ultrasonic extractor (Cole-Parmer 8893; Chicago, IL, USA). The extract was cooled to room temperature (20°C). Centrifugation (MF-550; Hanil Science Industrial Co., Gwangju, Korea) was performed at 0°C for 15 min at 252 ×g (gravity). The supernatant was transferred to a 50 mL volumetric flask. This process was repeated twice in total. Then, A 10 mM ammonium formate (0.1% formic acid) solution was used to be filled of the flask. The gastric extract (1.6 mL) was transferred to a microtube. After centrifugation (SUPR30K, Hanil Science Industrial Co.), the supernatant was filtered using a 0.45 μm membrane filter (cellulose acetate, Advantec®, DISMIC®-13CP, Osaka, Japan). The filtrate was analyzed using an HPLC system equipped with a fluorescence detector (FLD, Agilent, Santa Clara, CA, USA). The mobile phase conditions are listed in Table 1. The column used was Imtakt Scherzo SW-C18 (150×4.6 mm, 3 μm; Shiseido, Kyoto, Japan). The detection wavelength was at Exλ=290 nm and Emλ=396 nm. The injection volume was 20 μL, the flow rate was 0.7 mL/min, and the column oven temperature was set at 35°C.
| Time (min) | Mobil phase A (10 mM ammonium formate, 0.1% formic acid) (%) | Mobil phase B (methanol) (%) |
|---|---|---|
| 0 | 100 | 0 |
| 14 | 90 | 10 |
| 20 | 90 | 10 |
| 21 | 100 | 0 |
| 30 | 100 | 0 |
Vitamin B9 extraction and analysis were conducted using the method described by Chun et al. (2006). A 1.0 g powder sample was weighed into a 250 mL wide-neck Erlenmeyer flask. 20 mL of sodium phosphate buffer (pH 7.8) and 30 mL of distilled water were sequentially added. After a hot water treatment at 100°C for 15 min in a constant temperature water bath (WB-20M, Jeio Tech, Daejeon, Korea), it was cooled to room temperature. 1 mL of protease (2 mg/mL) and 10 mL of sodium phosphate buffer (pH 7.8) were added. Reacted for 3 h in a 37°C shaking incubator. To deactivate the protease, it was placed first in a water bath at 100°C for 10 min and cooled to room temperature. 1 mL of α-amylase (20 mg/mL) and 0.5 mL of toluene were added to the culture medium and allowed to react for 2 h in a 37°C shaking incubator. Then, 4 mL of folate conjugate solution (5 mg/mL in sodium phosphate buffer, pH 7.8) was added to the culture medium and incubated for up to 16 h in a 37°C shaking incubator. To deactivate the enzyme, the sample was treated in a hot water bath for 10 min. The extract was adjusted to pH 4.5 using an HCl solution. The extracted solution (100 mL) was filtered through Whatman No. 1 filter papers (GE Healthcare, Little Chalfont, UK). The filtrate was used as the extract for the L. casei assay.
On the day of the assay, L. casei grown on solid medium was inoculated into a vitamin B9-deficient medium (folic acid L.casei medium : Lactobacillus broth = 1:1, v/v). It was used after incubating at 37°C for approximately 6 h. The assay medium used in the microbiological assay of vitamin B9 was prepared by mixing 15 mL of folic acid L. casei medium, 75 μL of L. casei, and 150 μL of ascorbic acid (0.1 g/mL). Then, 150 μL of the sample extract was added to a 96-well plate and serially diluted. Then, 150 μL of assay medium was added to each well and incubated at 37°C for 20 h. Lactobacillus casei growth was measured at an absorbance of 595 nm using a microplate reader (Eon; BioTek Instruments, Winooski, VT, USA). The vitamin B9 content was calculated from the growth rate of L. casei using the microbial growth response curve for the standard solution. Gen5 data analysis software (version 2.04; Biotek Instruments) of the microplate reader was used to construct the calibration curve. The vitamin B9 content was expressed as the dietary folate equivalents (DFE) as follows.
β-Carotene extraction and analysis were performed as described byused the method of Moon et al. (2019). A 2.0 g powder sample was weighed into a glass extraction tube. Next, 10 mL of 6% pyrogallol ethanol solution was added. The samples were sonicated (Cole-Parmer 8893) for 10 min for homogeneous mixing. Next, 8 mL of a 60% KOH solution was added to the extraction tube. After mixing, nitrogen was injected into the top of the extraction tube to replace the air. An air condenser was attached to the nitrogen-purged extraction pipe. Saponification was performed at 75°C and 100 rpm for 1 h in a shaking water bath (HB-205SW, Hanbaek Scientific Co., Bucheon, Korea). After cooling, 20 mL of 2% NaCl solution was added to the saponification solution to terminate the reaction. 15 mL of an extraction solvent [hexane:ethyl acetate =85:15 (v/v), 0.01% 2,6-di-tert-butyl-4-methylphenol (BHT)] was then added to the saponification solution. After mixing for 2 min, the mixture was allowed to stand in the dark to separate the supernatant. Anhydrous sodium sulfate was added to the glass tube to remove moisture. The supernatant, from which the fat-soluble components were extracted, was passed through a glass tube. Only the supernatant from which water was removed was collected in a 50 mL volumetric flask. This process was repeated a total of three times. The collected supernatant was added and filled to 50 mL using an extraction solvent. This was mixed well and used as an extract for analysis.
The gastric extract (10 mL) was placed in a test tube. After volatilizing the solvent with nitrogen, it was re-dissolved in 1 mL of solvent [ethanol: chloroform=4:1 (v/v)]. Next, it was filtered with a 0.45 μm membrane filter (cellulose acetate, Advantec, DISMIC-13CP). The filtrate was analyzed using an HPLC equipped with a photodiode array detector (PDA, Shimadzu, Kyoto, Japan). The mobile phase conditions are listed in Table 2. The column used for the analysis was a Vydac 201TP C18 (4.6×250 mm, 5 μm; GRACE, Santa Clara, CA, USA), with detection at 452 nm. The injection volume was 20 μL, the flow rate was 1 mL/min, and the column oven temperature was set at 30°C.
| Time (min) | Mobil phase A1) (%) | Mobil phase B2) (%) |
|---|---|---|
| 0 | 75 | 25 |
| 8 | 75 | 25 |
| 50 | 10 | 90 |
| 55 | 10 | 90 |
| 57 | 75 | 25 |
| 65 | 75 | 25 |
Vitamin E content was analyzed using the method described by Moon et al. (2019). Saponification was performed in the same manner as the β-carotene extraction method. First, 2 mL of the extract was precisely extracted. The solvent was volatilized with nitrogen. The solution was then re-dissolved in hexane (1 mL) before the extract was filtered through a 0.45 μm membrane filter (cellulose acetate, Advantec, DISMIC-13CP). The filtrate was analyzed for all eight homologs of vitamin E [α, β, γ, δ-Tocopherol (T), α, β, γ, δ-tocotrienol (T3)] using an HPLC equipped with FLD (Shimadzu). For the mobile phase, n-hexane containing 0.6% isopropanol was used. The column used for analysis was LiChrospher Diol 100 (250×4 mm, 5 μm; Merck, Darmstadt, Germany). Wavelengths were at Exλ=285 nm and Emλ=325 nm. The injection volume was set to 20 μL and the flow rate was set to 1 mL/min. For vitamin E content, α-tocopherol equivalent (α-TE), a unit representing activity, was used, and was calculated using the following equation.
For vitamin K extraction and analysis, the methods described by Jakob and Elmadfa (1996) and Leenheer et al. (1992) were partially modified. A 1.0 g powder sample was weighed into a 25 mL wide-neck flask. Fifteen milliliters of dichloromethane: methanol=2:1 (v/v) were added. The mixture was sealed and ultrasonically extracted (Cole-Parmer 8893) for 1 h. To remove water, anhydrous sodium sulfate was placed on filter paper, and the extract was filtered. Methanol was used for washing and regular use. Four milliliters of the extract were placed in a test tube. The extract was nitrogen-concentrated and re-dissolved in 2 mL of hexane. Methanol:water [5 mL, 9:1 (v/v)] and 2 mL of the re-dissolved extract were added to a 15 mL conical tube. To wash off the residual concentrate, 3 mL of methanol:water=9:1 (v/v) was added to the test tube. After washing, the samples were placed in conical tubes. The mixture was centrifuged for 5 min at 718 ×g. The supernatant (1 mL) was placed in a test tube. The solvent was completely volatilized using nitrogen before being redissolved in methanol (1 mL) and filtered through a 0.45 μm membrane filter (cellulose acetate, Advantec, DISMIC-13CP). The filtrate was analyzed using an HPLC equipped with an FLD (Agilent Technologies) and a solvent delivery pump (Agilent Technologies). The mobile phase consisted of methanol:dichloromethane=9:1 (v/v), 10 mM/L zinc chloride, and 3 mM/L sodium acetate, and 5 mM/L acetic acid were added and mixed. The column used was a ZORBAX Eclipse XDB-C18 column (4.6×150 mm, 5 μm; Agilent) and a post column filled with zinc powder. The wavelength was at Exλ=243 nm and Emλ=430 nm, the injection volume was 20 μL, the flow rate was 1.0 mL/min, and the temperature was set at 35°C.
The DPPH radical scavenging activity was measured by partially modifying the method described by Blois (1958). First, a 2.0 g powder sample was weighed and 20 mL 70% ethanol was added. Sonication (Cole-Parmer 8893) was performed at 40°C for 30 min. After extraction, the samples were filtered through Whatman No. 1 filter paper (GE Healthcare). Then, 60 μL of the filtrate was mixed with 240 μL of 0.2 mM DPPH solution. After reacting for 30 min in the dark, the absorbance was measured at 517 nm. The DPPH radical scavenging activity was calculated by substituting the absorbance of the sample into a standard curve for each concentration. Gallic acid (Sigma-Aldrich Co.) was used as the standard. DPPH radical-scavenging activity was expressed as μg gallic acid equivalent (GAE)/g.
The ABTS radical scavenging activity was measured by partially modifying the method described by Arts (2004). First, a 2.0 g powder sample was weighed and 20 mL 70% ethanol was added. Sonication (Cole-Parmer 8893) was performed at 40°C for 30 min. After extraction, the samples were filtered through Whatman No. 1 filter paper (GE Healthcare). ABTS reagent (7 mM ABTS reagent) was measured at 734 nm as the standard. It was then diluted to an absorbance value was 0.70±0.02. After mixing 15 μL of the filtrate and 285 μL of the diluted ABTS solution and reacting in the dark for 7 min, the absorbance at 734 nm was measured. The ABTS radical scavenging activity was calculated by substituting the measured absorbance into the calibration curve for each concentration. L-Ascorbic acid (Junsei Chemical Co., Ltd., Tokyo, Japan) was used as the standard. The ABTS radical scavenging activity was expressed as mg ascorbic acid equivalent (AAE)/g.
The total polyphenol content was determined using the method described by Singleton et al. (1999), with some modifications. First, a 2.0 g powder sample was weighed and 20 mL 70% ethanol was added. Sonication (Cole-Parmer 8893) was performed at 40°C for 30 min. After extraction, the samples were filtered through Whatman No. 1 filter paper (GE Healthcare). First, 1 mL of a 2% Na2CO3 solution was added to 50 μL of the filtrate and allowed to stand for 3 min. After adding 50 μL of 50% Folin-Ciocalteu reagent, the mixture was allowed to stand for 30 min. The absorbance was measured at 750 nm. The total polyphenol content was calculated by substituting the absorbance of the sample into a calibration curve for each concentration. Gallic acid was used as the standard. The total polyphenol content was expressed as mg GAE/g.
The total flavonoid content was determined using the method described by Zhishen et al. (1999), with some modifications. First, 2.0 g of the powder sample was weighed and 20 mL 70% ethanol was added. Sonication (Cole-Parmer 8893) was performed at 40°C for 30 min. After extraction, the samples were filtered through Whatman No. 1 filter paper (GE Healthcare). Subsequently, 400 μL of 70% ethanol and 30 μL of 5% NaNO2 were mixed with 100 μL of filtrate. After 30 s, the reaction proceeded in a dark room for 5 min. The sample mixture was put into 30 μL of 10% AlCl3 ․ 6H2O and left for 5 min. Subsequently, 200 μL of 1 M NaOH and 200 μL of DDW were added. The absorbance values were measured at 420 nm. Total flavonoid content was calculated by substituting the absorbance of the sample into a calibration curve for each concentration. Quercetin (Sigma-Aldrich Co.) was used as the standard. The total flavonoid content was expressed as μg quercetin equivalent (QE)/g.
For the statistical analysis, the mean and standard deviation of each measured parameter were calculated using SPSS (Statistics Package for the Social Sciences ver. 22.0 for Windows, SPSS Inc., Chicago, IL, USA). Significant differences between samples were verified using one-way ANOVA at a significance level of p<0.05. When significant, a post-hoc test was performed using Duncan’s multiple range test at a confidence level of 95%.
3. Results and discussion
Fig. 1 shows the appearance of the three types of kimchi cabbage, CKC, GKC, and RKC. The details of the width, length, and thickness are listed in Table 3. There were no significant differences in the thickness and lengths of the three types of kimchi cabbages. However, the widths of the RKC was 11.94 cm, the smallest value (p<0.05).
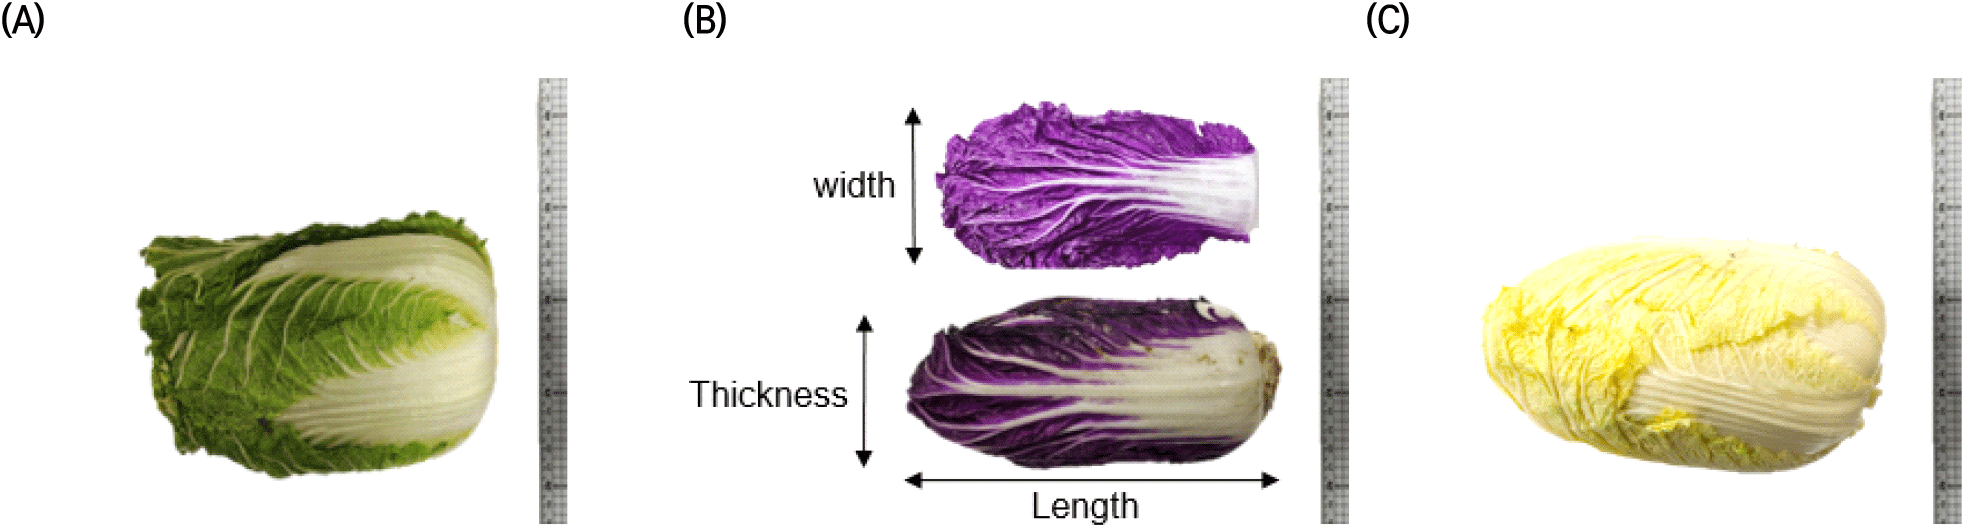
| Samples1) | Width (cm) | Length (cm) | Thickness (cm) |
|---|---|---|---|
| CKC | 17.42±1.73a2) | 25.82±0.43a | 19.28±1.40a |
| GKC | 16.33±1.44a | 25.07±2.54a | 18.67±2.25a |
| RKC | 16.76±0.83a | 26.76±3.08a | 11.94±0.90b |
The chromaticity of each variety of freeze-dried kimchi cabbage is presented in Table 4. Lyophilized homogeneous kimchi cabbage powder was used as the sample. Based on these results, CKC (91.95) attained the highest value for lightness (L*), RKC (9.31) for redness (a*), and GKC (29.86) for yellowness (b*). In purple cauliflower, anthocyanin accumulation is not limited to the outer cell layer (Chaves-Silva et al., 2018; Chiu and Li, 2012). It also occurs in the central region of the inflorescence meristem, near the vascular bundle, which explains its fairly high anthocyanin content. According to previous studies, RKC exhibits a high redness because of its high anthocyanin content. In GKC, carotenoids may be responsible for its high yellowness. Various colors, from yellow to red to orange, depend on the conjugated double bonds and various functional groups present in the food. Moreover, color intensity is influenced by the esterification of carotenoids and fatty acids (Khoo et al., 2011), which may be the case for GKC, which had the highest yellowness value.
| Samples1) | Chromaticity2) | ||
|---|---|---|---|
| L | a | b | |
| CKC | 91.95±0.03a3) | -7.55±0.02c | 20.34±0.03b |
| GKC | 87.04±0.03b | 0.22±0.02b | 29.86±0.05a |
| RKC | 63.99±0.04c | 9.31±0.02a | -5.03±0.02c |
Table 5 lists the major water-soluble vitamins present in the three kimchi cabbage varieties. All results are presented on a dry weight basis (moisture content 92%). Vitamin B6 (pyridoxine, pyridoxal, and pyridoxamine) is a cofactor in approximately 150 reactions regulating the metabolism of glucose, lipids, amino acids, DNA, and neurotransmitters (Mascolo and Vernì, 2020). The vitamin B6 content of the three varieties of kimchi cabbage was highest in the RKC (1,288.53 μg/100 g), followed by GKC (1,086.88 μg/100 g), and CKC (874.29 μg/100 g). Among the vitamin B6 vitamers, pyridoxal was detected the most, ranging between 670.19-896.25 μg/100 g. Pyridoxal accounted for approximately 70-77% of the total vitamin B6. Additionally, pyridoxamine ranged from 28.95-65.02 μg/100 g, which had the lowest composition ratio of about 3-6% of the total vitamin B6. CKC contained the lowest levels of all three vitamers (pyridoxine, pyridoxal, and pyridoxamine). Therefore, the vitamin B6 contents of RKC and GKC were 1.24 and 1.47 times higher than that of CKC, respectively.
Vitamin B9 (folic acid) plays an important role as a coenzyme in several single-carbon transfer reactions and in the synthesis of DNA, RNA, and protein components (Ruggeri et al., 1999). It is also involved in the prevention of cardiovascular diseases, growth, development, and reproduction. Particularly, pregnant women should consume twice the amount of vitamin B9 to prevent deformities caused by neutral tube defects. This has led to the United States mandating the use of folic acid fortified wheat flour (Bertuzzi et al., 2019). The lowest vitamin B9 levels were attained by CKC, at 429.32 y eat flour. In contrast, RKC (776.70 μg DFE/100 g) and GKC (690.65 μg DFE/100 g)] had 1.81 and 1.61 times higher vitamin B9 levels. In a preliminary study, the moisture content of the three kimchi cabbage varieties was 92%. Based on this value, it can be assumed that fresh CKC, RKC, and GKC contain approximately 33.26 μg DFE/100 g, 62.14 μg DFE/100 g, and 55.25 μg DFE/100 g, respectively. The results of this study are similar to the reported folic acid content of CKC (34 μg DFE/100 g) (MFDS, 2023). For comparison, spinach is a good source of folic acid, which contains 170 μg DFE/100 g (MFDS, 2023). The assumed folic acid content of the freshly improved kimchi cabbage varieties was approximately 1/3 of the folic acid content of spinach, but 1.87 and 1.66 higher than the levels in CKC, respectively. Pan et al. (2019) compared the vitamin B9 content of different sweet potato varieties, finding that varieties with darker yellow- and orange-colored flesh show significantly higher values than those with light flesh.
Table 6 shows the fat-soluble vitamin content of the three kimchi cabbage varieties. Vitamin A is mainly present in the form of retinols in animal foods and in the form of β-carotenoids in plant foods (Underwood and Arthur, 1996). β-carotene is a precursor of carotenoids and is converted to vitamin A when ingested. In this study, the β-carotene content of kimchi cabbage was analyzed and expressed as the vitamin A content. The highest values were attained in GKC (907.12 μg/100 g), which was approximately 3.2 times higher than that of CKC (279.76 μg/100 g). On the other hand, the β-carotene content of RKC (157.87 μg/100 g) was lower than that of CKC. Ruiz et al. (2005) reported a strong correlation between color values and total carotenoid content. At least 1,000.86% higher β-carotene content was observed in orange apricot flesh cultivars with higher yellowness than in white apricot flesh cultivars. It has been proven that the β-carotene content can vary depending on the color of fruits and vegetables. Seong et al. (2018) reported differences in the content of carotenoid components in each part of kimchi cabbage, being highest in the outer, middle, and inner leaves and a strong correlation with beta-carotene contents. Even in the same kimchi cabbage, the colors of the outer and inner leaves were different, resulting in different β-carotene values.
Vitamin E activity is expressed as mg α-tocopherol equivalent (α−TE)/100 g. α−TE = (α−T × 1.0) + (β−T × 0.5) + (γ−T × 0.1) + (δ−T × 0.01) + (α−T3× 0.3) + (β−T3× 0.05).
Vitamin E collectively refers to tocopherols or tocotrienols. The eight isomers are divided into α-, β-, γ-, and δ-tocopherols and tocotrienols according to the position and number of methyl groups (Kamal-Eldin and Appelqvist, 1996). In this study, the vitamin E homologs δ-T, β-T3, γ-T3, and δ-T3 were not detected in any of the three kimchi cabbage varieties, whereas α-T was confirmed to exist as the major form of vitamin E. The β-T and γ-T showed high contents in the decreasing order of CKC, RKC, and GKC. On the other hand, α-T was highest in the order of RKC (3.74 mg/100 g), CKC (3.14 mg/100 g), and GKC (1.34 mg/100 g). On the contrary, GKC (0.04 mg/100 g) had the highest α-T3. Furthermore, the α-TE was calculated by considering the in vivo biological activity of the vitamin E homologs. Results showed that CKC obtained 4.9 mg α-TE/100 g (highest), while GKC attained 1.8 mg α-TE/100 g (lowest), making the α-TE of CKC three times higher compared to GKC. Vitamin E is mainly present in plant cell membranes.
It is also an antioxidant that prevents the peroxidation of fatty acids, lowers cholesterol, and prevents chronic diseases such as cardiovascular diseases (Hill, 1998). According to the 2020 Dietary Reference Intake for Koreans, the required intake of vitamin E for adult males is 12 mg α-TE, and the upper limit of intake is 540 mg α-TE (KDRIs, 2020). Koreans frequently eat kimchi cabbage, which means that consuming the three varieties of kimchi cabbage can achieve sufficient intake. In this study, we proved that three varieties of kimchi cabbage are sources of vitamin E.
Vitamin K is a fat-soluble vitamin that regulates the synthesis of sphingolipids, which are important for cellular events such as proliferation, differentiation, senescence, and cell-cell interactions (Ferland, 2012). In nature, vitamin K exists in two forms, K1 (phylloquinone) and K2 (menaquinone) (Booth, 2009). The main sources of phylloquinone are dark-green leafy vegetables and vegetable oils, including canola, soybeans, and olives (Booth and Suttie, 1998) whereas menaquinone is produced by microorganisms. This vitamin is present in trace amounts in meat and fermented foods. The phylloquinone content in this study showed a significant difference according to the variety of kimchi cabbage. Phylloquinone content was highest in GKC (712.17 μg/100 g), followed by CKC (283.10 μg/100 g) and RKC (155.51 μg/100 g). Moreover, GKC levels were 2.5 times higher value than those of CKC, which can be attributed to the occurrence of phylloquinone in green leafy vegetables. Phylloquinone serves as an essential electron carrier in photosynthesis and as an electron acceptor for protein disulfide bond formation (Basset et al., 2017). Its biosynthesis occurs in the inner membrane of chloroplasts (Schultz et al., 1981). Morelli et al. (2022) reported that the exposure of leaves to strong light promoted carotenoid accumulation and accelerated the yellowish color transition in chloroplasts. Thus, the vitamin K content was consistent with the yellowness value.
Table 7 shows the antioxidant activity, total polyphenol, and total flavonoid content of the three kimchi cabbage cultivars. There was no significant difference on the antioxidant activity (DPPH and ABTS radical-scavenging activities) of GKC and CKC. However, RKC exhibits significantly enhanced antioxidant properties. The DPPH radical scavenging activity of RKC was 7,249.26 μg GAE/g, and the ABTS radical scavenging activity was 99.00 mg AEE/g. These values show that RKC has approximately 12 times higher DPPH radical scavenging activity and approximately 25 times higher ABTS radical scavenging activity than CKC. RKC had the highest total polyphenol (70.35 mg GAE/g) and flavonoid content (16.92 μg QE/g), which was 3.3 and 7.7 times higher than CKC, respectively. Additionally, the total polyphenol content (18.53 mg GAE/g) and total flavonoid content (1.33 μg QE/g) of GKC were significantly lower than CKC (p<0.05). However, there was little numerical difference. The rankings of total flavonoid and total polyphenol contents by variety were similar. Shin et al. (2014) reported that flavonoids exhibit similar trends in their content distribution characteristics because they are phenolic compounds.
The damage caused by free radicals and reactive oxygen species (ROS) in the body is associated with neurodegenerative disorders and cancer. To prevent this, the consumption of fruits and vegetables rich in polyphenols and flavonoids is recommended (Floyd, 1999; Goodwin and Brodwick, 1995; Youdim and Joseph, 2001). In particular, kimchi cabbage contains abundant antioxidant flavonols, such as hydroxy-benzoic acid, hydroxy-cinnamic acid, kaempferol, and quercetin (Ku et al., 2007). Seong et al. (2016) measured the antioxidant activity and content of kimchi cabbage by dividing it into outer, middle, and inner leaves. Based on these results, outer leaves had the highest antioxidant properties, followed by the middle and inner leaves. This confirmed that antioxidant content is related to antioxidant activity. Naturally occurring pigments, such as anthocyanins, chlorophyll, and carotenoids, are antioxidant components involved in the leaf coloration of vegetables (Cai et al., 2003; Escribano et al., 1998). The color of the leaves of the RKC cultivar analyzed in this study were reddish-purple. This is thought to have contributed greatly to the increase in its antioxidant capacity, because it contains higher amounts of anthocyanin pigments.
4. Summary
In this study, the physical (size and color), functional (antioxidant activity and total polyphenol and flavonoid contents), and nutritional (water- and fat-soluble vitamins) characteristics of GKC and RKC were analyzed and compared to CKC. There were no significant differences in physical properties based on the thickness and length of the three kimchi cabbages, although the outer leaves of RKC were significantly narrower than those of CKC and GKC. However, significant differences in functional and nutritional propertie among the three varieties of kimchi cabbages were observed (p<0.05). RKC which appears to be purple was found to have higher water-soluble vitamin contents (B6 and B9), DPPH and ABTS radical scavenging activities, and total polyphenol and flavonoid contents compared to CKC and GKC. In contrast, GKC appearing in yellow color was higher in fat-soluble vitamins, A and K, than the other varieties. Overall, red- and yellow-colored kimchi cabbages (RKC and GKC, respectively) were observed to contain higher water- and fat-soluble vitamins and antioxidant activities than CKC. Kimchi cabbage is primarily used in the kimchi industry. However, given that the colored kimchi cabbages has higher nutrient contents, this could have a great potential to be used in various food products in the future. These data analyzed by the National Reference Standard Center (National Food Composition Data Center) would be used to update the National Food Composition Table. This center performs analyses, method verification, and quality control to establish a national food and nutritional component database. In the future, if profile data such as polyphenols, flavonoids, anthocyanins, and carotenoids of colored-kimchi cabbages are established, health functionalities of colored kimchi cabbages could be more extensively evaluated.