
1. Introduction
Red pepper (Capsicum annuum L.), which has a characteristic spicy flavor and red color, is one of the most widely consumed vegetables worldwide (FAO STAT, 2012). Most red peppers are stored in a dried state to be processed into red pepper powder (Ku et al., 2001) through simple grinding. Red pepper powder is the main ingredient of widely consumed foods in South Korea, including kimchi and gochujang (red pepper paste). It is also the spice with the highest level of consumption (Kim et al., 2019). The components of red pepper powder that affect its quality include capsaicin, vitamin C, free sugars, organic acids, and pigments, whose contents vary according to the particle size in each use (Oh et al., 2011). For red peppers, the content of capsaicinoids, which are responsible for the hot taste, can vary for a given cultivar depending on the time of harvest and the cultivation conditions, e.g., daylight exposure, precipitation, and soil properties. Thus, quantifying and rating the hot taste of red pepper powder are critical (Mo et al., 2012). Numerous studies have been performed on the prediction of the particle size or the contents of capsaicinoids and other compounds of red pepper powder; in the research of Mo et al. (2011) and Mo et al. (2012), the quality characteristics of red pepper powder were analyzed. Nonetheless, most of the previous studies were conducted with fixed states of the particle size, the water content, and other factors of red pepper powder. The Korean Industrial Standard (KS, H 2157:2021) for red pepper powder limits the permitted water (≤13.0 wt.%) and ash (≤7.0 wt.%) contents. However, owing to the wide range of limits on the particle size and water content, there is a lack of uniformity in the quality characteristics of commercial red pepper powders across regions and producers.
The quality of red pepper powder is evaluated mainly according to the hot-taste compounds as an intrinsic factor and the color values as an extrinsic factor.
The hot taste of red pepper powder is reported to enhance the flavor of food and increase the appetite (Perucka and Oleszek, 2000). The main compounds responsible for the hot taste are capsaicinoids composed of several saturated and unsaturated moieties such as capsaicin and dihydrocapsaicin (Constant et al., 1995; Iwai et al., 1979). The redness [American Spice Trade Association (ASTA) color value] of red pepper powder is the most powerful influencing factor of consumer choice of the product (Hornero-Mendez and Minguez-Mosquera, 2001) and significantly affects the quality evaluation and product values. An increase in the ASTA color value an international unit defined by the ASTA to describe the color of red pepper powder was shown to lead to an increase in the content of red pigments (Yoon and Lee, 2004). At present, the level of hot taste, which is indicated by the label of commercial red pepper powder, varies across regions and producers, and compliance with legal guidelines is inadequate. Hence, there is a challenge in standardizing the hot taste as well as other quality characteristics of red pepper powder, and the criteria for consumer use remain ambiguous. It is thus necessary to develop a standard technique for measuring the quality characteristics of red pepper powder that can be applied by different regions and producers (Mo et al., 2012).
Various techniques are currently available for high-quality measurements of agricultural products through chemical analyses. However, such techniques are expensive and time-consuming and pose challenges in conducting exhaustive research. The most significant disadvantage is the destruction of the sample being analyzed (Gomez et al., 2006). In contrast, the use of nondestructive spectral analysis allows rapid high-quality measurements without preprocessing or a negative impact on the target agricultural product (Jha and Matsuoka, 2004). Among the nondestructive analytical methods, the reflectance method is widely used to measure the quality of agricultural products. It involves the irradiation of the sample with light and the reaction of the penetrating light with the particles close to the surface; the light is dispersed in varying directions, producing reflectance that is used for quality measurements (Lee et al., 2004).
Therefore, in this study, random samples of different commercial red pepper powders that varied in particle size and water content were purchased, and hyperspectral data were obtained from each sample using the hyperspectral imaging (HSI) technology of the shortwave infrared (SWIR) range, which was applied to the surface of each sample. The contents of capsaicinoids, water, and total sugar and the ASTA value were measured as the criteria of the quality characteristics of red pepper powder to evaluate the potential use of the SWIR HSI technique for nondestructive analyses of the quality characteristics of red pepper powder.
2. Materials and methods
The red pepper powders used in this study were random samples of commercial red pepper powders with varying particle sizes and hot-taste levels. Six samples were purchased from each of the following 17 regions: Jinan-gun (produced in October 2021), Imsil-gun, Gochang-gun, Sintaein-eup of Jeongeup-si, Gwanchon-myeon of Imsil-gun, Jeong-eup-si, Andong-si, Yongin-si, Yeongju-si, Jinan-gun (produced in November 2021), Osu-myeon of Imsil-gun, Bugwi-myeon of Jinan-gun, Jeongcheon-myeon of Jinan-gun, Gyebuk-myeon of Jangsu-gun, Maryeong-myeon of Jinan-gun, Mujang-myeon of Gochang-gun, and Wonpyeong-ri of Geumsan-myeon of Gimje-si. Additionally, four samples were purchased from Uiseong-gun. In total, 106 samples were used to obtain hyperspectral images and spectroscopic data.
To precisely weigh 2 g of red pepper powder, 10 mL of methanol was added with five boiling tips for thorough mixing. After 1 h extraction on a Dri-Block Heater (MaXtable H10, DaiHan, Incheon, Korea) at 90℃, the solution was cooled at the ambient temperature for 1 h. The cooled extraction solvent was filtered using filter paper (Whatman No. 1) and then a 0.2-μm syringe filter, and the resulting capsaicinoid extract was used in subsequent analyses. For quantification, 20 μL of the extract was injected into a high-performance liquid chromatography (HPLC) system (Agilent 1260 infinity Ⅱ, Agilent Technology, Agilent Co., Santaclara, CA, USA). For the XTerraTMRP18 (5 μm, 4.6×150 mm id., Waters, Milford, MA, USA) column set at 35℃, 1% acetic acid and acetonitrile were used as the mobile phase. At a flow rate of 1 mL/min, the separation was based on the gradient method, as shown in Table 1. Ultraviolet light with a wavelength of 280 nm was used for absorbance measurements. The reference compounds were capsaicin standard (Sigma-Aldrich, Co. Ltd., St. Louis, MO, USA) and dihydrocapsaicin standard (Sigma-Aldrich, Co. Ltd.).
| Time (min) | (A) 1% acetic acid in water (%) | (B) Acetonitrile (%) |
|---|---|---|
| 0-3 | 60 | 40 |
| 15 | 38 | 62 |
| 16 | 20 | 80 |
| 20 | 20 | 80 |
The water content of red pepper powder was measured as the difference between the weights before and after drying for approximately 3 g of red pepper powder on an aluminum plate of a known weight. For the analysis, the sample was dried for 6 h in a 70°C vacuum oven dryer (vacuum dryer OV-11, Jeio Tech, Daejeon, Korea) in accordance with the ASTA analytical official method (1997).
The ASTA color value was measured in accordance with the ASTA analytical official method. In a 100-mL volumetric flask, accurately weighed 0.1 g of red pepper powder was placed, and acetone was added to adjust the volumes to a uniform level. After 1 min of shaking, the mixture was left in a dark room for 16 h to prepare the test solution. The absorbance was measured at 460 nm, and the following equation was used for the calculation.
A: Absorbance at 460 nm
W : Sample weight (g)
To accurately weigh 2 g of red pepper powder, 40 mL of 80% ethanol was added for 1-min extraction on a vortex mixer. After filtration using a 0.2-μm membrane filter, 20 μL of the extract was injected into the HPLC system (Agilent 1260 infinity Ⅱ, Agilent Technology). YMC-Pack Polyamine Ⅱ (4.6×250 mm2, 5 μm, YMC Company Limited, Kyoto, Japan) was used as the column. The temperatures of the column and RI detector were set at 30 and 35°C. The solvent was acetonitrile: water = 75:25, and the flow rate was 1 mL/min. The standard compounds were fructose, glucose, and sucrose (Sigma-Aldrich, Co., Ltd.), and the sum of the contents of these compounds was used as the total sugar content.
The sample was placed against a black background plate, and the SWIR HSI system (IMEC Kapeldreef 75, 3001 Heverlee, Belgium) with a spectral range of 900-1,700 nm and image resolution of 2,048×1,088 was used. The line scan method was used to obtain the hyperspectral images. The number of bands was 256. The spectrometer had two halogen lamps on either side. For the spectral acquisition, the frame rate was 10, and the exposure time during the measurements was 10 s. For the measurements, 4 g of each sample was placed in a clear cell culture plate with a diameter of 2.5 cm and depth of 2 cm (SPL Life Sciences Co,, Pocheon, Korea), and the mean of 10 measurements was calculated. Each spectral image was extracted using the Region of Interest function of the ENVI software (version 5.4, Exelis Visual Information Solutions, Harris Co., Boulder, Co, USA).
To develop a model for predicting the internal quality according to the hyperspectral reflectance spectrum, partial least squares (PLS) regression analysis was used. In the PLS analysis, the spectral data of nondestructive measurements were applied as the independent variables, and the data of destructive measurements, i.e., the capsaicinoid, water, and total sugar contents and ASTA color value, were used as the dependent variables. Thus, a linear regression model was constructed. The multivariate independent variables were reduced to new variables, whereby a regression equation was obtained to develop a prediction model. For the dependent variables, 3 or 4 samples of red pepper powder from each of the 18 regions were used. Ten measurements were performed for each sample. The samples were divided at a ratio of 7:3; i.e., 71 were used for model development, and 35 were used for model validation. The accuracies of the calibration and prediction models were expressed by the determination coefficient of calibration (Rc2) and the determination coefficient of prediction (Rp2), respectively. The Unscrambler X software (10.2, Camo, Oslo, Norway) was used to construct the prediction model for the quality characteristics of red pepper powder.
For the extracted data, various preprocessing methods, including the standard normal variate (SNV), multiple scatter correction (MSC), and Savitzky-Golay derivative (SG), were applied to remove noise and reduce the resulting errors in the spectral data according to the characteristics of the analyzed samples. The SNV and MSC were used to remove the light scattering in the spectrum. The SG was used to eliminate the shift of the baseline due to the difference in the optical path or changes in analytical conditions and to highlight the micro-characteristics of the spectrum (Han et al., 2015).
3. Results and discussion
Table 2 presents the results of analyzing the main compounds that influence the quality of red pepper powders in the samples randomly purchased from different regions in South Korea. The contents of capsaicinoids distributed across the regions ranged from 42.44 to 840.03 mg/kg, with a large regional deviation at 61.36 mg/kg. This agreed with the studies of Shin and Lee (1991), Park (2004), and Kim et al. (2006), wherein the contents of capsaicinoids as the main compounds responsible for the hot taste of red pepper were shown to vary among different cultivars and considerably according to the region and conditions of cultivation even within an identical cultivar. For the water content, the range of the distribution was 6.17%-11.23%, satisfying the quality standard criterion of ≤15% for commercial red pepper powders (Ku et al., 2004). The range also satisfied the KS criterion of ≤13.0%. The ASTA color value ranged from 63.10 to 121.71. This coincided with the results of Kim et al. (2002) and Kim et al. (2008), who reported that the ASTA color value can be affected in different ways by variables such as the time of fruit harvest, position of fruiting, and time of sunlight exposure. The range of the total sugar content was 7.04%-17.15%. All the quality indicators analyzed in this study exhibited large deviations in the measured values. This is attributed to the differences in the red pepper cultivar and region of cultivation, as well as the lack of uniformity across variables such as the particle size and water content.
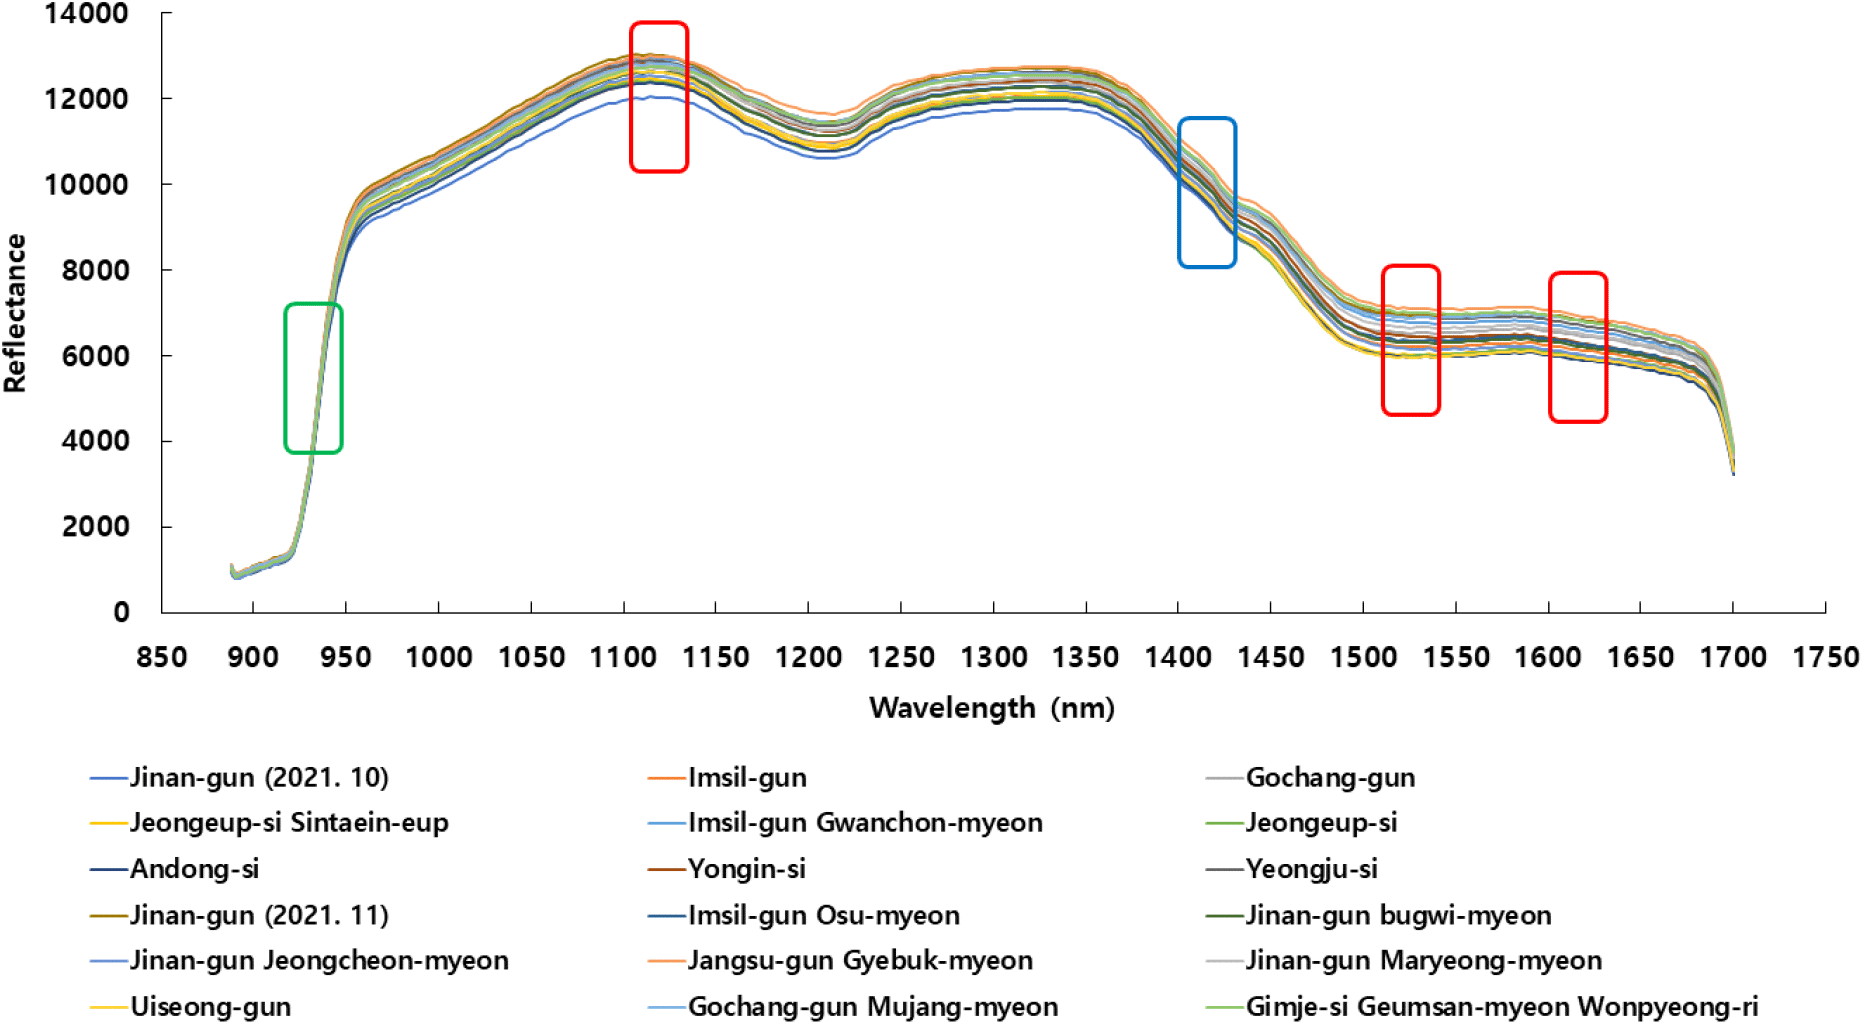
The mean spectra at 900-1,700 nm obtained for the red pepper powder samples produced in 18 regions are presented in Fig. 1. Mo et al. (2011) reported that capsaicinoids were associated with the 1,100-1,120, 1,320-1,350, 1,510-1,530, and 1,620-1,640-nm ranges. Krepper et al. (2018) reported that the water content was associated with the 1,440-1,450 nm range, and another study indicated that the spectrum at 935 nm was associated with free sugars (Shao et al., 2021). In the present study, the hyperspectral reflectance spectra of red pepper powder exhibited varying patterns according to the region of production. According to the differences in the reflectance spectra in the areas associated with capsaicinoids and water, a model for the nondestructive prediction of the actual capsaicinoid, water, and total sugar contents was developed.
The PLSR-based model for predicting the capsaicinoid, water, and total sugar contents and ASTA color value for red pepper powder is presented in Fig. 2. The Rc2 of the model was the largest (0.9263) for the ASTA color value, followed by 0.8310 for the capsaicinoid content and 0.7408 for the total sugar content, and was the smallest (0.6910) for the water content. The small Rc2 for the water content is attributed to the large deviation in the particle size of red pepper powder across regions and the resulting variation in surface area, which prevented uniformity in the rate of water evaporation among the samples. The particle size of red pepper powder leads to the variation of the reflectance intensity, as indicated by previous studies such as those of Barajas et al. (2007) and Gupta et al. (2005), who reported that physical properties such as the particle size, distribution, and density were associated with the reflectance spectra. In a follow-up study, these factors should be adjusted to obtain larger Rp2 values.
The hyperspectral reflectance spectra of red pepper powders from different regions were used to validate the prediction model for the main quality indicators. For the validation, 30% (n=35) of the samples were used to test the PLSR model developed using 70% (n=71) of the samples, and the results are presented in Fig. 3. The Rp2 was the largest (0.8488) for the ASTA color value. The Rp2 was similar between the capsaicionoid content (0.6690) and the water content (0.6688). The Rp2 was the smallest (0.5611) for the total sugar content. For both Rc2 and Rp2, the ASTA color value, which indicated the content of red pepper pigments, and the content of capsaicionoids as the hot-taste compounds exhibited large values. This was consistent with the results of Ananthan et al. (2018), Barbero et al. (2014), and Contreras-Padilla and Yahia (1998), who reported that the capsaicinoid concentrations increased as red peppers matured with the color change from green to red and that the capsaicinoid concentration was correlated with the red color. These findings verified the possibility of predicting the hot taste and the ASTA color value as the main quality characteristics of red pepper powder even without fixing factors such as the region of production, particle size, and water content. Additionally, as reported by Lim et al. (2012), changes in the water content during sample collection are not likely to induce a significant variation in the capsaicinoid content or the ASTA color value.
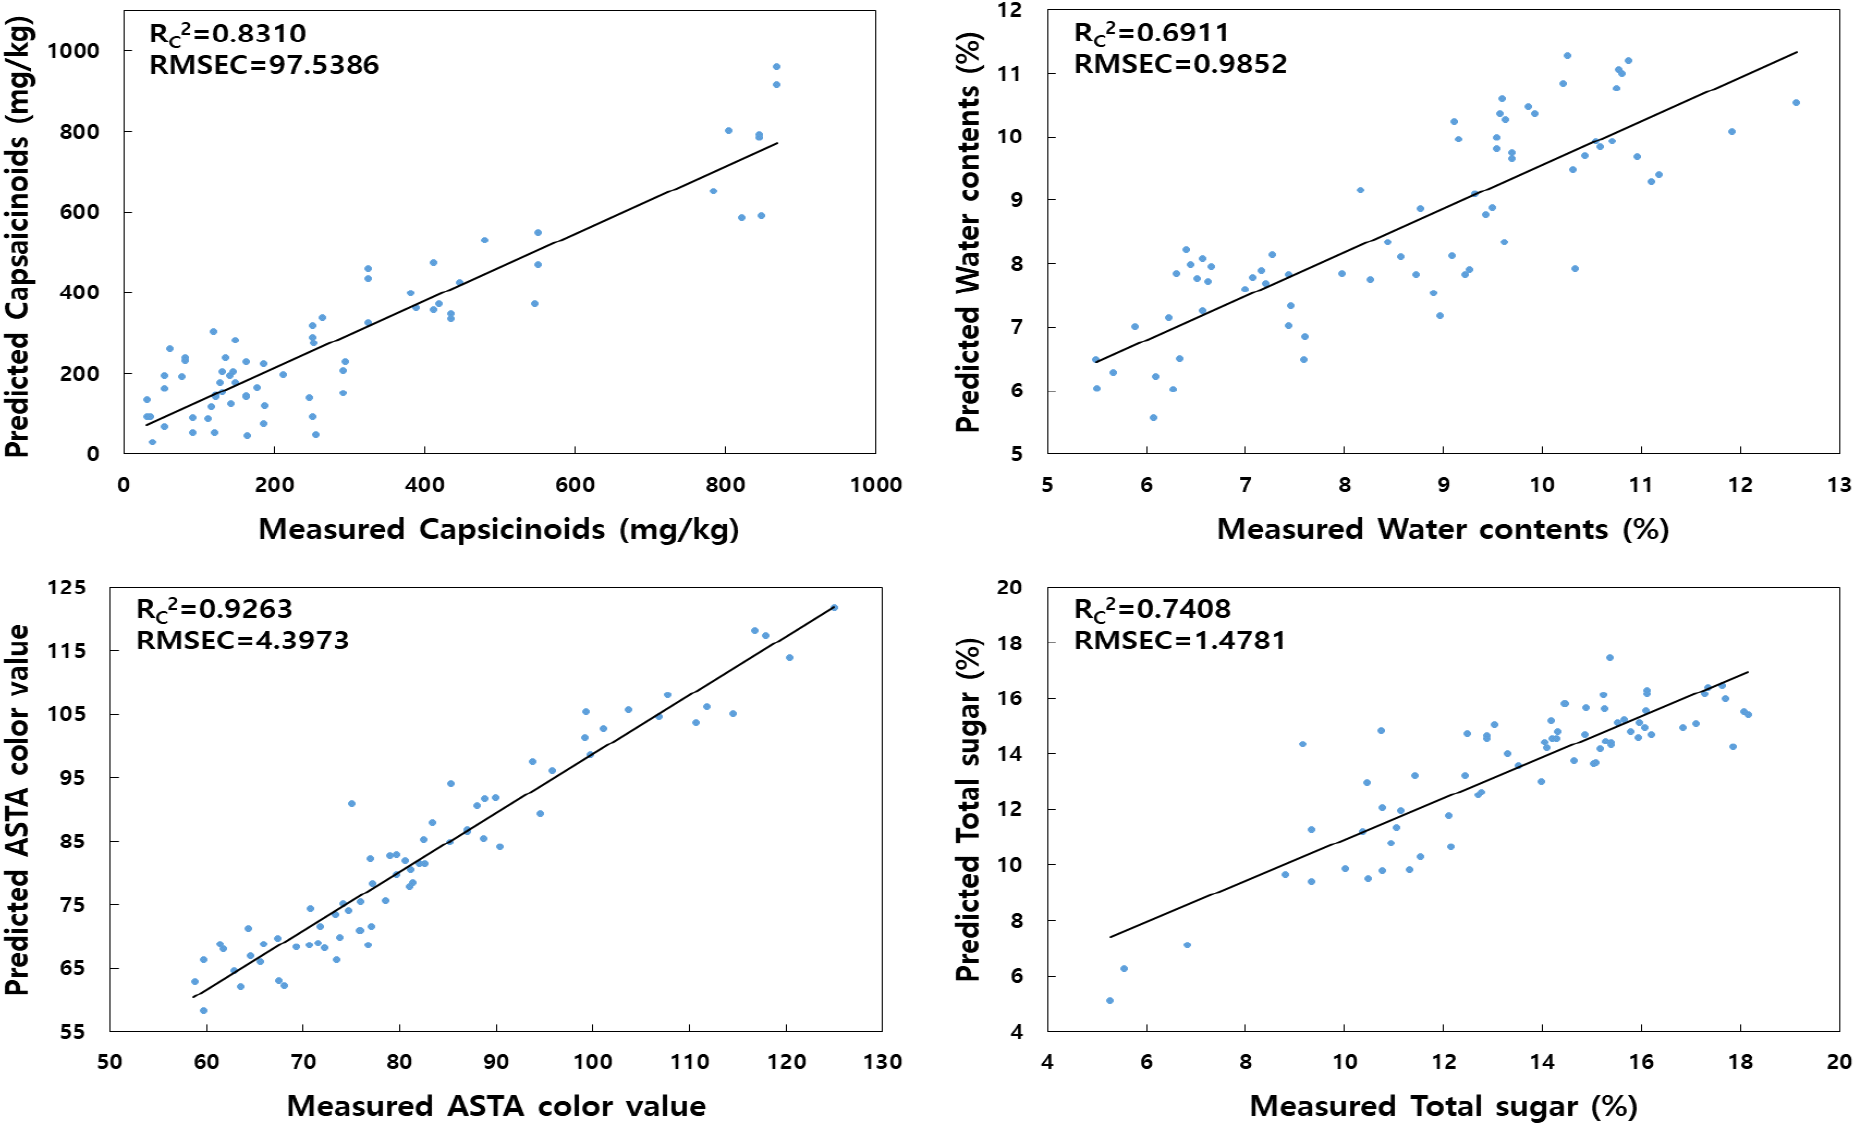
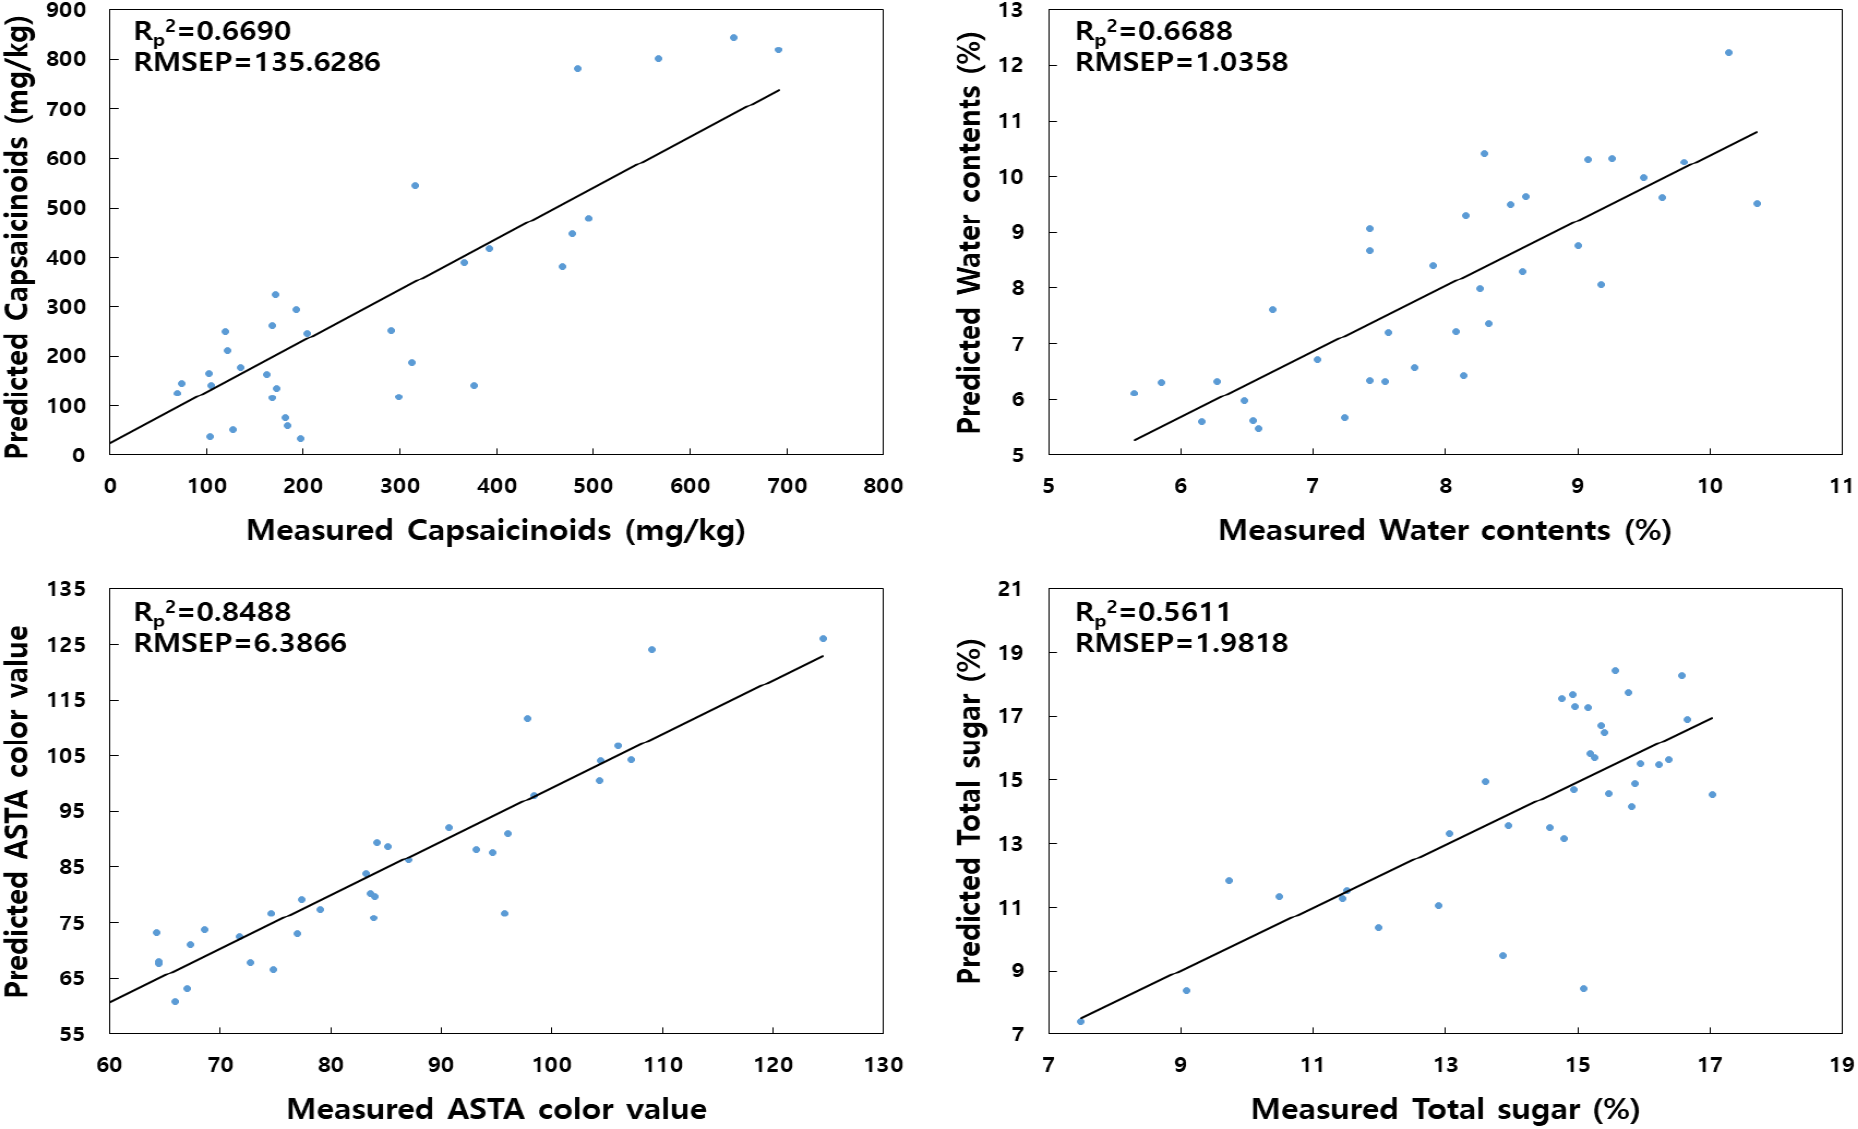
Table 3 presents the results of model validation using the PLSR model to which various preprocessing methods were applied for increasing the accuracy of quality analysis. The Rp2 was 0.8892 and 0.8984 when the SNV and MSC preprocessing methods, respectively, were applied for preventing the impact of light scattering, which indicated the highest validity of the model for the ASTA color value. The Rp2 was 0.8413 and 0.6025 when the SG primary and secondary gradient preprocessing methods, respectively, were applied for preventing the spectral baseline shift caused by the optical path or analytical conditions or for highlighting the micro-characteristics, which also indicated that model had the highest validity for the ASTA color value. For all the spectral preprocessing methods, the prediction performance was outstanding for the capsaicinoid content and the ASTA color value. Among the preprocessing methods, the highest accuracy was achieved with the MSC without fixing factors such as the particle size and water content.
4. Summary
The main quality characteristics of domestic commercial red pepper powders from different regions in South Korea were analyzed, and SWIR HSI technology was applied for nondestructive quality prediction. For 106 red pepper powder samples from 18 regions, the contents of capsaicinoids, water, and total sugar and the ASTA color value were measured. The measured values exhibited large deviations due to various factors, such as the region of cultivation, particle size, and water content. The acquired hyperspectral data were used to conduct PLSR analyses on 70% (n=71) of the red pepper powder samples regarding the main quality characteristics. The Rc2 was ≥0.8 for the ASTA color value (0.9263) and capsaicinoid content (0.8310). The Rp2 from the model validation using 30% (n=35) of the hyperspectral data was the largest (0.8488) for the ASTA color value. The validity was similar for the contents of capsaicinoids and water. To increase the accuracy of the quality prediction model, spectral preprocessing was performed using the SNV, MSC, SG-1, and SG-2 methods, and the resulting model accuracy was increased to the largest extent with the MSC method. For all the spectral preprocessing methods, the prediction accuracy was the highest for the ASTA color value. Our results confirm the possibility of predicting the quality characteristics of red pepper powder using HSI technology, even for commercial red pepper powders with varying particle sizes and water contents.