1. Introduction
High stress, unbalanced nutrition, and physical inactivity contribute to many human diseases in today’s fast-paced world. As a result, there is a growing interest in healthy foods (Chae et al., 2004). Edible mushrooms offer not only great flavor but also valuable nutrients and bioactive compounds that can serve medicinal purposes (Choi et al., 2016a; Lee et al., 2019). However, fresh mushrooms have a limited shelf life due to their high respiration rates and moisture content, leading to enzymatic browning and altered texture/flavor during storage. Unlike many fruits and vegetables, mushrooms lack an epidermis to protect them from physical damage and water loss. The degree of surface discoloration (such as browning), condition of the mushroom cap (pileus), and texture of the fruiting body all serve as key quality indicators of mushrooms during distribution (Bae et al., 2010; Han et al., 1992; Mahajan et al., 2008). Therefore, it is crucial to develop measures to enhance the shelf life and maintain the freshness of mushrooms throughout their storage and distribution.
The beech mushroom (Hypsizygus marmoreus) from the Tricholomataceae family is commonly found in East Asia and Northern Europe. This mushroom is known for its clustering, dense texture and thick flesh, which gives it a relatively crisp texture (Bolormaa et al., 2011; Kim et al., 2018). It is rich in protein, low in fat, and contains a high level of glutamic acid which is well known as a rice refining component (Kim et al., 2016; Lim et al., 2010a). H. marmoreus can be divided into brown and white varieties based on the color of the pileus. The brown varieties are grown from tissue isolated from wild mushrooms, while the white varieties are produced through crossbreeding and taste less bitter than the brown ones (Bolormaa et al., 2012). Cultivation of this mushroom is time-consuming, taking approximately 100 days to reach maturity due to the extremely slow fungal growth. However, the slow growth rate also leads to a dense structure and a relatively long shelf life, making this mushroom suitable for domestic consumption and export (Lim et al., 2010b). Research is ongoing both in Korea and abroad to develop new varieties with excellent storage properties and improve the cultivation technology. Many applications have been filed to register new varieties. However, information is still lacking on how the active ingredients and quality characteristics of white H. marmoreus change during storage, especially a comparison between different cultivars (Lim et al., 2010c).
This study analyzed the appearance, physiochemical quality characteristics, nutritional profile, and functional components of a white H. marmoreus variety newly developed in Korea called EG2020 (Evergreen, 2020). The changes of quality characteristics during storage were compared between EG2020 and two existing commercial cultivars, in order to assess the storage stability. Also, consumer palatability was examined using sensory evaluation.
2. Materials and methods
The EG2020 cultivar was developed in 2020 by Evergreen Farm in Cheongdo, North Gyeongsang Province, Korea (application number App-2020-400). EG2020 samples were obtained directly from the farm. A Korean variety (H6) and a Japanese variety (HKT) of white H. marmoreus were obtained at the market. All three varieties were cultivated under the same conditions. Only the edible part of the mushrooms was harvested from the medium bottle. After packing with oriented polypropylene (OPP) films using the modified atmosphere (MA) technique, the mushrooms were stored for 1-42 days in a refrigerator at 10°C and 55% relative humidity (QBR-1000s, GMS Co., Ltd., Yangju, Korea). Changes in quality characteristics during storage were analyzed and compared between different varieties. The pileus and stipe were cut off from a bottle badge to examine the morphological, physiochemical, nutritional, and antioxidant properties. Before chemical analysis, the sample was dried in a drying oven (FO-600M, Jeiotech, Daejeon, Korea) at 45°C, ground using a 40-mesh grinder, and stored in a deep freezer at −80°C.
To examine the morphological characteristics, a digital camera (Canon EOS 100D, Tokyo, Japan) was used to take pictures of the front and sides of the mushrooms. Also, the size of the pileus and length of the fruiting body for the three varieties were measured using a caliper. The weight loss rate was evaluated as a percentage on the 14th, 28th, and 42nd day as (Wt − Wstorage day) / W1 × 100.
Changes in mushroom texture during storage were analyzed using a rheometer (texture analyzer, Compac-100, Sun Science Co., Tokyo, Japan). For measurement, the pileus and stipe of the mushroom were separated, pileus and stipe of equal size (height: 10 mm) and equal lengths (width: 15 mm) were prepared for each variety. The samples were measured at least 10 times, and the values were presented as mean±standard deviation (SD). Curves generated by the rheometer were used to determine the hardness, springiness, cohesiveness, and chewiness. The measurements were taken using a cylinder probe (No. 1, 20 mm diameter, circle) with a table speed of 120 mm/min.
To determine color changes in mushrooms during storage, the pileus and fruiting body were separated, and pilei of equal sizes and fruiting bodies of equal lengths were prepared for each variety. A colorimeter (JP/CR-300 series, Minolta, Osaka, Japan) was used to determine the lightness (L), redness (a), and yellowness (b) values for at least 10 samples from each variety, and the values were presented as mean±SD. The standard white plate had L=97.55, a=0.003, and b=1.63. The total color difference (ΔE) of mushroom samples during storage was calculated as
To monitor the pH change of mushrooms during storage, the sample was mixed with distilled water at pH 7.0 at a ratio of 1:9 (W/V) and homogenized at 25,000 rpm for 1 min (PT 1200 Polytron-Aggregate homogenizer, Kinematica Inc., NY, USA). The mixture was centrifuged at 4,000 rpm for 10 min (FLETA-40, Hanil Science Industrial, Gimpo, Korea), and the pH of the supernatant was measured three times using a pH meter (Orion 3-star, Thermo Scientific, Waltham, MA, USA). The soluble solid content was measured using the same supernatant with a digital refractometer (PAL-1, Atago, Tokyo, Japan). The measurements were taken at least three times, and the results were presented as mean±SD.
PPO activity in mushrooms during storage was measured using a modified version of the method developed by Pizzocaro et al. (1993). After adding 20 mL of McIlvaine citric-phosphate buffer (pH 6.5) to 10 g of sample, the mixture was homogenized at 25,000 rpm for 1 min (PT 1200 Polytron-Aggregate homogenizer), followed by centrifugation at 4,000 rpm for 10 min (FLETA-40). After mixing 1 mL of the supernatant with 2 mL of 0.1 M catechol solution, the absorbance was measured at 420 nm for 3 min using a UV-visible spectrophotometer (Optizen 3220UV, Mecasys, Daejeon, Korea). The enzymatic activity (Unit/min/g) was presented as enzyme units, where a 0.001 increase of absorbance in 0.1 mL of enzymatic solution while 1 min was considered equivalent to one unit.
The β-glucan content of mushrooms during storage was measured using a mushroom and yeast β-glucan kit (K-YBGL, Megazyme International Ireland Inc., Ireland) (Kwon, 2019). First, to measure the total glucan content, sulfuric acid (12 M, 2 mL) was added to 100 mg of dried sample and mixed in an ice water bath for 2 h on a shaker. Then, 10 mL of distilled water was added, and the mixture was incubated in a 100°C water bath for 2 h. After cooling the mixture, the acid was neutralized using 6 mL of 8 M NaOH, and the total volume was adjusted to 100 mL using 200 mM sodium acetate buffer (pH 4.5). A 1-mL aliquot of the solution was centrifuged at 13,000 rpm for 5 min. Next, 0.1 mL of the supernatant was mixed with 0.1 mL solution containing exo-1,3-β-glucanase (20 U/mL) and β-glucosidase (4 U/mL). After keeping the mixture in 40°C water bath for 1 h, 3 mL of the glucose oxidase-peroxidase (GOPOD) reagent was added, followed by incubation in 40°C water bath for 20 min. The absorbance was measured at 510 nm using a UV-visible spectrophotometer (Optizen 3220UV). The total glucan content was computed using the β-glucan content calculator provided by Megazyme.
Free sugars and organic acids produced during storage affect the saccharinity and flavor of white H. marmoreus. Their contents were analyzed using high-performance liquid chromatography (HPCL). The free sugar content was measured using an Alliance Waters Co. (Milford, MA, USA) HPLC system and Sugar-Pak I column (Ø 6.5 mm×300 mm, Waters Co.). To prepare the analyte, 1 g of dried mushroom was mixed with 10 mL of distilled water at room temperature on a shaking incubator at 200 rpm for 48 h. The extract was centrifuged at 4,000 rpm for 10 min (FLETA-40), and the supernatant was passed through a Whatman PVDF syringe filter (13 mm, 0.2 μm). HPLC conditions: 20 μL of sample, 0.01 M Ca-EDTA (50 mg/1 L dH2O) as the mobile phase, flow rate of 0.5 mL/min, and column temperature of 90°C. A refractive index (RI) detector was used for the analysis.
The organic acid content was measured using a Prominence (Shimadzu Co.) HPLC system and PL Hi-Plex column (Ø 7.7 mm×300 mm, 8 μM, Agilent Technologies, Germany). To prepare the analyte, 1 g of dried mushroom was mixed with 10 mL of 85% ethanol at room temperature on a shaking incubator at 200 rpm for 48 h. The extract was centrifuged at 4,000 rpm for 10 min (FLETA-40), and the supernatant was passed through a Whatman PVDF syringe filter (13 mm, 0.2 μm). HPLC conditions: 20 μL of sample, 0.005 M H2SO4 in water as the mobile phase, flow rate of 0.5 mL/min, and column temperature of 65°C. An RI detector was used for the analysis.
The free amino acid content of mushroom samples during storage was measured using an automated amino acid analyzer (L-8900, Hitachi). First, 2 g of hot air-dried powder sample was mixed with 10 mL of distilled water and homogenized (PT 1200 Polytron-Aggregate homogenizer) at 25,000 rpm for 1 min. After centrifugation at 4,000 rpm for 10 min (FLETA-40), 1 mL of the supernatant was mixed with 1 mL of 5% trichloroacetic acid, centrifuged at 10,000 rpm for 10 min, diluted five times with 0.02 N HCl, and passed through a Whatman PVDF syringe filter (13 mm, 0.2 μm). The filtrate was analyzed by HPLC under the following conditions: an injection volume of 20 μL, PF-1,2,3,4,6, PF-RG, R-3, and C-1 as the mobile phase, and ninhydrin solution (Wako, Japan) as the developer. The amino acids were separated using an ion exchange column (#2622SCPF) at a column temperature of 50°C and a reactor temperature of 135°C. A standard solution of free amino acids was prepared by mixing type ANII and Type B standard solutions (Wako).
TPC of mushrooms during storage was measured using a scaled-down version of the Folin-Denis method (1912). The sample and distilled water were mixed at 1:9 W/V ratio and homogenized (PT 1200 Polytron-Aggregate homogenizer) at 25,000 rpm for 1 min, followed by centrifugation at 4,000 rpm for 10 min (FLETA-40). The supernatant (20 μL) was added to a 96-well plate and mixed with 20 μL of 95% ethanol and 60 μL of distilled water. Then, 10 μL of 1 N Folin-Ciocalteu reagent was added, and the mixture was left standing for 5 min. After adding 20 μL of 5% Na2CO3, the mixture was left standing in the dark for 1 h. Absorbance was measured at 725 nm using a SPECTRO star Nano microplate reader (BMG LABTECH., Germany), and TPC was calculated using a standard gallic acid curve.
DPPH radical scavenging activity of mushrooms during storage was measured using the Blois (1958) method. The sample and distilled water were mixed at 1:9 W/V and homogenized (PT 1200 Polytron-Aggregate homogenizer) at 25,000 rpm for 1 min, followed by centrifugation at 4,000 rpm for 10 min (FLETA-40). The supernatant (50 μL) was added to a 96-well plate, mixed with 150 μL of 60 μM DPPH solution, and left standing in the dark for 15 min. Absorbance was measured at 517 nm using a SPECTRO star Nano microplate reader (BMG LABTECH., Germany), and DPPH radical scavenging activity (%) was calculated using the following formula:
The sensory quality evaluation of EG2020 was compared with a Japanese variety (HKT). The samples were blanched in boiling water for 1 and 2 min and prepared as single servings. The evaluation involved 30 undergraduate and graduate Food Engineering students from Kyungpook University, who had more expert knowledge about foods and were trained for sensory evaluations. A 7-point scale (1=dislike extremely, 4=neither like nor dislike, 7=like extremely) was used to rate the overall acceptability, flavor, appearance, and texture. The sensory evaluation was approved by the Institutional Review Board (IRB) at Kyungpook National University (IRB No: KNU-2020-0128).
All experiments were repeated at least three times, and the results are presented as mean±SD. The results were analyzed with one-way ANOVA and Duncan’s multiple range test to determine significance using IBM SPSS Statistics 26 for Windows (IBM Corp., Armonk, NY, USA). p<0.05 was considered statistically significant.
3. Results and discussion
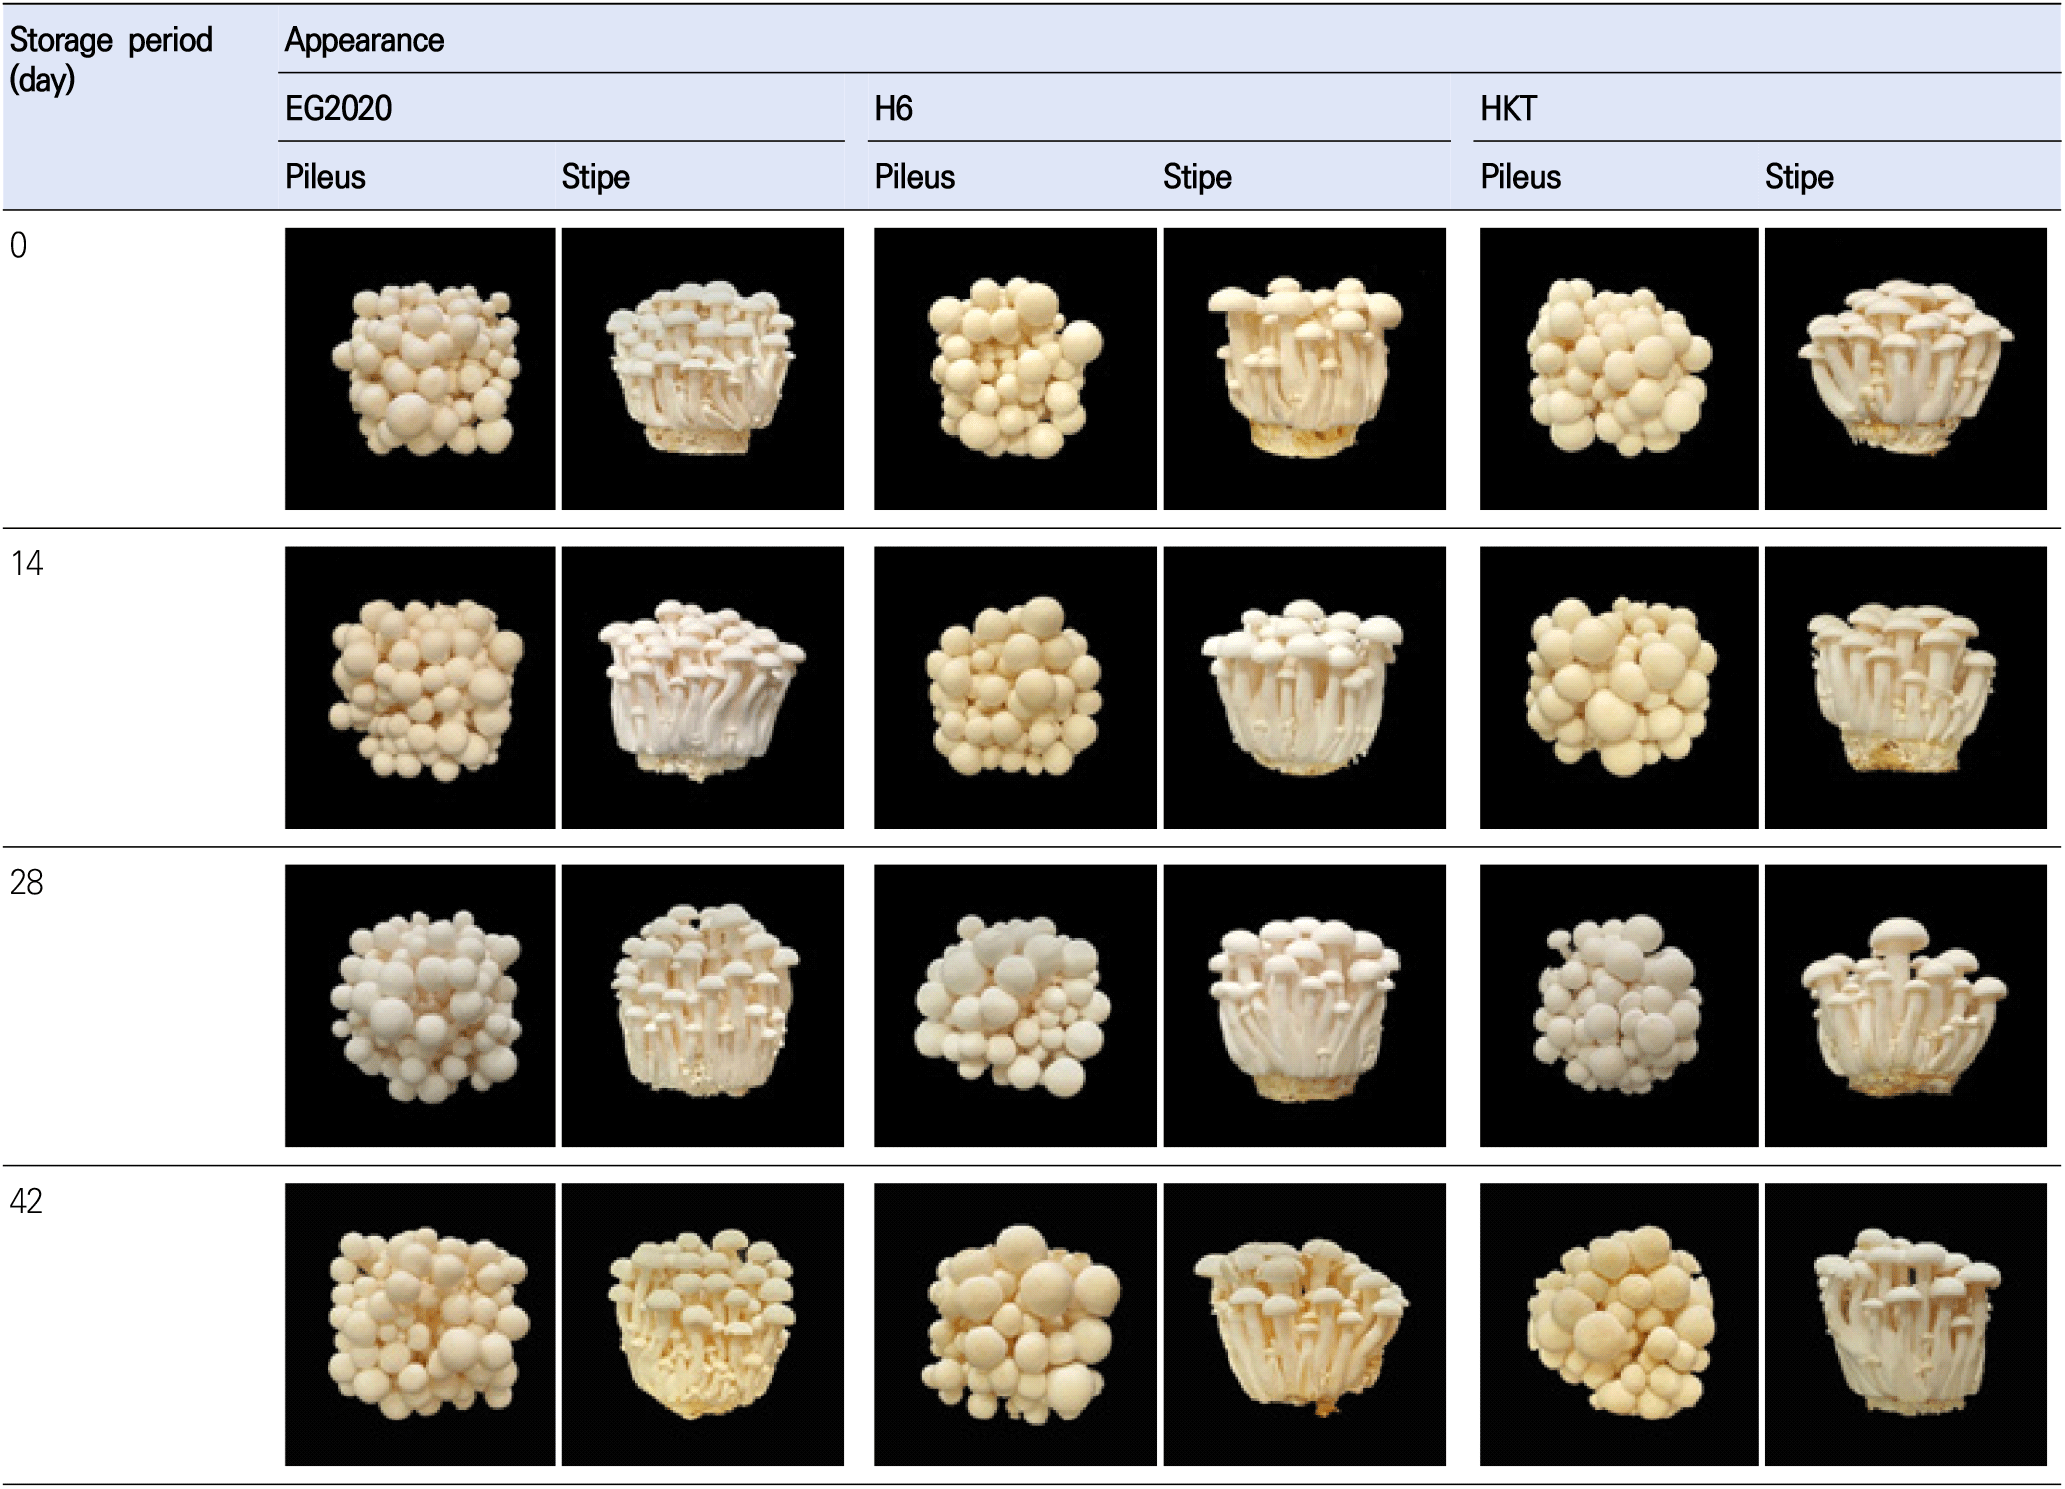
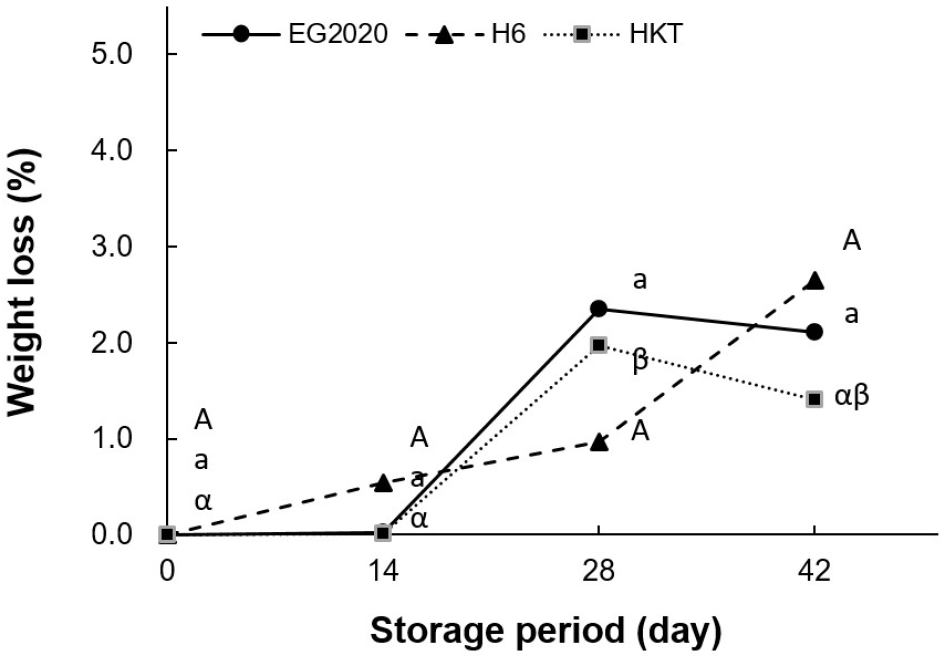
First, we compared the frontal and side appearances of white H. marmoreus varieties after storing for different durations. According to Fig. 1, there was no obvious change in all three varieties (EG2020, HKT, and H6) in terms of the pileus condition and stem (stipe) texture, even on the final day of storage (day 42). The weight loss rate indicates the degree of moisture loss during storage. As shown in Table 1 and Fig. 2, all mushroom samples continuously lost weight over the storage period. By day 42, the weight loss rate was 2.11% for EG2020, 2.65% for H6, and 1.40% for HKT. This is because the low temperature suppressed respiration and moisture loss (Choi et al., 2016b).
To accurately quantify the changes in mushroom appearance, the size of pileus and length of stipe were measured using a caliper (Table 2). The cap size was ranked as EG2020 < H6 < HKT. For each variety, the cap size decreased from immediately after harvest (day 0) to the end of storage (day 42): from 18.53±3.93 to 15.80±2.07 mm for EG2020, from 20.80±3.00 to 17.13±3.16 mm for H6, and from 23.80±6.42 to 22.47±2.33 mm for HKT. On the other hand, the stipe length of HKT was shorter than that of EG2020 and H6. The stipe length of EG2020 increased during storage, from 72.80± 11.89 mm on day 0 to 77.93±7.78 mm on day 42. However, that of H6 changed very little during the same period (from 81.20±6.61 to 80.40±11.00 mm), while that of HKT decreased slightly (from 72.67±6.42 to 66.87±6.62 mm). Overall, the new variety EG2020 has smaller pilei than H6 and HKT but relatively more numerous pilei and stipes, indicating a more compact form of growth and markedly greater weight compared to the other two varieties.
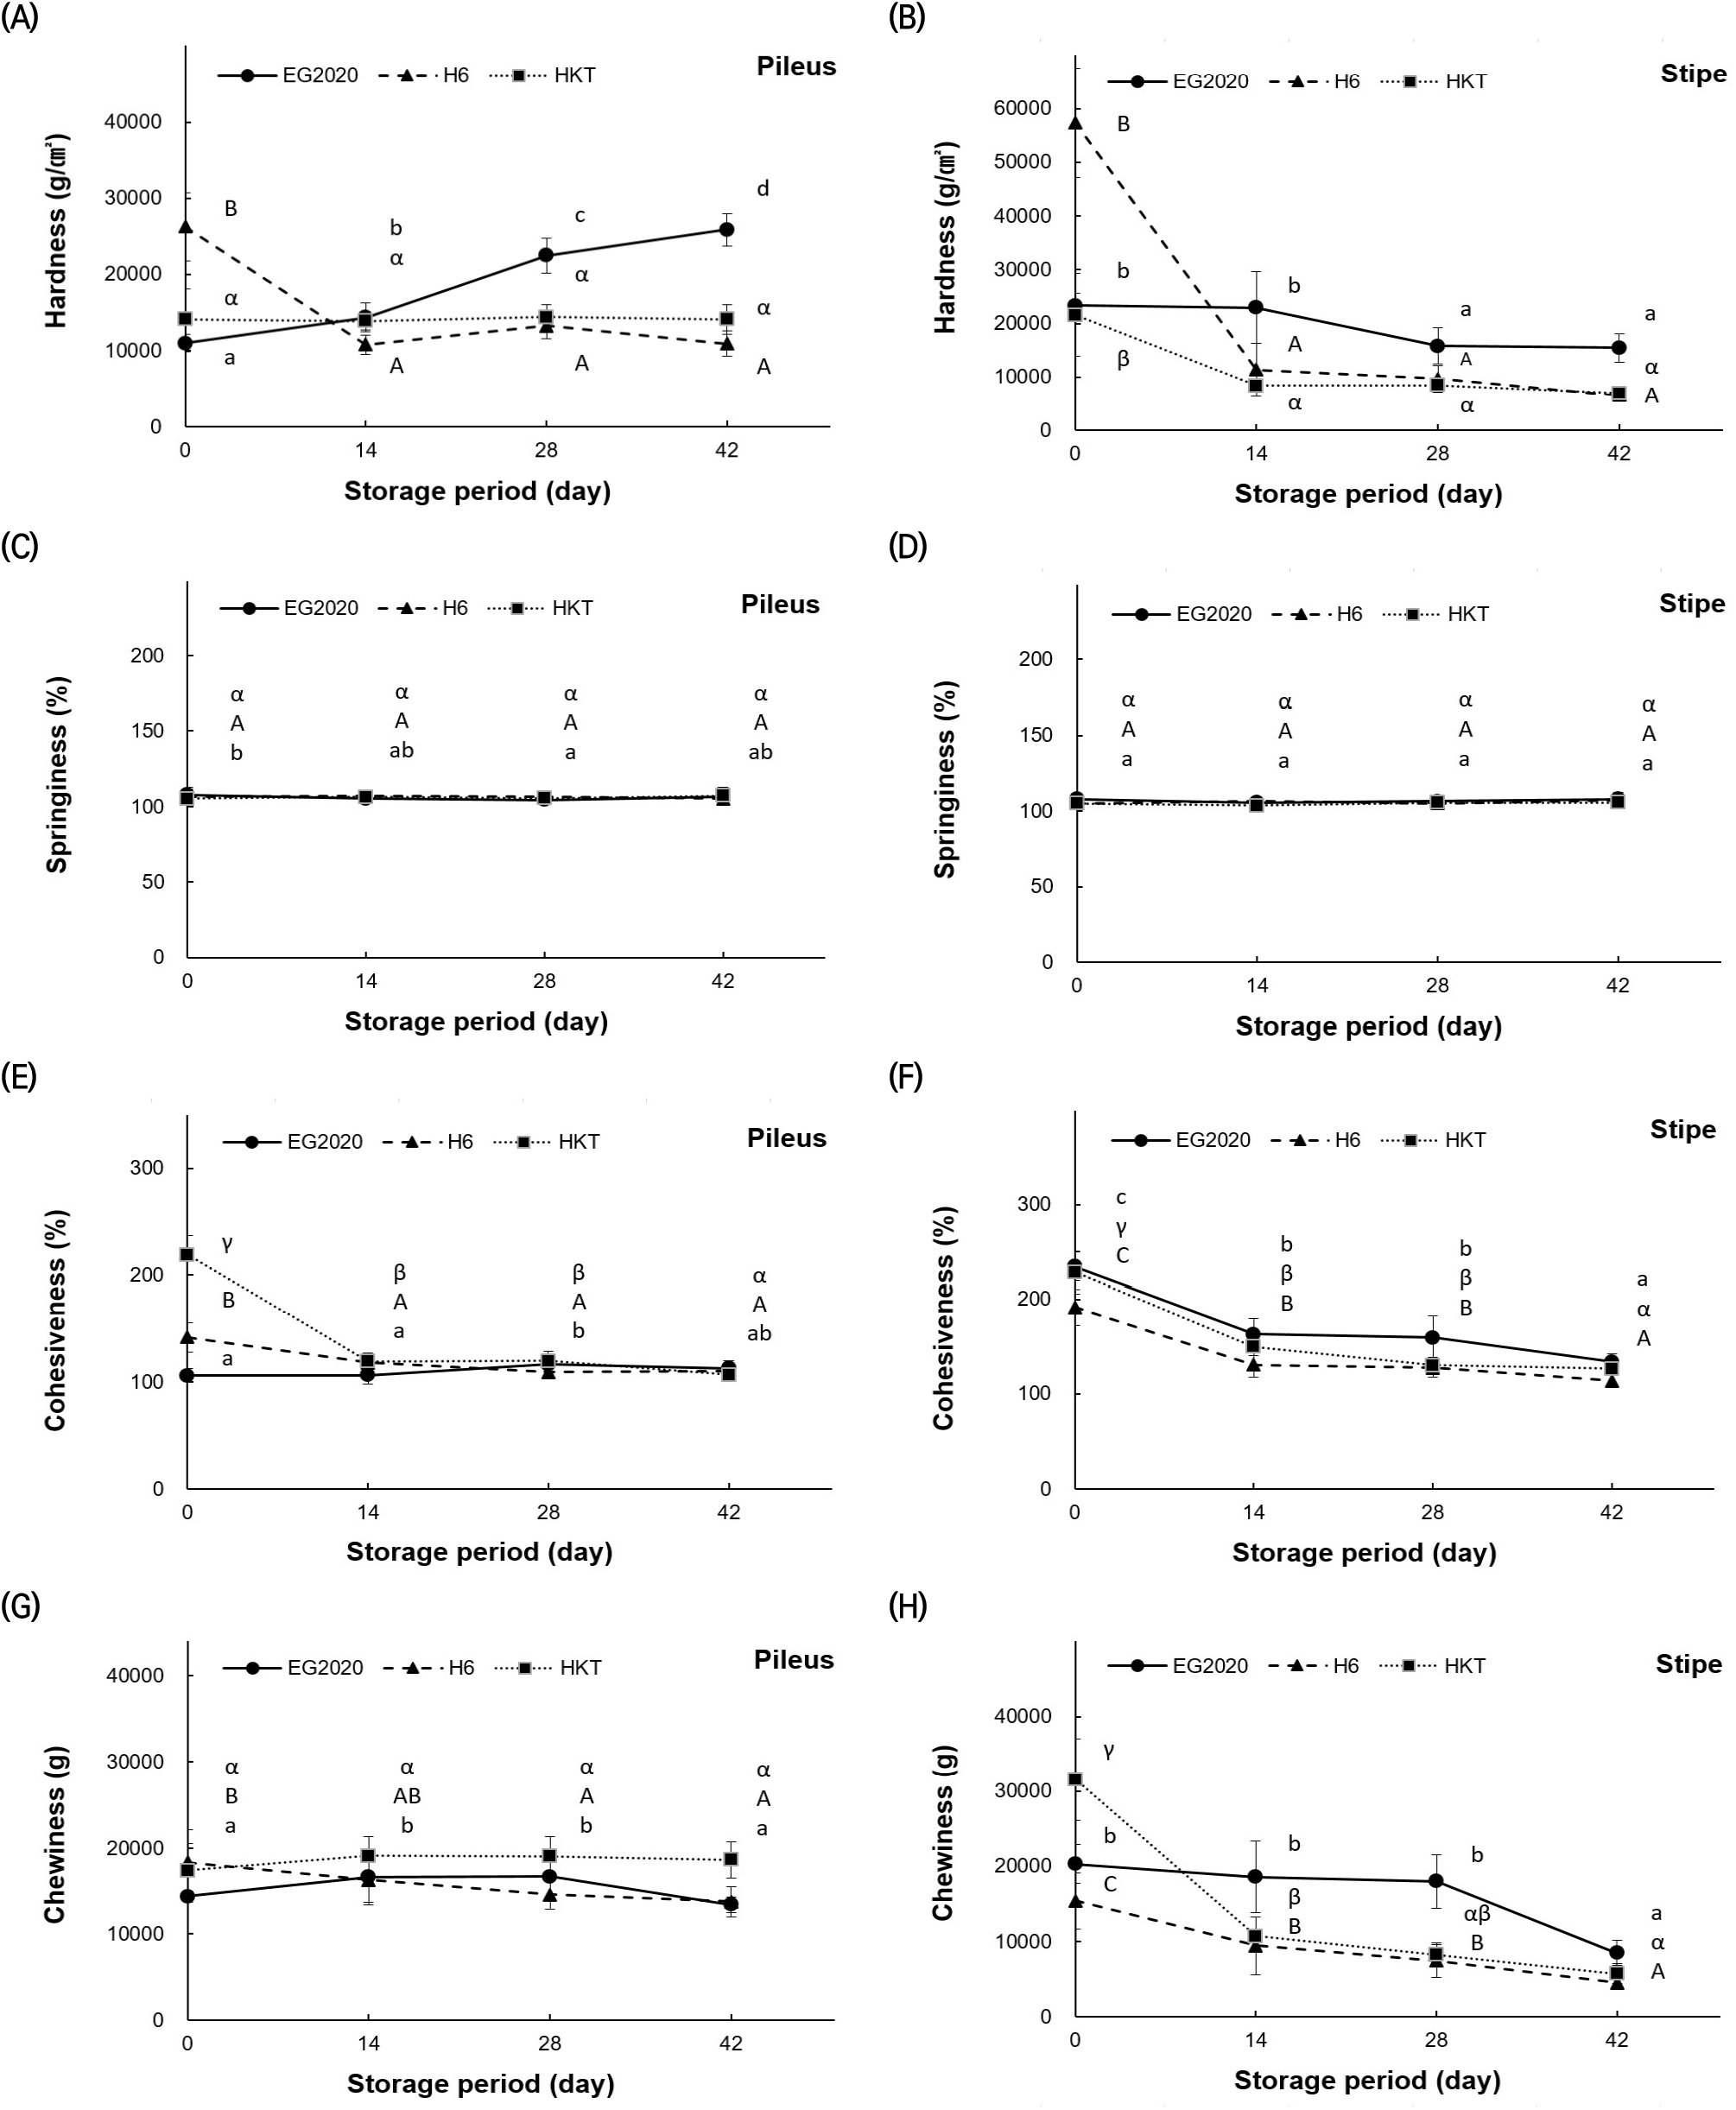
Fig. 3 shows texture changes of the three H. marmoreus varieties during storage. On day 0, H6 had the highest hardness in pileus and stipe (26,245.71±4,475.40 and 57,436.00±10,196.60 g/cm2, respectively), but the hardness decreased markedly throughout storage, resulting in the lowest values among the three varieties by day 42. Therefore, H6 showed the greatest reduction in hardness over time. Remarkably, the pilei of EG2020 actually showed a higher hardness on day 42 than on day 0, from 10,950.56±1,171.11 to 25,833.75±2,132.46 g/cm2, while the stipe hardness decreased from 23,383.75±2,222.82 to 15,468.75±2,645.74 g/cm2 during the same period. Cho et al. (2001a) reported that mushrooms are hard in the early phase of storage but become softer later due to respiration and transpiration. Here, EG2020 had the highest hardness after 42 days of storage, suggesting that this new variety is more robust after harvest than the existing varieties. The measured springiness was similar among the three varieties (103-107%), and there was little change over the storage period. The measured cohesiveness differed among the varieties, with no similarities. Chewiness tended to decrease for both the pilei and stipes during storage, which is probably strongly influenced by changes in physical properties such as hardness.
The degree of browning in mushrooms during storage was quantified using a colorimeter, and the results are shown in Fig. 4. For each mushroom variety, the pileus and stipes were separated, and the color values of each part were measured. For the pileus of EG2020, the initial (L, a, b) values were (92.85±0.45, 0.12±0.09, and 10.78±0.58) and did not change significantly during storage. For the stipe of EG2020, L (94.49±0.72) did not change significantly, while a decreased from 0.07±0.06 to −0.01±0.14 and b increased slightly from 6.77±0.91 to 7.41±1.09 on day 42. For the pileus of H6, L (93.49±0.75) did not change significantly, while a decreased slightly from 0.01±0.09 to −0.04±0.10 and b increased slightly from 9.84±0.91 to 11.21± 1.36 on day 42. For the stipe of H6, L (93.71±1.24) did not change significantly, while a decreased slightly from 0.06±0.07 to −0.14±0.09 and b increased from 7.93±1.53 to 9.07±0.85 on day 42. Finally, for the pileus of HKT, L decreased from 92.32±1.11 to 88.18±2.41, a decreased slightly from 0.30±0.15 to −0.10±0.60, and b increased from 12.08±1.30 to 15.63±1.23 on day 42. For the stipe of HKT, L decreased from 94.81±0.14 to 91.77±1.50, a decreased from 0.14±0.09 to −0.32±0.23, and b rose from 7.79±0.44 to 11.49±0.82 on day 42. HKT showed the greatest color change among the three varieties.
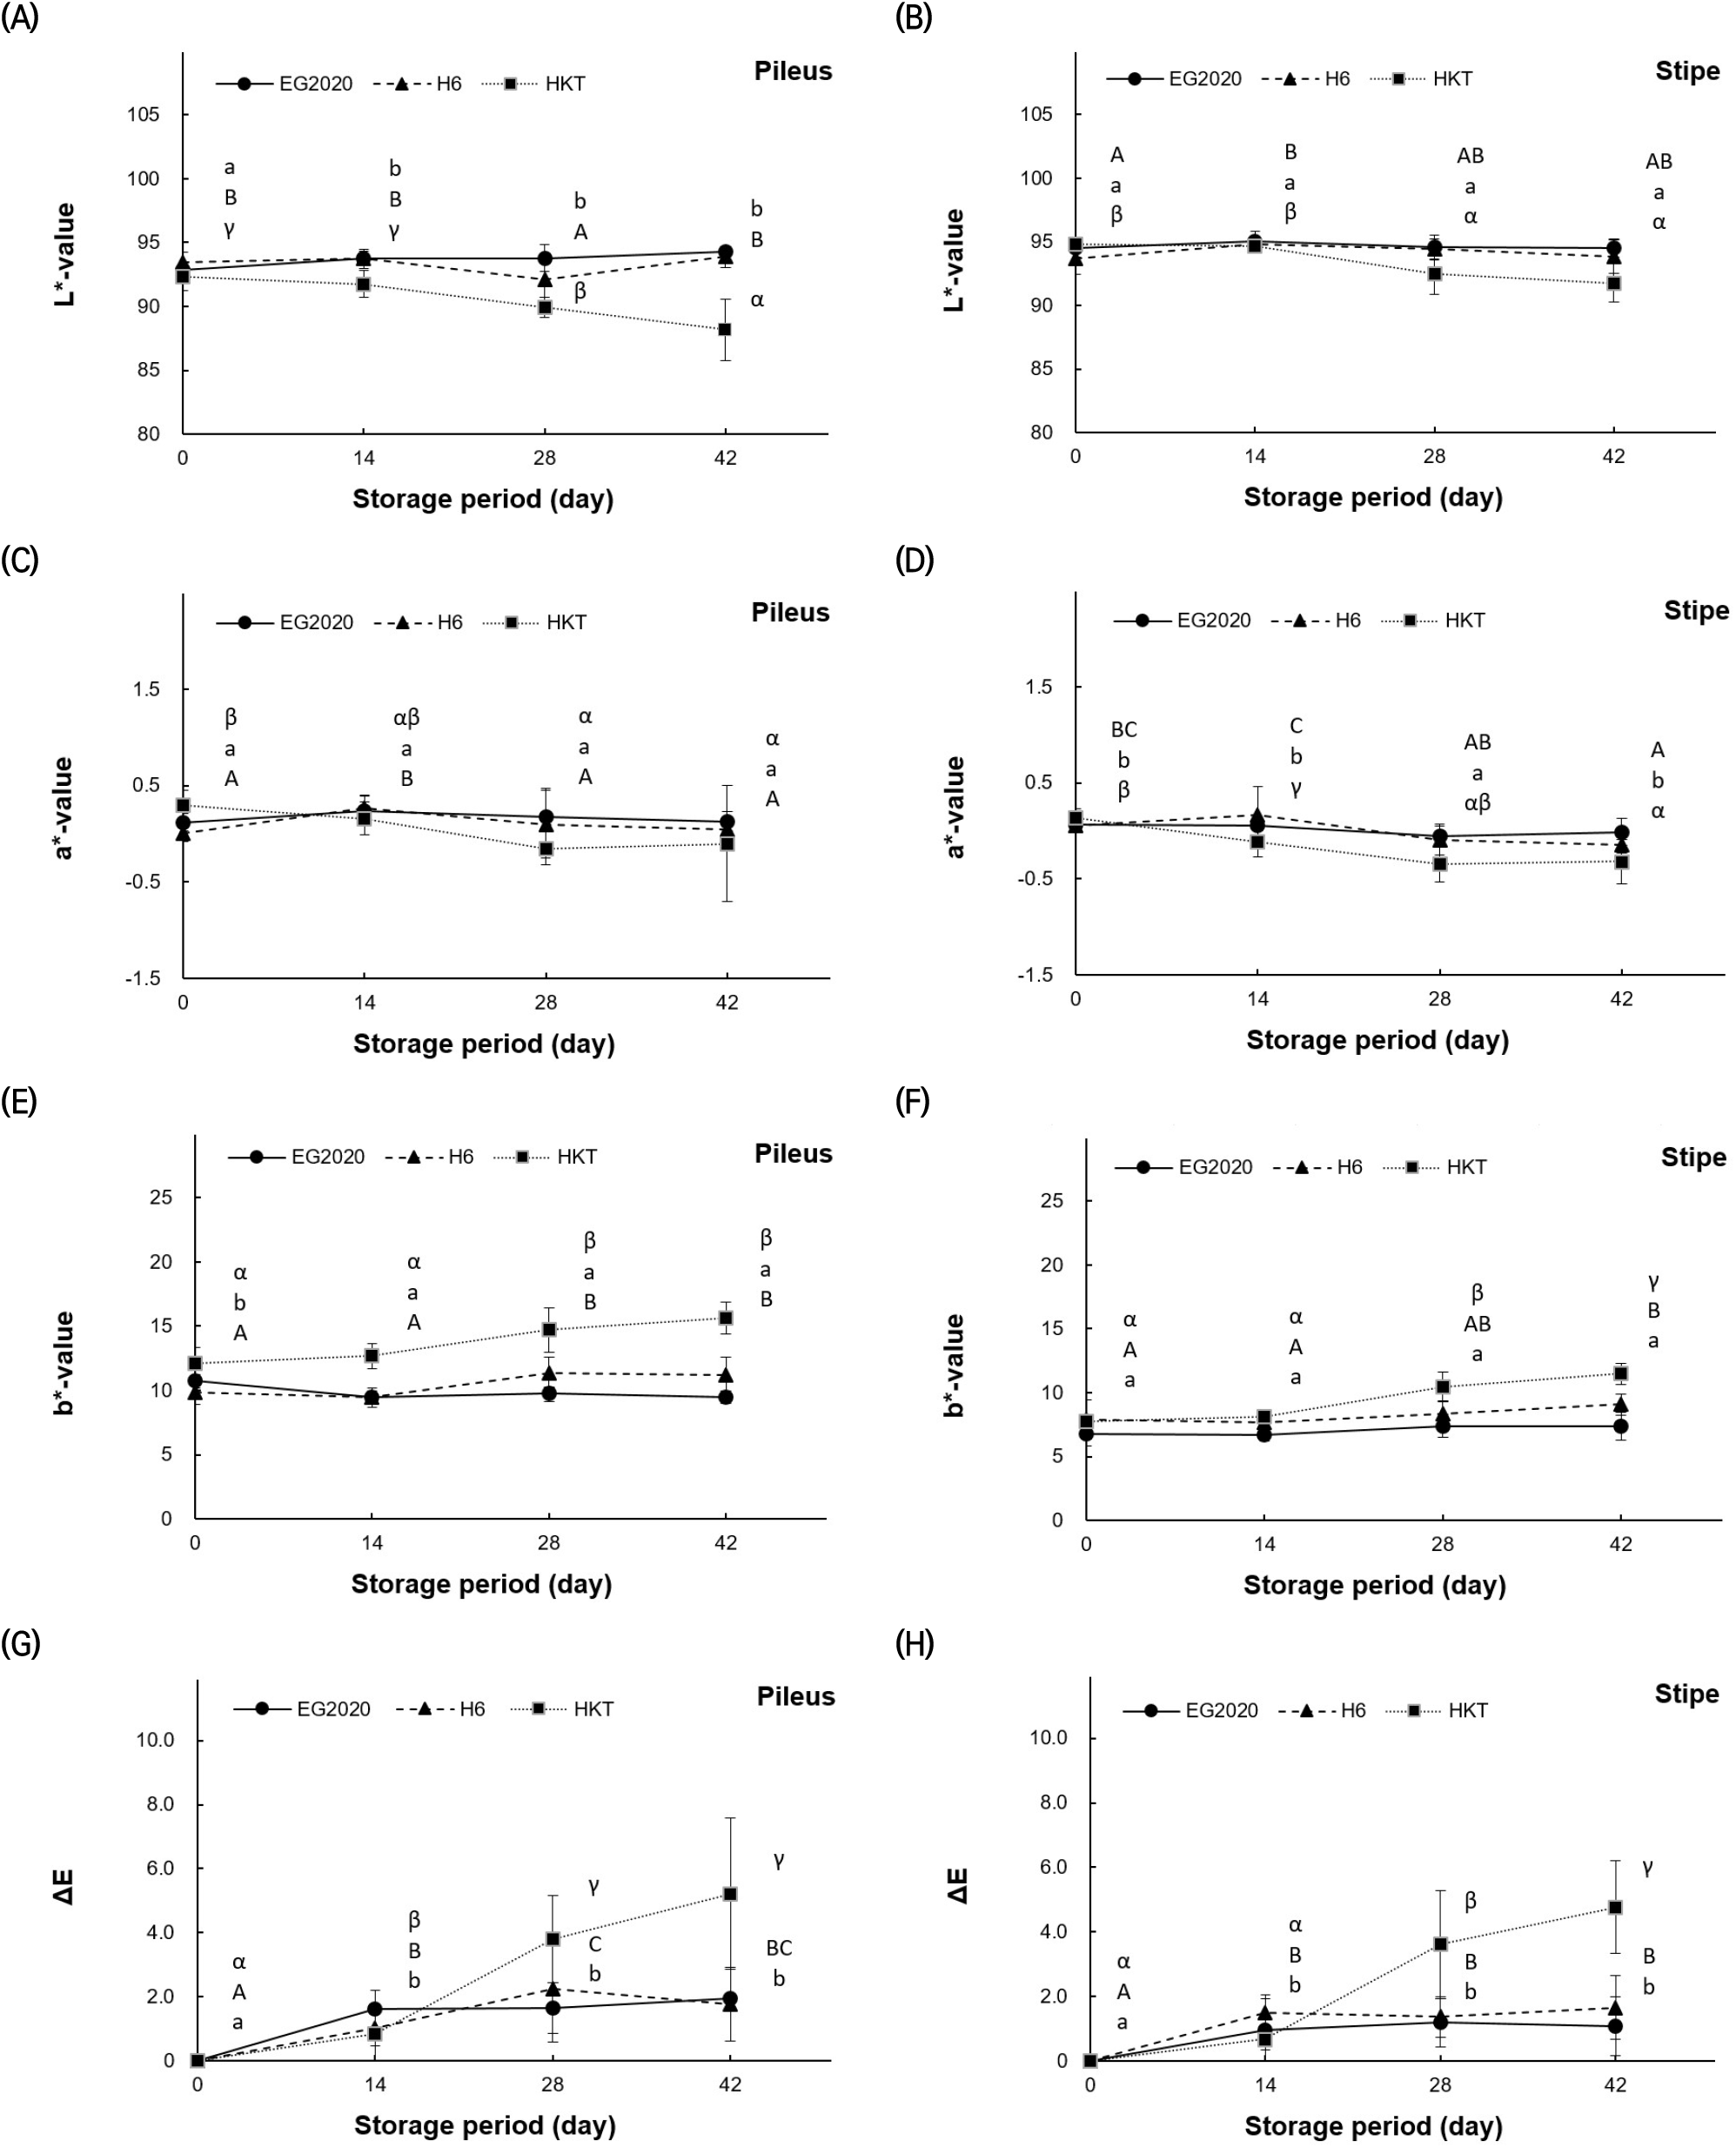
Color difference (ΔE) for the pileus over the storage period (from baseline to day 42) was the smallest for H6 (1.76±1.15), followed by EG2020 (1.95±0.53) and HKT (5.22±2.35). ΔE of the stipe was the smallest for EG2020 (1.08±0.91), followed by H6 (1.66±0.99) and HKT (4.77±1.44). Hence, the ΔE values also support that HKT shows the most browning among the three varieties.
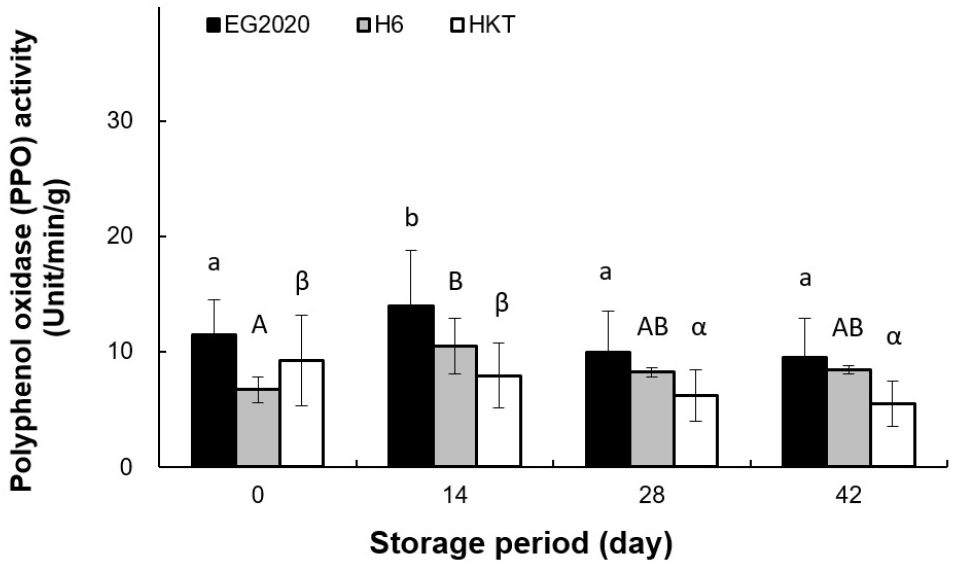
The browning of mushroom surface can be attributed to non-enzymatic browning caused by chemical changes as well as enzymatic browning caused by the PPO enzyme (Martinez and Whitaker, 1995). The PPO activity of three white H. marmoreus varieties was measured over the storage period, and the results are shown in Fig. 5. Among the three varieties, EG2020 had the highest initial PPO activity (11.43±3.10%), which increased to 13.94± 4.81% on day 14, followed by a decrease after day 28 H6 showed a slight increase in PPO activity from 6.72±1.12% on day 0 to 10.47±2.37% on day 14, followed by a decrease after day 28. On the other hand, HKT showed a decreasing trend in PPO activity, from 9.23±3.92% on day 0 to 5.47±1.93% on day 42. The color change and PPO activity in white H. marmoreus varieties showed opposite trends. Burton et al. (1993) reported that enzymes and phenolic compounds exist in different cellular compartments, and that color change occurs when they react with each other after cell membranes collapse due to aging after harvesting. Murr and Morris (1974) also reported that discoloration progressed even when the PPO activity was suppressed. We speculated that that the new variety EG2020 shows slower browning despite having a higher PPO activity than H6 and HKT due to its slower aging process.
pH changes in the mushroom varieties over the storage period are shown in Fig. 6(A). The three varieties had similar pH values on day 0 (6.20±0.02 for EG2020, 6.17±0.05 for H6, and 6.21±0.07 for HKT). During storage, the pH decreased but the trend depended on the time and variety. In the case of EG2020, it changed very little from day 0 to day 14 but then decreased to 6.02±0.02 on day 28 and 5.86±0.08 on day 42. In the case of H6, the pH rapidly decreased from 6.17±0.05 on day 0 to 5.84±0.04 on day 14 and 5.73±0.02 on day 42. HKT showed very small pH changes from day 0 to day 14 (6.14±0.06) and day 28 (6.15±0.04), but dropped dramatically afterwards to reach 5.91±0.02 on day 42.

Changes in saccharinity of the three mushroom varieties over the storage period are shown in Fig. 6(B). Saccharinity on day 0 was the highest for EG2020 (0.5±0.00 °Brix), followed by H6 (0.47± 0.05 °Brix) and HKT (0.40±0.00 °Brix), indicating that the new variety EG2020 has the highest soluble solid content. For EG2020, saccharinity decreased to 0.44±0.05 °Brix on day 42. For H6, it slightly increased to 0.50±0.00 °Brix on day 28 but decreased again to 0.46±0.05 °Brix on day 42. For HKT, it increased to 0.63±0.05 °Brix on day 28 and decreased to 0.52±0.04 °Brix on day 42. These results show that throughout storage, the new variety EG2020 and existing Korean variety H6 maintained a consistent level of saccharinity, which is correlated to the umami taste.
Free sugar content affects the sweetness and flavor of white H. marmoreus.Table 3 shows the changes in free sugar content over the storage period. On day 0, the total sugar content was the highest for EG2020 (4,779 ppm), followed by H6 (1,717 ppm) and HKT (1,688 ppm). Throughout storage, all three varieties showed a marked increase in free sugar content. EG2020 reached the highest value on day 28 (11,274 ppm), which was nearly halved by day 42 (5,257 ppm). In the other two varieties, the initial free sugar content was very low. However, the sucrose content changed substantially during storage, leading to an increased free sugar content. In the case of H6, the free sugar content rapidly rose from 1,717 ppm on day 0 to a peak value of 8,348 ppm on day 14, and then slowly decreased to 7,865 ppm on day 28 and 6,724 ppm on day 42. Similarly, HKT showed a rapid increase in free sugar content from 1,688 ppm on day 0 to 6,693 ppm on day 14, peaking at 6,809 ppm on day 28, and then decreasing rapidly to 3,408 ppm on day 42. The composition of free sugars was similar among the three varieties. The sucrose content was the highest, followed by fructose. Given that the new variety EG2020 displayed the highest free sugar content throughout the storage period, it should display the strongest sweet.
The flavor of mushrooms is also affected by the organic acids. Here, we monitored the organic acid content over the storage period, and the results are shown in Table 4. H6 had the highest total organic acid content (1,445-3,592 ppm), while its level was similar between EG2020 (1,566-2,784 ppm) and HKT (1,590-2,494 ppm). During the storage period, the total organic acid content generally decreased with time. The composition of free amino acids varied among the three mushroom varieties. In EG2020, the most abundant organic acid was malic acid, which gives a smooth and refined acidic taste, and the percentage of succinic acid, which produces umami, was also high. In H6 and HKT, malic acid was also the most abundant organic acid, but acetic acid, which produces a tangy sour taste, became the second-most abundant one soon after harvest. These results suggest that consumers are likely to favor the new EG2020 variety due to its sweet, refined sour taste and umami flavor.
It is generally known that mushrooms with a higher free amino acid content also taste better (Xu et al., 2007). In this study, we compared the changes of free amino acid content in the three varieties of white H. marmoreus over the storage period. As shown in Table 5, HKT had the highest total amino acid content on day 0 (23.37 mg/mL), but it decreased over time to reach 19.49 mg/mL on day 42. H6 also showed a decrease in total amino acid content from 18.35 mg/mL on day 0 to 17.07 mg/mL on day 42. In contrast, after a decrease from 18.15 mg/mL on day 0, EG2020 showed a higher total amino acid content on day 42 (18.49 mg/mL). Furthermore, all three varieties contained all the essential amino acids except for tryptophan.
We also analyzed the contents of glutamic acid and aspartic acid that produce the umami flavor. On day 0, HKT had the highest glutamic acid content (4.93 mg/mL) and aspartic acid content (1.72 mg/mL). However, the glutamic acid content decreased markedly over the storage period. H6 and EG2020 also showed a similar pattern of decline in these two amino acids associated with umami.
Next, we compared the changes in the contents of amino acids that produce a bitter taste. EG2020 had the highest arginine content both on day 0 (1.31 mg/mL) and day 42 (1.76 mg/mL). The relative abundance of these amino acids in EG2020 was ranked as valine > leucine > phenylalanine > tyrosine > isoleucine > histidine > methionine. Most bitter-tasting amino acids tended to become enriched during storage in all three varieties. Park et al. (2011) reported that H. marmoreus contains a total of 17 amino acids. Particularly, they found relatively high percentages of glutamic acid, serine, arginine, and leucine, in agreement with our study.
β-Glucan is the classic useful ingredient of mushrooms. Fig. 7(A) compares the β-glucan content in the three white H. marmoreus varieties during storage. The new variety EG2020 had the highest β-glucan content, being 28.53±0.68 g/100 g on day 0 and 6.28±2.07 g/100 g on day 42. The β-glucan content of H6 was 25.53±0.27 g/100 g on day 0 and 26.43±0.19 g/100 g on day 42, while that of HKT was 24.8±0.02 g/100 g on day 0 and 10.31±5.19 g/100 g on day 42. The trend of β-glucan content with time differed among mushroom varieties, increasing in EG2020 and decreasing markedly in HKT.
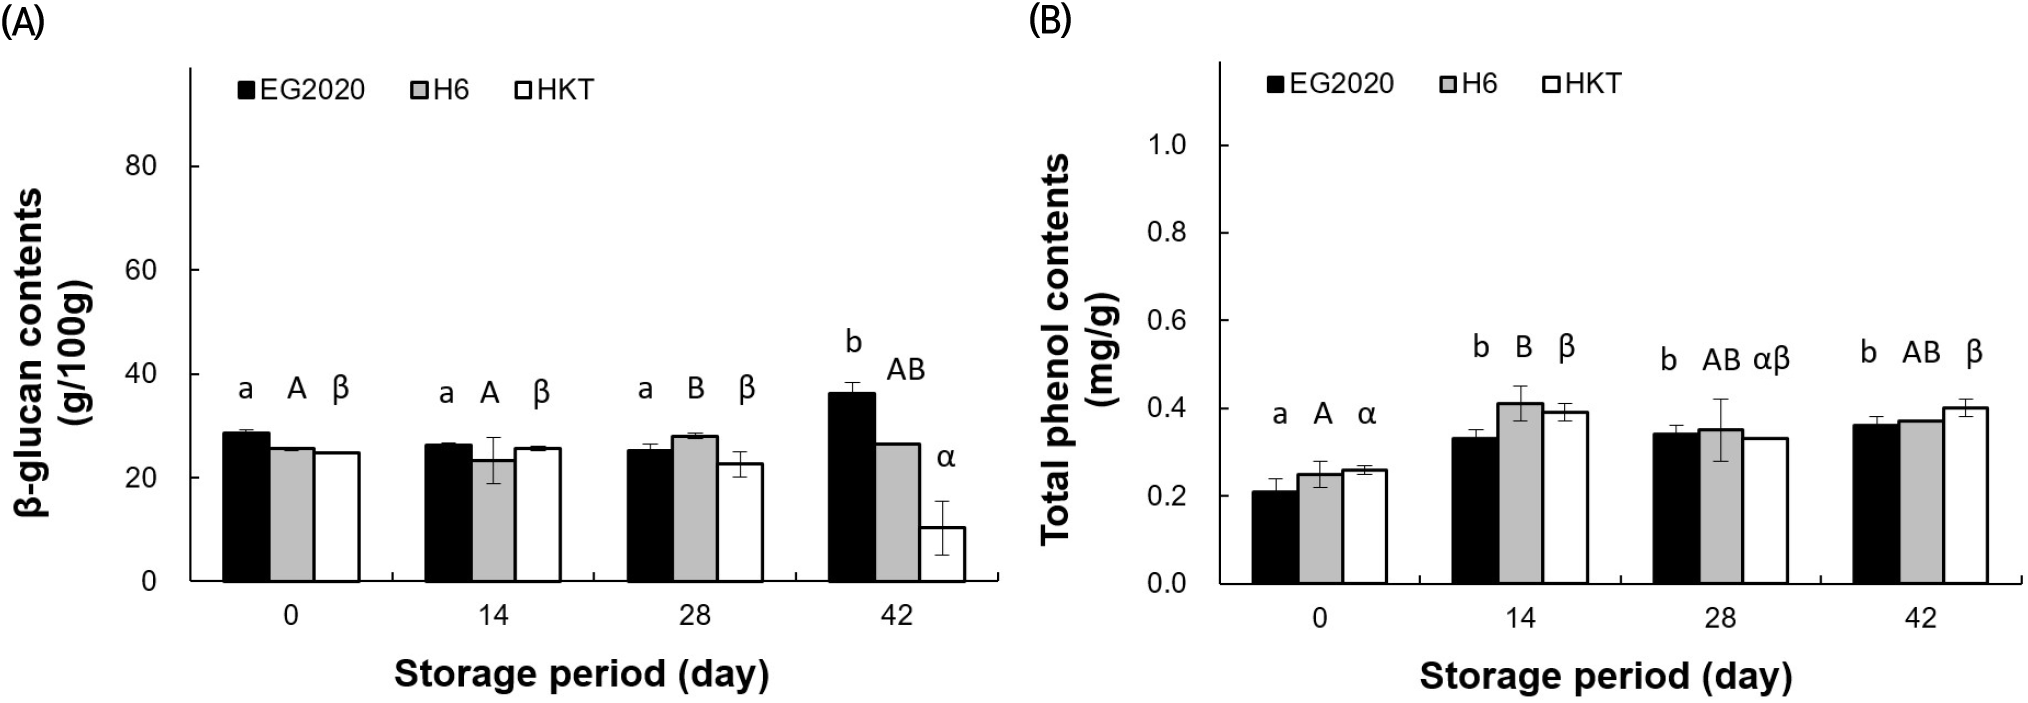
The TPC values of three mushroom varieties during storage are shown in Fig. 7(B). On day 0, TPC was ranked as HKT > H6 > EG2020. Moreover, it increased over the whole storage period: from 0.26 ±0.01 mg/g on day 0 to 0.40±0.02 mg/g on day 42 in HKT, from 0.25±0.03 to 0.37±0.00 mg/g in H6, and from 0.21±0.03 to 0.36±0.02 mg/g in EG2020. The TPC values on day 0 were lower than those of wild mushrooms (0.391-1.725 mg/g) reported by Ferreira et al. (2009). However, the trends of change over the storage period were similar across the varieties.
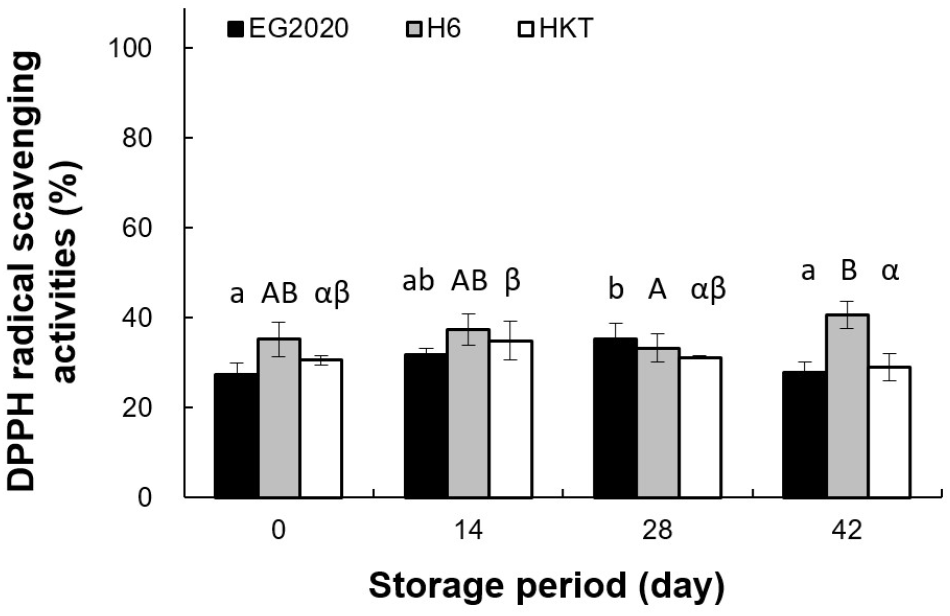
DPPH radical scavenging activities of the three white H. marmoreus varieties over the storage period are shown in Fig. 8. On day 0, H6 had the highest activity (35.19±3.90%), followed by HKT (30.56±1.00%) and EG2020 (27.29±2.76%). The changes of DPPH radical scavenging activity during storage depended on the variety. For EG2020, it increased slightly until day 28 but decreased by day 42. For H6, it increased continuously during the storage period. For HKT, it increased until day 14 but slowly decreased through day 28 and 42. Choi et al. (2017) reported that the DPPH radical scavenging activities of extracts from two other edible mushroom species, Lentinula edodes and Agaricus Bosporus, declined continuously during low-temperature storage. These results suggest that the antioxidant properties of white H. marmoreus can be preserved by controlling the duration of low-temperature storage.
Palatability evaluation was performed to compare the sensory qualities of EG2020 with a Japanese variety currently marketed in Korea (HKT). As shown in Table 6, EG2020 has a markedly higher overall palatability than HKT (4.23±1.21 vs. 3.76±1.68) as well as a higher flavor rating (4.42±1.04 vs. 4.10± 0.98). However, EG2020 also has a higher off-flavor rating, suggesting that the volatile aromatic ingredients in this new variety are sensed more strongly. In terms of taste, EG2020 is rated higher in terms of sweetness than HKT (3.97±1.62 vs. 3.45±1.56). Aftertaste, the taste that remains in the mouth after swallowing, is rated slightly higher for EG2020 than HKT (4.32± 1.51 vs. 3.61±1.68). In terms of appearance, EG2020 is rated very favorably in color compared to HKT (5.42±1.36 vs. 4.97±1.40) and also more favorably in shape. In terms of texture, EG2020 was perceived as slightly softer than HKT (3.26±1.48 vs. 3.55± 1.19) but with a slightly higher chewiness (3.90± 1.78 vs. 3.84±1.32). The sensory evaluation results show that the new EG2020 variety has superior palatability compared to HKT in terms of flavor, taste, appearance, and texture. Cho et al. (2001b) reported that while the marketability of mushrooms is affected by nutritional and physiochemical properties, consumers rate mushrooms based on their sensory palatability. Hence, we expect consumers to welcome EG2020 once it becomes available on the market.
4. Summary
The storage and distribution of fresh mushrooms are impaired by their vulnerability to browning and undesirable texture changes over time. In the present study, we compared a new variety of white H. marmoreus (EG2020) with two commercially available varieties (H6 from Korea and HKT from Japan). The appearance, physiochemical quality indicators, nutritional components, and functional ingredients were monitored during cold storage for up to 42 days. Our results revealed no marked changes in pileus appearance and stipe texture in all three varieties even after 42 days. Although the new variety EG2020 had slightly smaller pileus sizes compared to H6 and HKT, the clusters contained substantially more pilei and stipes, leading to a more compact growth form as well as a higher overall weight. In terms of mechanical texture, the pilei of EG2020 tended to increase in hardness during storage compared to the other two varieties.
Hence, EG2020 is expected to have a better ability to survive storage and transportation. Color change (indicated by ΔE) of the pileus over time was ranked as H6 (1.76±1.15) < EG2020 (1.95±0.53) < HKT (5.22±2.35), while that of the stipes was ranked as EG2020 (1.08±0.91) < H6 (1.66±0.99) < HKT (4.77 ±1.44). Overall, HKT showed the most serious browning among the three varieties. All three varieties showed a declining pH value and consistent saccharinity over the storage period. Free sugar contents affect the sweetness and flavor of foods, and the new variety EG2020 had the highest total free sugar content. In addition to its high saccharinity, EG2020 was also found to contain abundant organic acids that produce a refined sour taste and umaminess. These results suggest that the new variety EG2020 should be well accepted by consumers due to its improved flavor. EG2020 also had the highest β-glucan content that increased over the storage period. Finally, a sensory evaluation was performed to compare the palatability of EG2020 and HKT. EG2020 was given the highest rating in all evaluated aspects, namely the flavor, taste, appearance, and texture, further supporting that this new mushroom variety should have good overall acceptability.

