1. Introduction
Rhus verniciflua (R. verniciflua), commonly known as lacquer trees, belongs to the family Anacardiaceae. The tree is native to Tibet and the Himalayas, which are the highlands of Central Asia. It is cultivated in Asian countries, including Korea, China, Japan, and Vietnam. There are approximately 600 species worldwide, with approximately 200 species belonging to the genus Rhus. Of the 200 Rhus species, seven are found in South Korea (Lee et al., 2004; Lim et al., 2019). The bark of R. verniciflua is dark gray, the leaves are ovate or oval, and the flowers are yellow-green, small, and densely bloomed. The fruit is a small, yellow, spherical drupe, 6-8 mm in diameter (Felsenstein, 1985; Wang and Zhu, 2017a). R. verniciflua contains urushiol and flavonoids such as fustin, fisetin, sulfurretin and chalcone (Chen et al., 2017; Jang et al., 2005; Lee et al., 2004. Urushiol has been reported to have strong anti-cancer and antioxidant activity.
However, this compound is known to act as a foreign antigen and triggers an immune response causing severe skin allergy and has side and toxic effects that cause dermatitis, mania, and respiratory failure (Gladman, 2006). For these reasons, only the xylem and stems can be used as a food source on a limited basis. Various physiological activities, such as anti-cancer and antioxidant studies (Kwak et al., 2005; Park et al., 2000), anti-mutagenic effects (Park et al., 2004), and anti-thrombotic effects (Jeon et al., 2006) have been reported in R. verniciflua application studies. In addition to functional studies, studies on the reduction of urushiol for use as food have also been reported (Baek et al., 2015; Baek et al., 2016; Choi et al., 2012; Choi et al., 2013); however, most studies have focused on the xylem.
In addition to research on xylem, studies on fermented milk and tea beverages prepared by adding R. verniciflua seeds have been conducted (Jin et al., 2016; Jin et al., 2017) but these studies were insufficiently detailed compared to those on xylem. Therefore, this study provides basic data on R. verniciflua by analyzing its proximate components, mineral components, urushiol, total polyphenols, and total flavonoids in its various components. Additionally, based on the derived data, we aimed to identify the parts that could be used as food materials.
2. Materials and methods
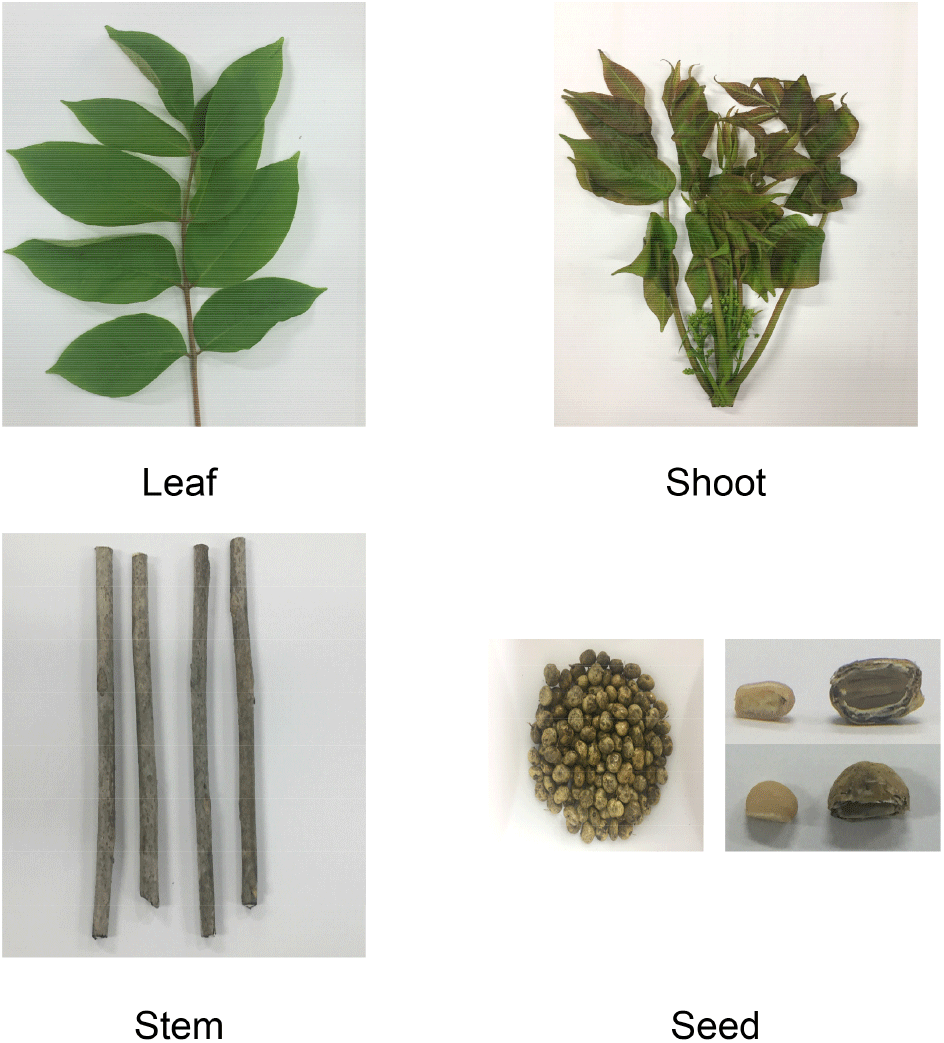
The leaves, shoots, stems and seeds of the R. verniciflua variety used in this study were collected from Imsil-gun, Jeollabuk-do, Korea (Fig. 1). The details of the sample collection are as follows: the seeds were collected in October 2016; the leaves were ovate or oval, and the pointed part was collected in May 2017; the shoots were collected in May 2017 from the stems and the part including the young branches and leaves growing on it; the stems were collected in May 2017. The seeds were extracted after removing the outer and middle skin of the fruit. All Samples were freeze-drying. All the chemical reagents, including 1,1-diphenyl-2-picrylhydrazyl (DPPH), 2,2-azino-bis-(3-ethylbenzothiazoline-6-sulfonic acid), and diammonium salt (ABTS), were of analytical grade, and all reagents used in this study were purchased from Sigma-Aldrich (St. Louis, MO, USA).
The cells used in this study were Raw 264.7 cells, a macrophage cell line derived from BALB/c mice, purchased from the Korea Cell Line Bank (KCLB, Seoul, Korea). Dulbecco’s modified Eagle’s medium (DMEM), fetal bovine serum (FBS), penicillin-streptomycin, and PrestoBlue reagent was purchased from Invitrogen (Carlsbad, CA, USA).
Proximate analysis was conducted according to the AOAC method (AOAC, 1990) as follows: moisture was determined in an air oven at 105°C; crude protein was determined by the Kjeldahl method with a conversion factor of 6.25; crude fat was determined by the Soxhlet extraction method; crude fiber was determined by the H2SO4-NaOH decomposition method; and the carbohydrate amount was determined by calculating the difference.
The samples for mineral analysis were prepared according to the Food Code (MFDS, 2018a) and analyzed by ICP-OES (iCAP 6000series ICP spectrometer, Thermo Scientific Co., Loughborough, UK). The flush and analysis pump rate was 45 RPM, the nebulizer and auxiliary flow rate was 0.5 L/min (Ar). the wavelengths (nm) were Fe, 238.204; K, 766.490; Mg, 279.553; Mn, 257.610; and Na, 588.995. The content was expressed using an external standard method.
Urushiol was analyzed using high-performance liquid chromatography (HPLC, Waters Alliance e2695, Waters Co., Milford, MA, USA) according to the Food Code (MFDS, 2018b). The column used was an ACQUITY UPLC® BEH C18 column (ID 2.1×50 mm, 1.7 μm; Waters Co., Milford, MA, USA). The column temperature was maintained at 60°C. The eluents used were 0.1% trifluoroacetic acid (TFA) in water (A) and acetonitrile (B) at a flow rate of 0.2 mL/min. The gradient was as follows: 0 min, 10% B; 5 min, 10% B; 20 min, 95% B; 27 min, 95% B; 29 min, 10% B; 30 min, 10% B. The injection volume was 10 μL and the detection wavelength was 276 nm (Waters 2489 UV/visible detector, Waters Co., Milford, MA, USA). The content was expressed using an external standard method.
Total polyphenol content was analyzed according to the Folin–Denis method (Folin and Denis, 1912) using a UV–VIS spectrophotometer (Libra s22, Biochrom, Cambridge, UK). Polyphenols were extracted from the samples by boiling them under reflux after the addition of 70% ethanol. The extract was mixed with 2 mL of Folin–Ciocalteu reagent and 5 mL of 10% Na2CO3. The mixture was incubated for 1 h at room temperature, and the absorbance was measured at 660 nm. The total polyphenol content was expressed as milligrams of gallic acid per gram. The total flavonoid content was determined by extracting the samples under reflux after the addition of methanol. The extract was mixed with 10 mL of diethylene glycol and 1 mL of 1N NaOH. The mixture was incubated at room temperature for 1 h, and its absorbance was measured at 420 nm (Lee et al., 2001). The total flavonoid content was expressed as mg quercetin per gram.
Seed extracts were prepared by adding 100 mL of 0%, 30%, 50%, 70%, and 100% ethanol to 10 g of R. verniciflua seeds triturated with a homogenizer. This was followed by extraction by stirring and leaching at room temperature for 24 h, followed by filtration with Whatman filter paper grade 2. The extraction filtrate was concentrated under reduced pressure using a rotary vacuum evaporator (NE-1001; EYELA, Tokyo, Japan) at 37°C in a water bath, and was thereafter freeze-dried.
DPPH radical scavenging activity was measured using the Blois method (Blois, 1958). Briefly, the samples to be tested (100 μL) were added to 150 μL ethanolic DPPH (0.3 mM). The reaction mixtures were shaken vigorously and maintained at an indoor temperature for 30 min in the dark. Absorbance was measured at 530 nm using a spectrophotometer (Libra s22, Biochrom, Cambridge, UK).
The ABTS radical scavenging activity was measured according to the method described by Re et al. (1999). ABTS radical cation was prepared by mixing equal volumes of 7 mM ABTS solution and 2.45 mM potassium persulfate. The mixture was incubated for 24 h at room temperature in the dark to yield a dark-colored solution containing ABTS radicals, which was then diluted with distilled water to an absorbance of 0.7±0.02 units at 630 nm. Extracts (100 μL) were allowed to react with 100 μL ABTS solution for 30 min in the dark until the absorbance stabilized. The reduction in absorbance at 630 nm was measured using a spectrophotometer (Libra s22, Biochrom, Cambridge, UK).
The RAW 264.7 cells were cultured in DMEM containing 10% FBS and 1% penicillin-streptomycin. Subculture was performed every three days at 37°C in a 5% CO2 incubator, and the cell passage number was 10 or less.
The PrestoBlueTM reagent was used to examine the toxicity of the sample to RAW 264.7 cells. The assay was performed according to the manufacturer’s instructions. First, cells in suspension were seeded at 1×10⁵ cells/mL in a 96-well microtiter plate and cultured for 24 h in DMEM without FBS. Subsequently, the cells were treated with the 50% ethanol R. verniciflua seed extract (0-1,000 μg/mL) and were further cultured for 24 h at 37°C in a 5% CO2 incubator, thereafter 10 μL of PrestoBlueTM reagent was added. After a 20 min reaction time, the absorbance was measured at 570 nm (reference 600 nm) using a microplate reader (MRX tc, DYNEX Inc., Chantilly, VA, USA). Cytotoxicity was expressed as a percentage relative to the untreated cells.
3. Results and discussion
The results of the analysis of the proximate compositions revealed that the leaves mainly contained carbohydrate (42.70%), the shoots crude protein (37.05%), and the stems and seeds crude fiber (73.33% and 51.01%, respectively) (Table 1). With regards to the shoots and leaves, the amount of crude protein decreased, and crude fiber increased as the trees grew. This is consistent with the report of Kim et al. (2005), who found that crude protein decreased and crude fiber increased depending on the time at which the leaves of Camellia japonica L. were harvested. Maisuthisakul et al. (2008) reported the highest carbohydrate and protein content in leaves of Spondias pinnata Kurz, which belongs to the Anacardiaceae family, and Choi et al. (2012) reported that for Kalopanax pictus N sprouts, the protein content was highest, excluding moisture. This corresponded to the results of the proximate components of the leaves and shoots in this study. Choi et al. (2010) reported the moisture, crude fat, protein, ash, and sugar content of the proximate components of R. verniciflua stem bark. Excluding the reported content, the crude fiber content was 71.12%, which was consistent with the crude fiber content determined in this study. Wang and Zhu (2017b) reported that carbohydrates (31.57-48.00%) and crude fiber (32.90%) were the highest in R. typhina fruits. This report was similar to the seeds in this study, but showed a difference in content. This is considered to be the result of the use of seeds whose skin was peeled off, rather than the whole fruit used in this study, along with the differences in species.
The minerals in all components of the tree consisted mainly of potassium (1,193.50-2,617.08 mg/100 g) and magnesium (172.10-262.46 mg/100 g) (Table 2). These results were consistent with those in previous reports, in which both the seeds and shoots of sorghum and the leaves and stems of Albizzia julibrissin were reported (Chun et al., 2017; Lee et al., 2010) to have the highest levels of potassium and magnesium. In addition, Hwang et al. (1997) reported potassium and magnesium concentrations of 477.6 mg/100 g and 73.6 mg/100 g in the bark of R. verniciflua, respectively. The results of previous reports and this study are in approximate agreement in terms of the major mineral components, but differ with respect to concentrations. This difference is attributed to differences in the area, climate, soil, and analysis methods.
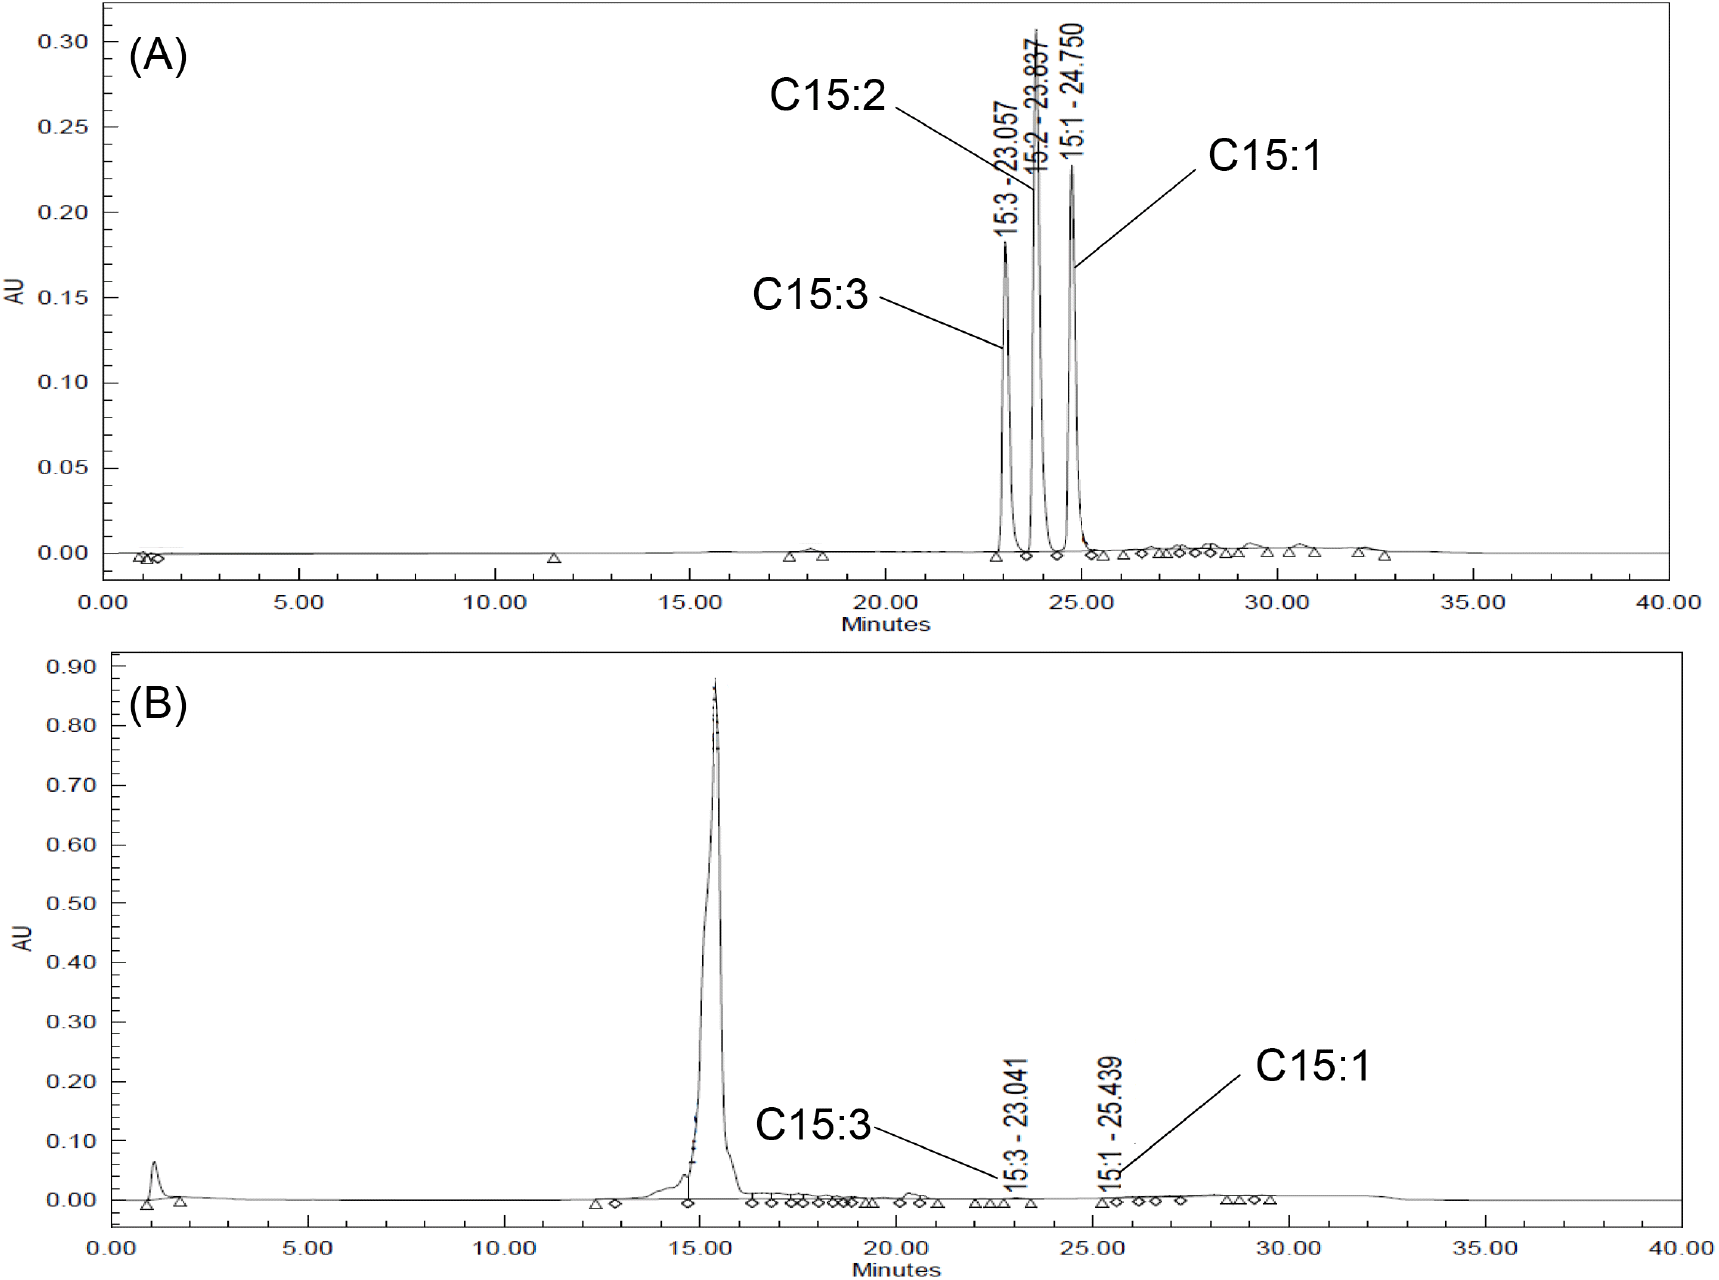
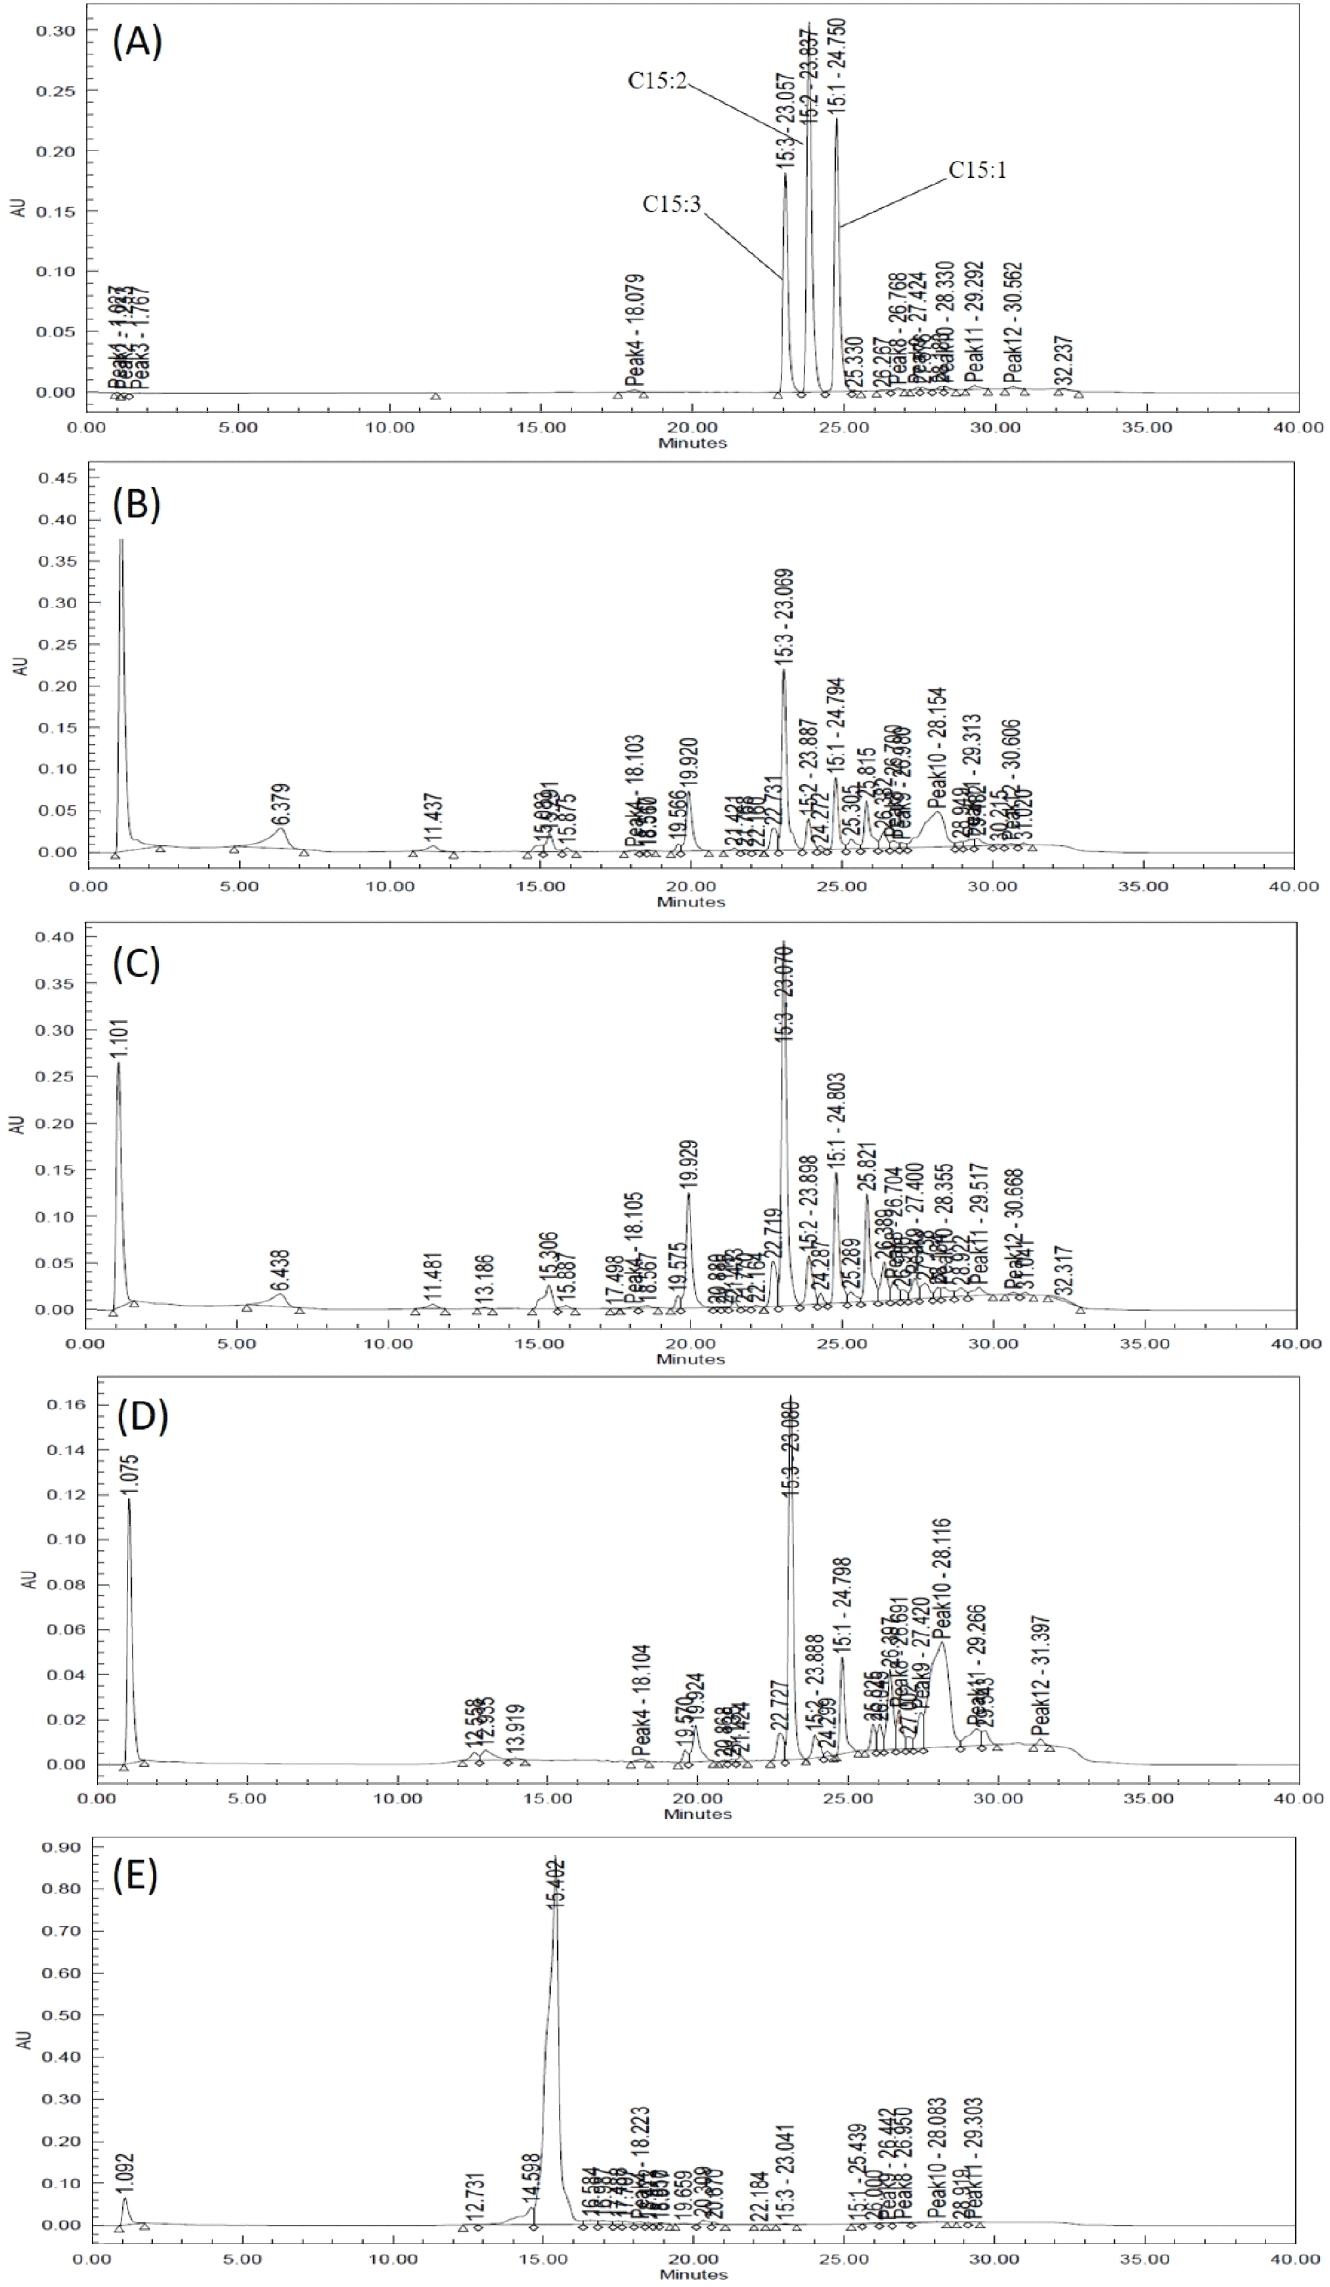
The total urushiol content was measured to be 239.90 mg/100 g, 263.01 mg/100 g, 184.65 mg/100 g, and 0.92 mg/100 g in the leaves, shoots, stems, and seeds, respectively (Table 3, Fig. 2). The ratios of pentadecenyl catechol (C15:1), pentadecadienyl catechol (C15:2), and pentadecatrienyl catechol (C15:3) were 18-22%, 0-7%, and 70-82%, respectively. Lee et al. (2015) reported that the total urushiol content of R. verniciflua bark was 55.05-56.30 mg/100 g, and that the C15:3 ratio was the highest at 63%. This reported content was lower than that in this study, but the C15:3 ratio was similar. Choi et al. (2007) reported that the urushiol content of R. verniciflua bark was 1,045.3 mg/100 g, which was higher than that of this study. In fact, the previously reported contents differed considerably, even for samples collected in the same region. This suggests that the content varies according to the season and cultivation environment. Therefore, the difference in urushiol content between the previous report and this study may have been influenced by the cultivation environment, collection time, and pre-treatment of the samples.

The total polyphenol content was 163.80 mg GAE/g, 413.14 mg GAE/g, 73.36 mg GAE/g, and 55.63 mg GAE/g in the leaves, shoots, stems, and seeds, respectively. The total flavonoid content was 8.16 mg QE/g, 6.12 mg QE/g, 2.50 mg QE/g, and 2.30 mg QE/g in the leaves, shoots, stems, and seeds, respectively (Fig. 3). The initially high polyphenol and flavonoid contents of the shoots and leaves reportedly decrease as growth proceeds, with the former decreasing more rapidly than the latter (Cho et al., 2018; Im et al., 2013). Lee et al. (2011) reported that the polyphenol content of mulberry tree leaves was higher than that of the stems. Kim et al. (2003) reported that the analysis of polyphenol and flavonoid content of safflowers showed that the seeds contained lower levels of these two components than the shoots, leaves, and stems. The results of the present study were similar to these reports. Polyphenol and flavonoid contents are known to vary according to growth and harvest times, as well as environmental and genetic factors (Hrichi et al., 2020). For this reason, it is necessary to study the variation in its content according to the factors that influence it. The results of this study indicate that the seed component with a significantly lower urushiol content, which is known to be a harmful component of R. verniciflua, may be safe for use as a food material. Therefore, the conditions for extracting the R. verniciflua seed component were explored and cytotoxicity assessments were carried out.

Fig. 4 shows the results of the DPPH and ABTS scavenging activities of the extracts according to the ethanol concentration of the R. verniciflua seed component extract. The DPPH and ABTS radical-scavenging activities of the extracts varied between 38.94% and 62.18% and between 43.96% and 67.18%, respectively, according to the ethanol concentration of R. verniciflua seed component extract. The DPPH and ABTS radical scavenging activities increased as the concentration of ethanol, the extraction solvent, increased. In particular, the activity differed significantly for ethanol concentrations from 0 to 50%, but there was no significant difference at higher concentrations. The results of this study were consistent with those of previous reports (Koh et al., 2005; Lee and Kwon, 2006) that the activity of the seed extraction solvent was higher in ethanol than in water. Therefore, an ethanol concentration of 50% was deemed suitable for the extraction of R. verniciflua seed components.

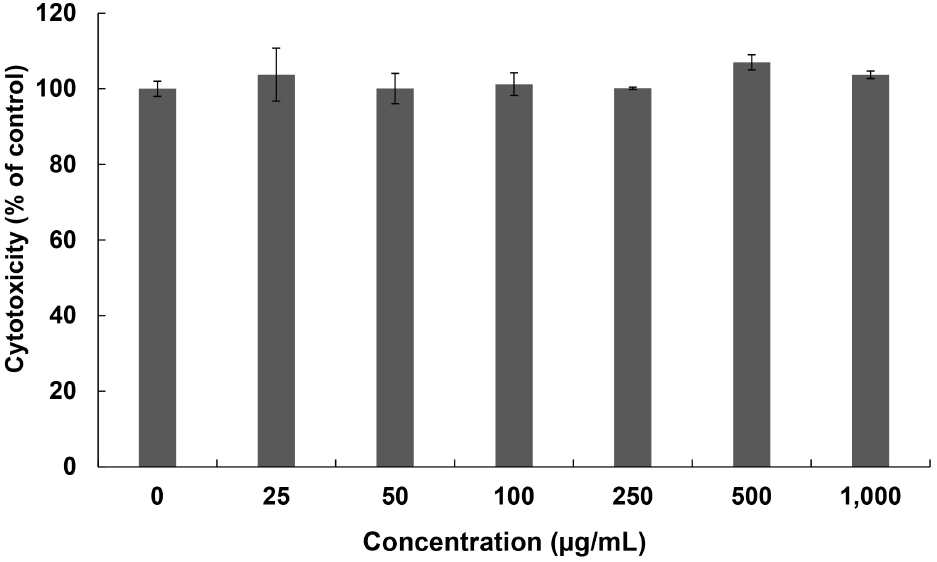
Fig. 5 shows the results of the cytotoxicity results using the 50% ethanol extract of the R. verniciflua seeds. The results of the extraction with 50% ethanol at concentrations of 0, 25, 50, 100, 250, 500, and 1,000 μg/mL, were found to be 100.00%, 103.73%, 100.06%, 101.23%, 100.13%, 107.01%, and 103.70%, respectively. This confirmed that cytotoxicity did not occur at any concentration.

4. Conclusions
The goal of this study was to provide basic data for various parts of Rhus verniciflua (R. verniciflua), and based on these data, to suggest the parts thereof that could be used as food materialization along with the xylem. The proximity components, mineral components, urushiol, total polyphenols, and total flavonoids included in various components of R. verniciflua were analyzed, and the conditions for extracting the seeds component were explored and cytotoxicity measurements were carried out. The results of this study confirmed that the seeds of R. verniciflua contained low levels of urushiol, and did not show cytotoxicity, especially the 50% ethanol extract. Our findings are expected to provide useful basic data regarding the use of seeds of R. verniciflua as food materials.


