1. Introduction
Soft and non-alcoholic malt drinks exist in various forms and brands, and are produced and marketed by different brewing industries across Nigeria and internationally (Obuzor and Ajaezi, 2010). These drinks are readily consumed on daily basis especially, when undergoing tedious activities like hard work or sport. Also with their relatively affordable prices, they are highly consumed during leisure and relaxation outings, and used to serve the general public in celebrations such as traditional marriages, weddings, parties, naming ceremonies, child dedication, funerals etc. Soft drinks which are called “soft” in contrast to ‘Hard drinks’ contain small amounts of alcohol or none, but the alcoholic content must be less than 0.5% of the total volume (Pune, India – February 14, 2019). According to Lugasi and Hovari (2003), soft drinks are a group of non-alcoholic beverages useful to quench thirst in a pleasant way, and contain some useful compounds like vitamins, saponins, polyphenols, etc, with antioxidant properties. They usually contain carbonated water, a sweetener and a natural or artificial flavour. The sweetener may be sugar, high fructose corn syrup, fruit juice, a sugar substitute (like honey) or a combination of these. Soft drinks may also contain ingredients like colourants, preservatives, nutrients etc. Some amount of alcohol may be present in a soft drink, but its content must be less than 0.5% of the total volume of the drink in many countries or localities. Examples of these soft drinks available in Nigeria include Coke, Fanta, Sprite, La Casera, Pepsi, 7up, Fayrouz etc. They are packaged in many container types including cans, glass bottle and plastic bottles of different sizes ranging from small bottles to large multi litre containers.
In addition to thirst satisfaction, soft drinks contain other constituents such as vitamins, phosphate and acids, which are of nutritional and health value (Maurice, 2010). The major ingredients in the production of soft drinks are water, liquid sugar, flavour concentrates, citric acid which can either be in the form of powder or syrup. These are mixed in their various proportions in the water tank to for a perfect mixture. The water tank is sterilized with ultraviolet radiation or by flash pasteurization (quick heating and cooling of water) to eliminate bacteria that may be present in the sugar or flavor. To prevent air absorption, manufacturers often mix their ingredients inside a chamber that is pressurized with carbon (IV) oxide. The water-based mixture is finally carbonated at the exact cold temperature of the liquid. This is followed immediately with packaging and sealing of containers to preserve the carbon pressure in the liquid mixture, and concluded with labeling.
Non-alcoholic malt drinks on the other hand, are drinks whose worts are prepared from barley and cereal adjuncts without fermentation. Thus, it is produced by dissolving wort granulates in water, filtration and addition of pure hop aroma followed by carbonation (Kamil, 2003). Malt drinks have a lot of health benefits such as protection against coronary heart diseases, cancers and ulcers (Bamfort, 2002). Some of the popular brands in Nigeria include Malta Guinness, Amstel Malt, Maltina, Hi Malt, Grand Malt, Dubic Malt, etc.
Soft and non-alcoholic malt drinks are widely distributed at fast food restaurants, movie theatres, shops, supermarkets, hotels, clubs etc., and freely available at festivals, child dedication ceremonies, weddings, funerals, birthday parties and other celebrations (Bamfort, 2002). Historically, non-alcoholic malt drinks were used as food for children and the sick because it has a lot of health benefits such as protection against coronary heart disease, cancers, and ulcers (Bamfort, 2002). The manufacturers of these malt drinks have found inventive ways of breathing new life into old time brands by updating the products, making them appealing to new consumers. The most vibrant strand of growth may lie within the market for non-alcoholic malt drinks in the Middle East, Muslim populations in the West and some Christian groups that forbid the drinking of alcohol (Livonen and Parthington, 2007). In Nigeria, they have now turned out to be the drink preferred in most social gatherings for health or religious belief. The products for the manufacturing process of non-alcoholic malt drink are malt, sugar and hops. The production generally is by dissolving wort granulates in water, filtration and adding pure hop aroma, followed by carbonation (Kamil, 2003; Lommi and Ahvenainen, 1997). There are many ways to improve the taste of non-alcoholic malt drinks and higher levels of hops (Murray and Van der Meer, 1997).
Temperature is known as one of the factors affecting chemical or biochemical reactions whether natural or synthetic. According to Johnson et al. (2013), analysis of the effect of Nigerian market storage conditions on ascorbic acid, titratable acidity and pH values of selected packaged citrus fruit juice were carried out from three months to ten months from the day of production, and the results showed that there was gradual decrease in ascorbic acid contents and pH values with increase in storage period irrespective of the brands. Definitely, the change in the ascorbic acid content and pH was related to the change in the storage temperature. The vitamin C content in fresh orange juice showed different values at different temperatures and shelf life, 39.75±1.000, 23.00±1.520 and 31.50±1.000 mg/100 mL for fresh, boiled and a week shelf life, respectively (Davey et al., 2000). Murcia et al. (2000) carried out a study and reported that the fresh watermelon juice shows a different vitamin C content at different temperatures and shelf lives which are 27.5±1.250, 16.70±1.420 and 21.63±1.625 mg/100 mL, for fresh, boiled and a week shelf life, respectively. Heat and water reduce vitamin C content, cooking reduce the vitamin C content in fruit juice because vitamin C is sensitive to heat, water and air. Rickman et al. (2007) have also reported that the rate at which vitamin C content decreases in fresh tomato juice shows different values at different temperature and shelf life which are 19.13±1.630, 10.83±2.600 and 15.63±0.625 mg/100 mL for fresh, boiled and a week shelf life, respectively. All these studies point to the fact that changes in storage or environmental temperature affects the quality of different malts and fruit juices.
It is an established fact in science that increases in temperature affects the rate of chemical and biochemical reactions. Besides, several researches have been carried out on the effect of different temperatures on the vitamin C content of many fruit juices namely; orange juice, watermelon juice, tomato juice, etc. in different parts of the world (Davey et al., 2000; Murcia et al., 2000; Rickman et al., 2007) as cited earlier. However, the problem is that many of these drinks are produced, distributed, consumed and preserved anyhow possible in Nigeria without the knowledge of the effect of storage temperature on the quality and potency of the drinks. Many people are only concerned about the expiry date in the label on the drinks as a proof of potency. Besides, there is no evidence in literature of any research study carried out on the effect of temperature on the individual quality requirements or parameters of soft and non-alcoholic malt drinks, in Nigeria. Considering the tropical climate and weather of Nigeria, and Africa in general, environmental temperatures are high most of the time, with average room temperature higher than 25°C and sometimes above 30°C. Therefore, it is possible that decomposition reactions can be initiated among the various ingredient in soft and non-alcoholic malt drinks over time as their storage and environmental temperature rises due to heat absorption and that might affect the quality of these non-alcoholic drinks or beverages. It might also interest one to know that even after the quality regulatory agencies in Nigeria like Standards Organization of Nigeria (SON) and National Agency for Food and Drug Administration and Control (NAFDAC) have tested and certified the quality of these drinks for consumption, they may still decompose and diminish in quality earlier than their expected expiry dates due to poor storage conditions or temperature especially with the epileptic electrical power supply in Nigeria which would have aided preserving these drinks by refrigeration at low temperatures devoid of chemical decomposition.
The purpose of this study is to determine the effect of storage temperature on the quality requirements of soft and non-alcoholic malt drinks sold and consumed in local markets in Nigeria and create awareness to manufacturers and consumers of these products on the effects of temperature on their quality and educate them on the best storage temperature or conditions. Additionaly, we aimed to provide relevant information to the government through its relevant quality regulatory agencies on the effects of storage temperature on the quality of these drinks and the reliability of expiry dates/shelf lives based on the findings, for proper monitoring and evaluation of quality standards of products, and finally, to serve as a reference document for further research or a baseline study.
2. Materials and methods
One of most popular brands each of the soft and non-alcoholic malt drinks bought from a local market in Calabar, Cross River State for the analysis of their quality requirements at 5 different temperatures. The samples were divided into five sets. The first set was conditioned in a water bath at 30°C, others at 35°C, 40°C, 45°C and 50°C, respectively. The equilibration time for each sample was 45 min. All reagents used were of analytical grade (British Drug House (BDH), Poole, England), while the instruments calibrated according to the required procedures. The methods used were based on the Association of Official Analytical Chemists (AOAC, 2005). Some procedures were carried out in Chemistry Department Laboratory, University of Calabar, while some were carried in the Jawaharlal Nehru Centre for Advance Scientific Research, Jakkur, Bangalore, India.
The conditioned samples were for the quality requirements namely; bitterness (EBU), pH, total acidity as citric acid (g/L), ethyl alcohol content (% v/v), original gravity [°Saccharin (% v/v)], ascorbic acid content (mg/L) and sugar content (% v/v) at temperatures of 30°C, 35°C, 40°C, 45°C and 50°C, respectively. These quality requirements were compared with Nigeria Industrial Standards for soft drink (NIS 217, 2008), malt drinks (NIS 290, 2013), National Science Education Standards 2005, FAO/ INFOODS Databases in Nigeria 2018 respectively.
Bitterness was measured using UV-VIS spectrophotometer at 275 nm according to European Brewery Convention (EBC) method. The apparatus used include a Centrifuge 800-B, a 6800 UV/VIS spectrophotometer (JENWAY) and thermostat water bath HH-6. Procedure: 5 mL of the sample (degassed by shaking), 0.5 mL of 3 M HCl and 10 mL of iso-octane were measured into a centrifuge tube and shaken vigorously for 15 minutes and centrifuge at 3,000 rpm for 3 min to separate the phases and break the emulsion. After separation of phases, the isooctane phase was carefully decanted and allowed to stand in the dark for 30 min and the clear supernatant was immediately transferred into a quartz cell and the absorbance measured at 275 nm in the UV-visible spectrophotomer (AOAC 970.16, 2005).
A pH meter with glass electrode (Uniscope PHS-3E pH meter, Surgifriend Medicals, England) was used. Reagents used were buffer 4.0 and 7.0 solutions and distilled water. Procedure: 100 mL of the sample was transferred into clean beaker rinsed severally with distilled water and lastly the sample. The calibrated pH meter was then inserted in the sample and pH reading recorded (AOAC 945.10, 2005).
Reagents used were 0.1 M NaOH and phenolpthalein indicator. Procedure: 10 mL of 1 in 100 dilution of the sample was poured into a conical flask and 3 drops of phenolphthalein indicator were added and titrated with 0.1 M NaOH solution in the burette to an end point (AOAC, 2005). Total titrable acid as citric acid in 1 mL of 0.1 M NaOH = 0.0064 g citric acid.
A total of 250 mL of sample was collected and poured in the 500 mL round bottom flask. The condenser was connected between the round bottom flask and the 250 mL conical flask. Bumps were added to the sample to avoid breakage or spillage. The sample was heated and the distillate collected at 78°C boiling point. After cooling, it was poured into a 100 mL measuring cylinder. The alcoholmeter was inserted into the sample in the cylinder and readings were taken and recorded (AOAC, 2005).
The materials used include a weighing balance, density bottles and distilled water. Procedure: the specific gravity (relative density) which is same as the final gravity was determined by dividing the weight of a certain volume of the sample in the density bottle by the weight of the same volume of distilled water in density bottle (EBC, 2018).
The original gravity was obtained using the formula:
where OG is the original gravity, FG is the final gravity and ABV is the ‘alcohol by volume’ which is equal to ethyl alcohol (%v/v). It is expressed as °Saccharin (%v/v).
The reagents used were 1.0 M H2SO4, 1% starch indicator, 0.05 N iodine and distilled water. Procedure: 50 mL of distilled water was added to 2.5 mL of 1.0 M H2SO4 acid in 250 mL conical flask. 5 mL of the sample was added to the flask, followed by 5 mL of 1% starch indicator and then mixed properly. 0.05 N solution of iodine in the burette was used to titrate the solution to a pale black end point (BP, 2003).
The ascorbic acid concentration was obtained from the formula below.
This was achieved using a refractometer (OPTi Digital Handheld Refractometer, UK). Procedure: 2 drops of the sample were deposited at the optical surface of the meter. The lower part of the observed bluish colour was read and recorded (AOAC 935.64A, 2005).
Three replications of the experiment were carried out for each measured value and the data reported as the mean±standard deviation (SD) or standard error (SE), with n=3. SPSS version 20 (IBM Corp.,) software was used to carry out significant test on the data obtained from experimental procedure at p⟨0.05, while Origin 5.0 (Origin Lab Corp.) software was used to carry out regression analysis on the data to ascertain the linear relationship between the quality parameters and storage temperature. The significance indication was also stated using small letters of alphabets in the results.
3. Results and discussion
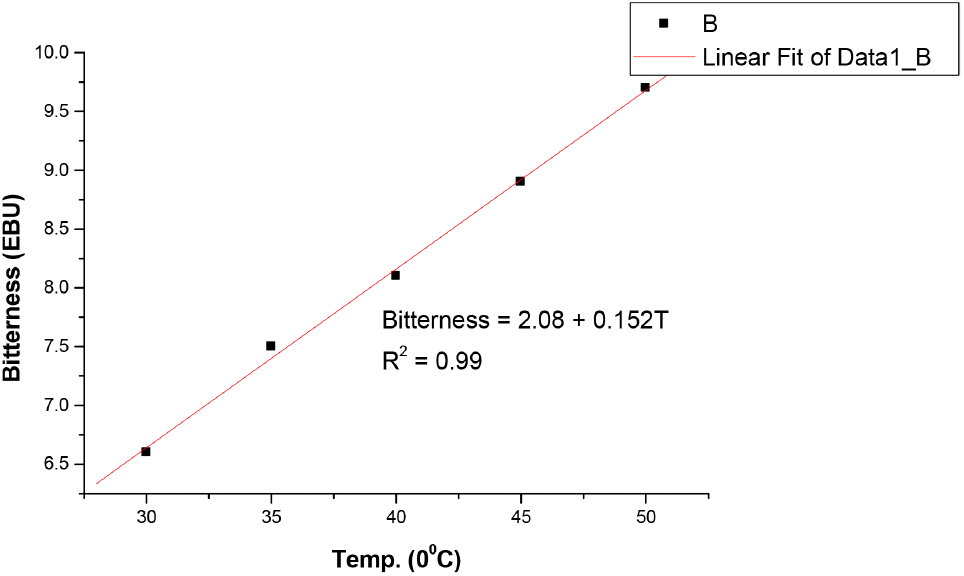
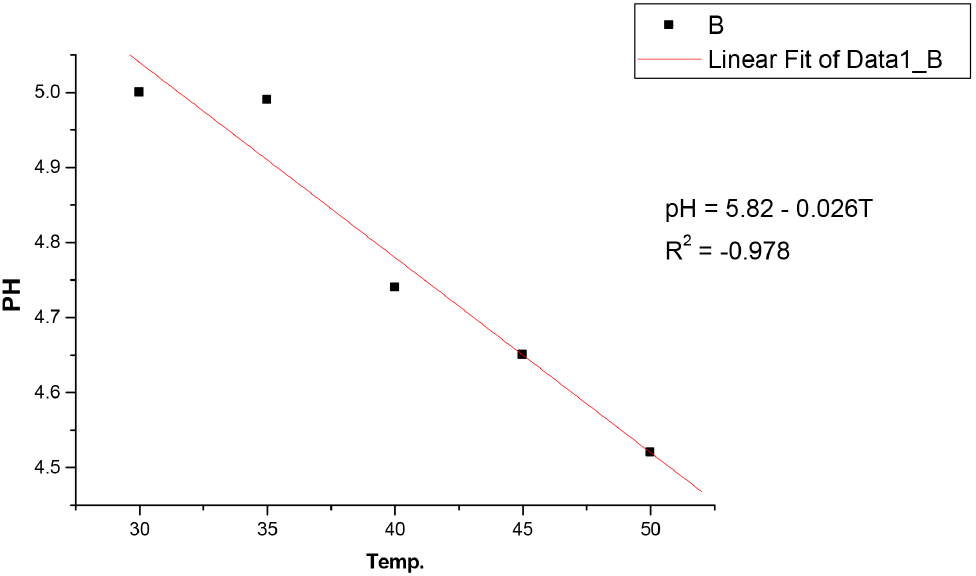
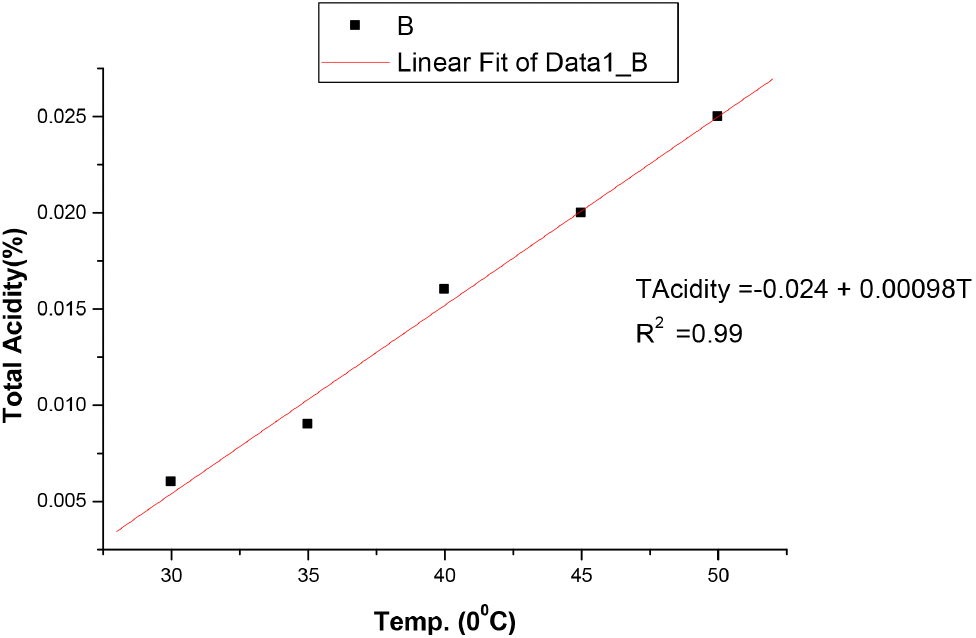
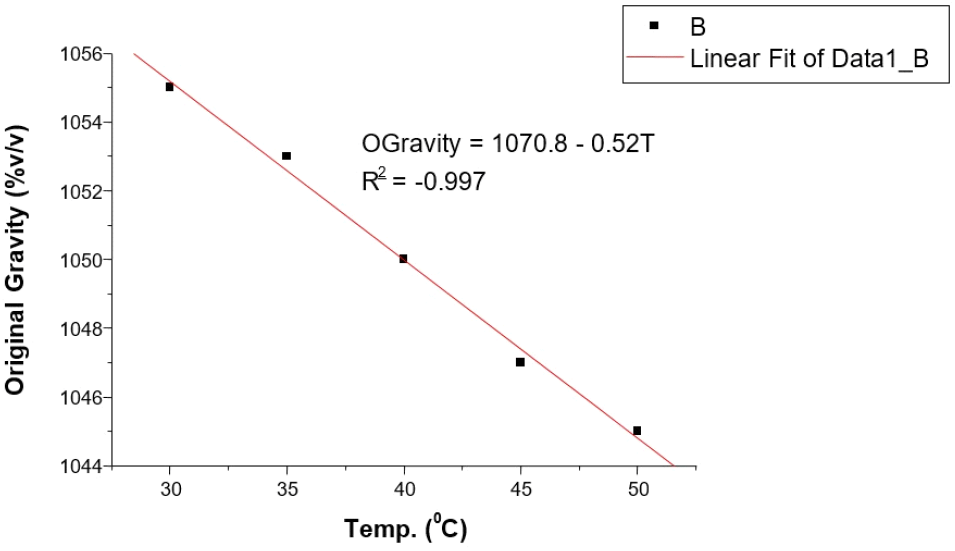
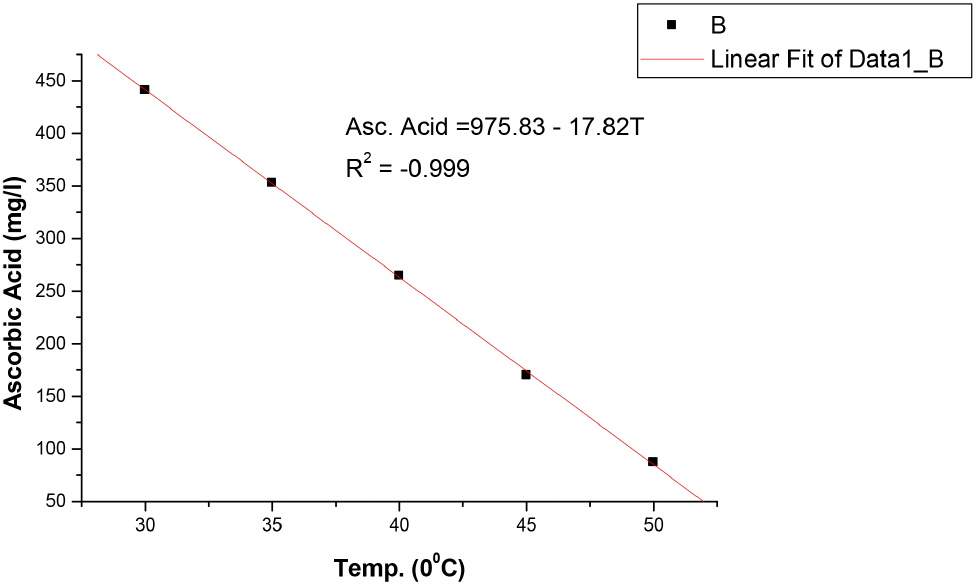
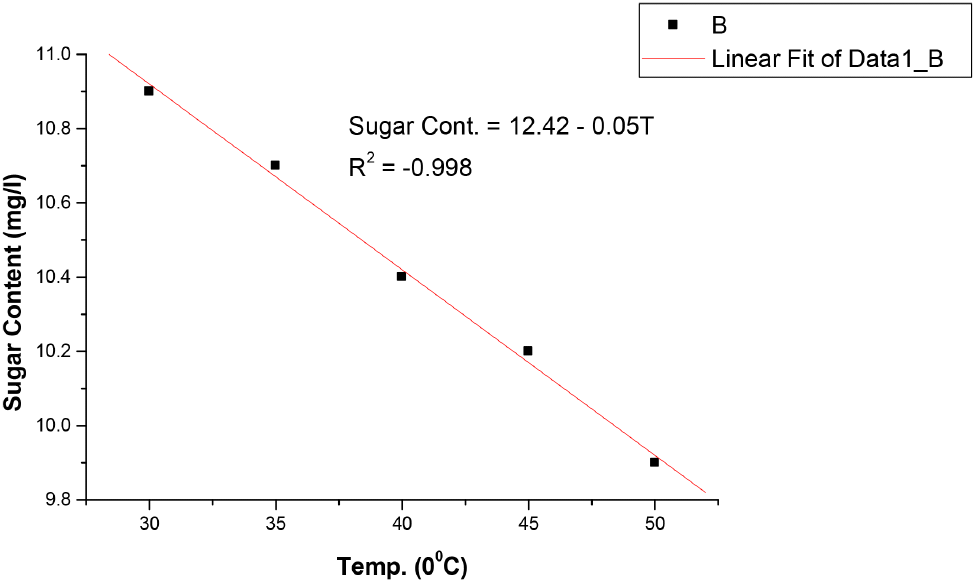
The results of the analysis of the quality requirements soft and non-alcoholic malt drink are presented along with their standards in Tables 1-4. The graphs of the regression analysis carried out using Origin version 5.0 software on the data to show the linear relationship between the different quality requirements or parameters and temperature are presented in Fig. 1 to 6 and Fig. 7 to 12 for soft and non-alcoholic malt drink respectively.
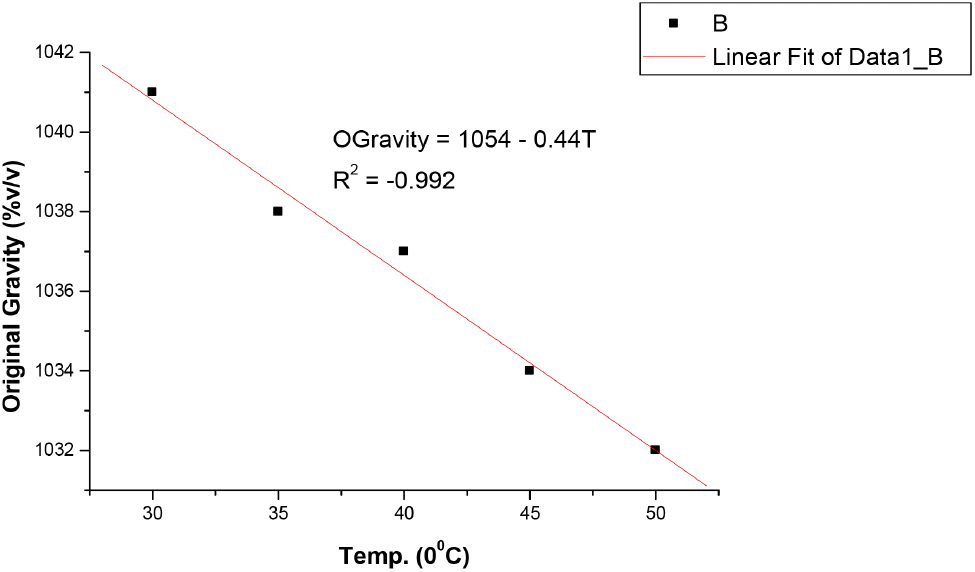
All the following equations indicate a linear relationship between the quality parameters and temperature. Bitterness and total acidity increases as storage temperature increases, while original gravity, ascorbic acid, sugar content and pH decreases as temperature increases.
The results in Table 1 shows that bitterness of the soft drink increases with increase in temperature from 1.27 EBU at 30°C to 1.33 EBU at 50°C. These values were still within the permissible limits of Nigerian Industrial Standards (NIS) as stated in Table 4. The pH also changes with temperature and decrease from 2.99 at 30°C to 2.78 at 50°C, showing a slight increase in acidity as the temperature increases. However, these values were still within the acceptable limit of National Science Education Standards (NSES) for Soft drinks (NSES, 2005). Increase in temperature causes auto-dissociation of more acid molecules in the system, causing the release of more H+ ions leading to increased acidity and decreased pH value. Temperature imparts on pH in two ways by causing dissociation of the sample solution and by altering the performance of the pH electrodes slightly (https//www.techiescientist.com). Temperature is inversely proportional to pH (www.awe-ltd.co.uk). Total acidity is the measure of the total acid content of the drink solution or the total number of hydrogen ions present in a substance in the form of fixed and volatile acids. Citric acid which is the most common acid used in soft drinks production is relevant to NIS 217:2008 because it is an acidifier, flavouring agent, chelating agent and also a preservative in food and beverages like soft and non-alcoholic drinks. The values of total acidity in Table 1 also increased with temperature from 0.014% at 30°C to 0.030% at 50°C, but still within acceptable limits of NIS in Table 2. Ethyl alcohol is a requirement in the standards used to ascertain whether fermentation which is the chemical breakdown of sugars by yeast producing alcohol and carbon dioxide occurred during manufacture of soft and non-alcoholic malt drinks or not. There was no result in Table 1 as the temperature increased from 30°C to 50°C, indicating that no fermentation has taken in the soft drink yet. The results in Table 1 also showed that the original gravity, often called original extract, decreases with increase in temperature from 1,041 °Saccharin (%v/v) at 30°C to 1,032 °Saccharin (%v/v) at 50°C and it still within permissible limits of NIS (see Table 4). Original gravity is the measure of the solids content initially in the wort before fermentation may or may not have commenced. It is relevant in the standards because it indicates the richness of the solids content in the wort, which is the total fermented and unfermented sugar. Ascorbic acid as the precursor of vitamin C, a vitamin found in various foods like citrus fruits, dietary supplement and green vegetables. It is required in the standards as it is essential in maintaining healthy connective tissue and enzymatic production of certain neurotransmitters (Webber et al., 1996). Its values in Table 1 showed that it decreases as the temperature increases, from 116.52 mg/L at 30°C to 6.74 mg/L at 50°C, but still within the acceptable limits of NIS as stated in Table 4. However, these values vary greatly from those reported by Jingyan et al. (2013) and Jutkus et al. (2015) who studied the thermal decomposition of ascorbic acid and effect of temperature and chemical stability of various forms of vitamin C respectively. This could be attributed to the fact that they studied ascorbic acid and vitamin C purely and not in a mixture with other substances or ingredients in a soft drink where there may be interferences and reaction between ascorbic acid and other constituents as the temperature increases to 50°C and above. Also, the form or source of ascorbic acid used in soft drinks could be different from that used in pharmaceuticals. Besides, these results also agree with Sarkar et al. (2021) that studied the effect of drying on vitamins, carotenes, organic acids and minerals content of mango and reported that drying significantly affects vitamin A and C content by a decrease of 20.32-92.69% and 29.94-143%, respectively. This is as a result of the increase in temperature during the drying process and period. The results in Table 1 also revealed that the sugar content of soft and non-alcoholic drinks changes with temperature. The sugar content of the soft drink decreases with increase in temperature from 10.9 mg/L at 30°C to 9.9 mg/L at 50°C but within the permissible limit of NIS (see Table 4). The reduction in sugar content with increase in temperature is due to the breaking down of sugar into simpler ones, followed by dehydration and fragmentation into aldehydes or ketones (ACBI, 2016). The results of the analysis in Table 1 shows that all standard requirements of the soft drink studied though still within the acceptable limit of NIS, change gradually/linearly with increase in temperature, indicating that deterioration of the drink may occur at temperatures of 45°C and above over a long period of storage time. Regression analysis in Fig. 1-6 showed a linear relationship between the quality parameters with storage temperature.
Standards Organisation of Nigeria (SON), 2013.
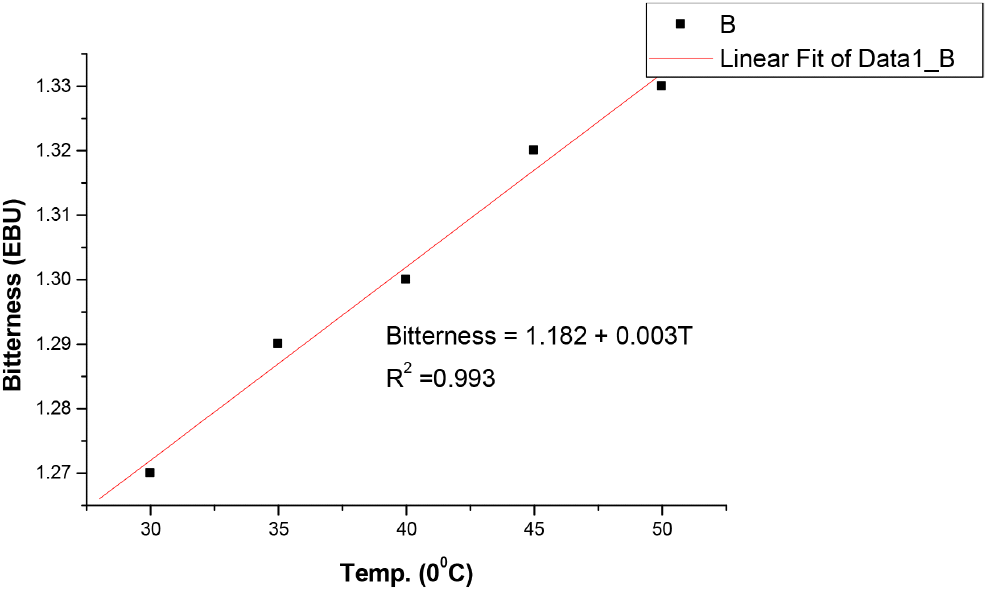
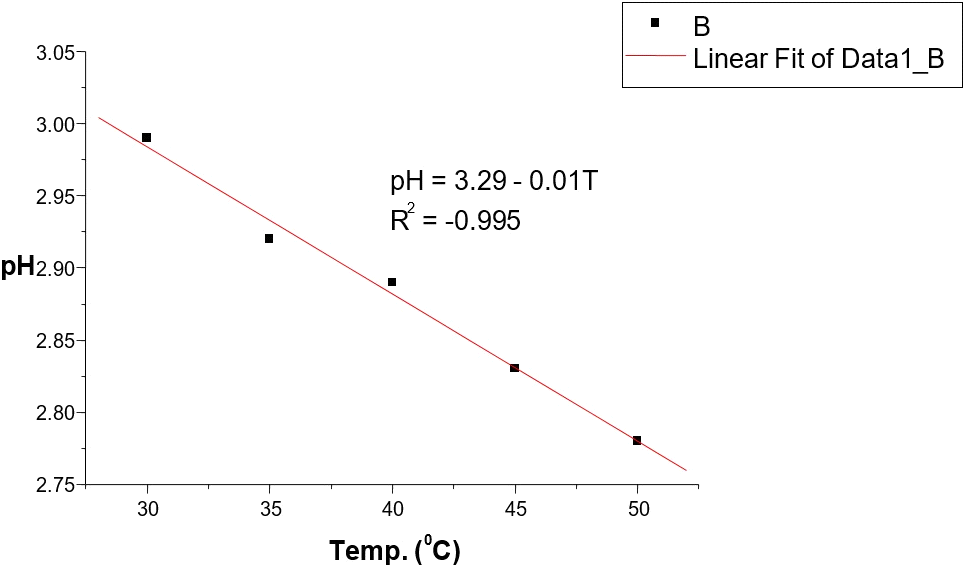
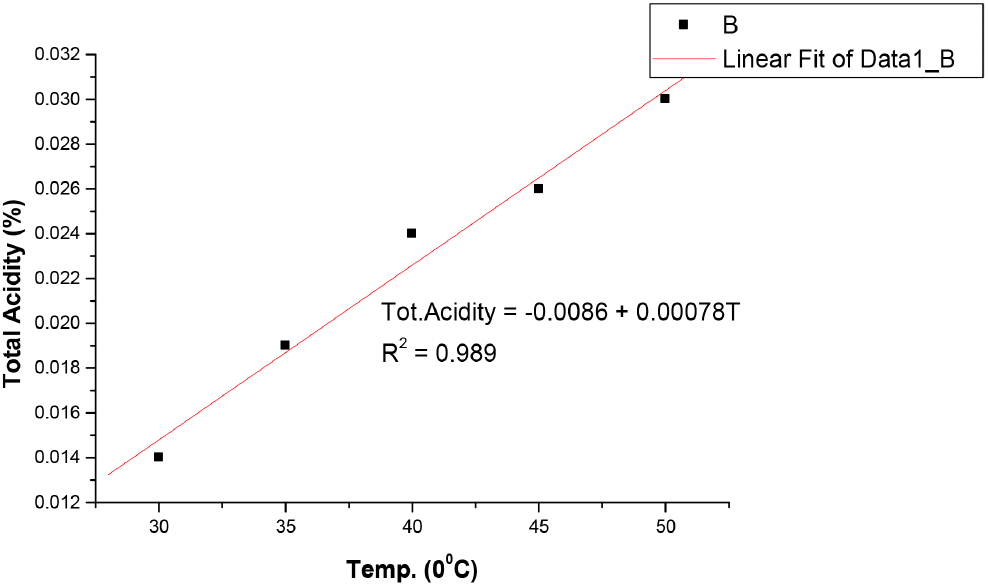
All the following equations indicate a linear relationship with temperature. Bitterness and total acidity increases as storage temperature increases, while original gravity, ascorbic acid, sugar content and pH decreases as temperature increases.
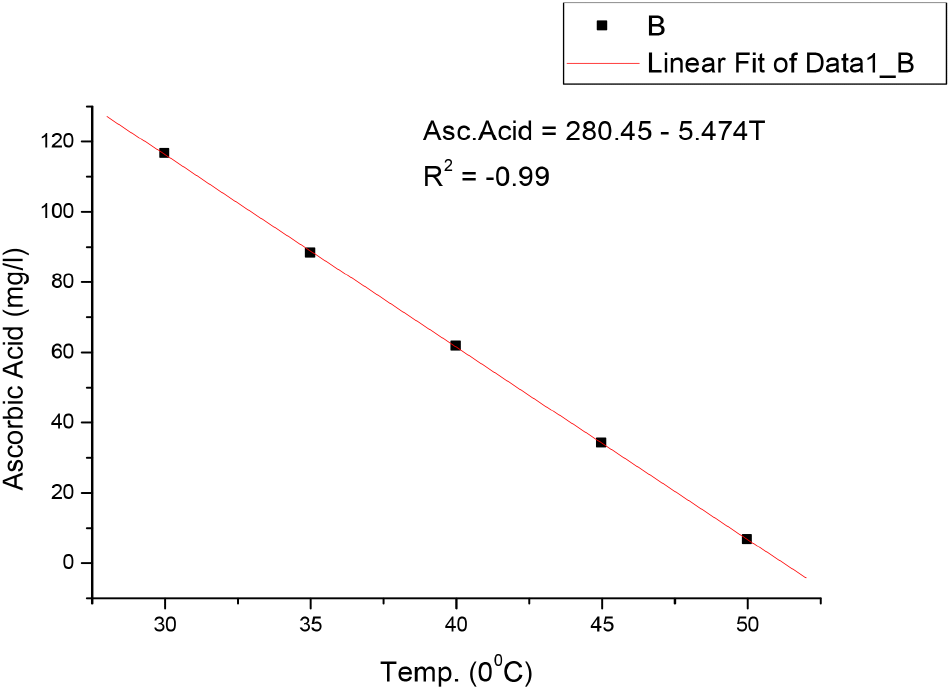
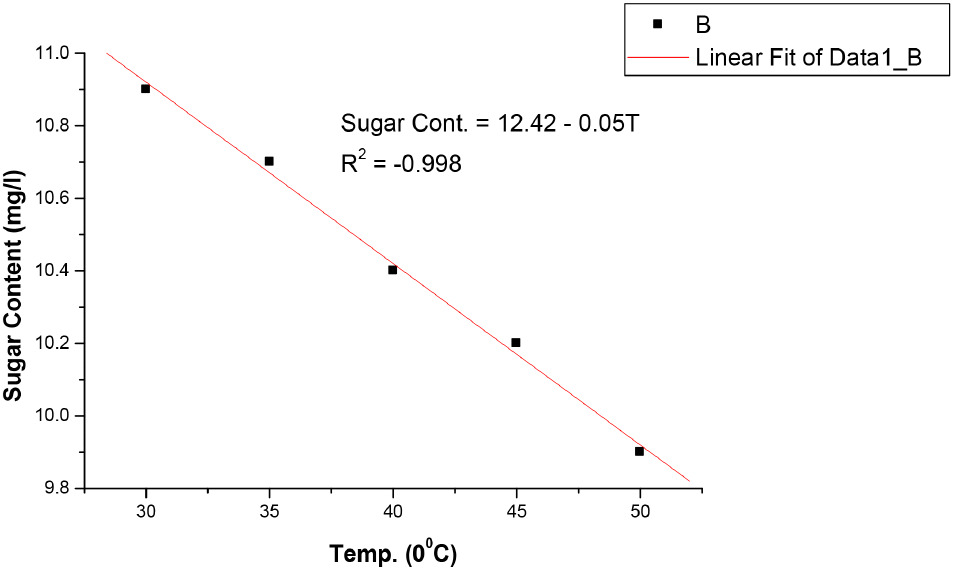
The results in Table 3 showed that bitterness of the non-alcoholic malt drink increases with increase in temperature from 6.6 EBU at 30°C to 9.7 EBU at 50°C. These values were still within the permissible limits of NIS as stated in Table 4. Bitterness is obtained when non-alcoholic malt drinks made from malted barley are seasoned with hops (Brown and Clubb, 2013). It is a requirement because it does not only give the required taste but also acts as a preservative. The pH decreases with temperature and decrease from 5.0 at 30°C to 4.52 at 50°C, showing a slight increase in acidity as the temperature increases. However, these values were still within the acceptable limit of NIS shown in Table 4. The total acidity also changes as the temperature increases. It appreciated with temperature rise from 0.006 at 30°C to 0.025 at 50°C but still within the acceptable limits of NIS shown in Table 2. It is expressed in terms of citric acid content, ie., hydrogen bonding between the oxygen atom and the hydrogen atom is broken to form the citrate as the temperature rises, releasing the hydrogen ion into the solution and reducing the pH leading to increased acidity. This may affect the quality of malt drinks negatively with time. Ethyl alcohol content of the malt was not affected by the rise in temperature like the case of the soft drink as shown in Table 1 and 3, indicating that no fermentation has taken place, and is acceptable by NIS standards. The results in Table 3 also showed that original gravity of the malt drink studied decreases with increase in temperature from 1,055 °Saccharin (%v/v) at 30°C to 1,045 °Saccharin (%v/v) at 50°C but within the acceptable limits of NIS for standard malt drinks and light malt drinks of 1,060 and 1,050 °Saccharin (%v/v), respectively, but slightly above the low sugar malt drinks of 1,020 °Saccharin (%v/v) as shown in Table 4. The malt sample used in this study was in the category of standard malt drinks.
Original gravity is the measure of the solids content initially in the wort before fermentation may or may not have commenced. It is relevant in the standards because it indicates the richness of the solids content in the wort, which is the total fermented and unfermented sugar [Standards Organisation of Nigeria (SON, 2013)]. Ascorbic acid (vitamin C precursor) content of the malt drink also change with temperature as shown in Table 3. It decreases with increase in temperature from 441.13 mg/L at 30°C to 87.30 mg/L at 50°C, yet its values were still within the permissible limits of NIS in Table 4. This shows that storing malt drinks at 40°C and above for a long period reduces the ascorbic acid (vitamin C) content and other parameters below or above NIS standards deteriorate the quality of the malt drink. This results agree with the fact that vitamins, carotenes, organic acids, minerals etc. are significantly affected by temperature. Increase in temperature results in a decrement in vitamin A and C (Sarkar et al., 2021). The sugar content as revealed in Table 3 indicates that it decreases as the temperature rises from 14.0 mg/L at 30°C to 13.4 mg/L at 50°C but within the acceptable limits of NIS shown in Table 4. As mention earlier, increase in temperature affects the sugar content of malt drinks and the other quality requirements of soft and non-alcoholic drinks based on the results of this study. Regression analysis in Fig. 7-12 showed a linear relationship between the quality parameters and storage temperature.
The novelty of this research is the fact that, it is the first study on the effect of storage temperature on the quality requirements of soft and non-alcoholic drinks in Nigeria. This study has also expose the fact that the potency and nutritional value of soft and non-alcoholic drinks does not just depend on the shelf-life alone but also on the storage temperature from the time of production to the time of consumption. Besides, both the regulatory agencies, manufacturers and consumers will no longer depend on the expiry date alone as a sign of potency of the drinks but also on the preservation mode and temperature.
In summary, this study has been able to establish that the different quality requirements of soft and non-alcoholic malt drinks changes linearly as the storage temperature increases over time which might lead the reduction of their quality, potency and nutritional value, even when the official expiry date has not reached. Besides, most manufacturers, sellers, consumers and even regulatory agency personnel may not even know that deterioration has gradually started since the expiry date is still far. Although these drinks are sometimes labeled “best served when chilled”, how many sellers or vendors are able to preserve them in a refrigerator for long in Nigeria with inadequate electrical power supply challenge in rural areas of the country. What about the manufacturers and major distributors who store these drinks in large quantities in warehouses? Yet the average room temperature of most tropical countries like Nigeria is 30°C and above. This implies that the quality and potency is not dependent on the shelf-life (the gap between the manufacturing and the expiry date) alone, but also on the storage temperature. Thus, regulatory agencies need to consider the effect of storage temperature on the quality of these drinks and their mode of preservation, in other to safeguard the health of the people.
4. Conclusions
The major findings revealed that the storage or preserving temperature of soft and non-alcoholic malt drinks affects their quality requirements or standards gradually/linearly over time. Also, the potency and nutrition value of drinks should not be judged based on their manufacturing or expiry dates alone but on the storage temperature also. Therefore, it is recommended that the storage temperature for drinks should always be 25°C and below, and they should be stored by refrigeration. Also, the relevant government regulatory agencies should no longer monitor and evaluate their quality by checking expiry dates alone, but by carrying out quality control test/analysis half way into the shelf-life of these drinks and advise the manufacturers and consumers on the favourable storage temperature and conditions.
