1. Introduction
As the quality of life and dietary standards of modern consumers have risen, there has been an increasing focus on health (Cho and Ryu, 2020). In the past, diets were predominantly meat-based, including both meat and processed meat products. However, the environmental ramifications of livestock farming, slaughtering, and processing have prompted a shift towards ethical consumption practices, increasing interest in plant-based meat alternatives (Cho and Ryu, 2017; Choi and Ryu, 2022). The alternative food industry, including research and product development, is projected to reach approximately $17.8 billion by 2025, according to the Korea Rural Economic Institute (KREI) (Park and Lee, 2020). This sector includes a variety of sources, such as plant-based raw materials, cell culture, microbial protein, and edible insects. Specifically, plant-based options are further categorized into meat, seafood, and dairy alternatives (Ham et al., 2021). Cell culture technologies yield cultured meat, seafood, and dairy products, while insect-based options focus on protein sources.
Texturized vegetable protein (TVP), utilized in both cultured meat and plant-based food alternatives, is recognized for its potential to contribute to sustainability by shifting meat production from farms to laboratories and food factories. The production of TVP involves an extrusion process where vegetable protein undergoes heating, pressure, and shear forces within an extruder barrel. This process, characterized by high temperatures and short durations, allows for the creation of fibrous, meat-like textures. TVP’s classification into high and low moisture categories depends on the structure of the injection port and the moisture content of the product (Cho and Ryu, 2021). Primarily, soy protein—as isolated soy protein, soy protein concentrate, or defatted soy flour—is used in TVP production. Wheat gluten and a small quantity of starch are also incorporated to emulate the texture of real meat (Kyriakopoulou et al., 2019).
Current research on TVP has focused on extrusion conditions (Gu and Ryu, 2019; Park et al., 2016), moisture content control for meat analog characteristics (Choi and Ryu, 2022; Kim et al., 2012), quality enhancement through mushroom addition (Cho and Ryu, 2020), and the protein structure in plant tissues based on gluten content (Park et al., 2017). However, studies exploring the improvement of soy protein structure through the addition of other raw materials and additives, such as aronia (Park et al., 2023), yeast (Jeon et al., 2022), and radish leaf extract (Sung et al., 2016), remain limited. Meat analogs available to consumers are categorized into unground types (e.g., bulgogi, jerky) and ground types (e.g., dumplings, meatballs) (Cho and Ryu, 2021), typically sold in frozen or dried form. This presents the disadvantage of requiring consumers to rehydrate them after purchase for cooking and consumption at home. There is an emerging consumer demand for storing meat and fish at temperatures above typical freezer levels (−20°C) and below refrigerator temperatures (4°C) for home use (Joo et al., 2016). While extensive research exists on the storage conditions for meat and fish (Joo et al., 2016; Kim and Moon, 1998; Lee et al., 2003), studies on the storage temperature and duration for alternative foods are scarce. This study investigates the impact of storage temperature on the structural properties of TVP after production, aiming to provide insights into its distribution and consumption lifespan, as well as offering foundational data for manufacturers and distributors.
2. Materials and methods
Defatted soybean powder was prepared from Daewon soybeans (Glycine max (L.) Merrill), the most widely cultivated variety of domestic soybeans, obtained from the National Seed Resource. The beans were peeled, pressed, and defatted at a low temperature of 80°C using an oil press, followed by pulverization into powder. Gluten (Comida, ADM Bazancourt, Bazancourt, France) and corn starch (Samyang Ltd., Ulsan, Korea) were procured commercially.
The mixture for the extrusion comprised 50% defatted soy flour, 30% gluten, and 20% corn starch. An intermeshing twin-screw extruder (Process-11, Thermo Fisher Scientific Inc., Karlsruhe, Germany) equipped with a cooling die at the barrel’s end was employed for the experiments. The extrusion conditions were set to a barrel temperature of 190°C and a screw rotation speed of 250 rpm, and water was injected at 9 rpm using a peristaltic pump (BT101S Peristaltic Pump Drive, Lead Fluid Technology Co., Baoding, China). The raw material was fed into the extruder at a rate of 5 g/misn.
The extruded TVP samples were cut into 20 cm sections, ensuring no overlap, and then vacuum-sealed in polyethylene packs (PE packs) for the storage experiments. Samples were stored at −20°C in a freezer equipped with a temperature controller and at 0 and 4°C in a low-temperature incubator (VB-360B, Vision, Kimpo, Korea). Sampling was performed on days 0, 1, 3, 6, and 9, with all samples allowed to equilibrate to room temperature for 30 min prior to analysis.
Texture analysis was conducted using texture profile analysis (TPA) and cutting strength measurements. TPA assessed hardness, elasticity, chewability, cohesion, and gumminess using a physical property analyzer (TAXTplus, Zwick Roell, Sungnam, Korea). Samples were prepared in 1.0×1.0 cm sections for testing with a load cell of 2.5 cm diameter applying a 30% shear force across 2 bites with a 25 mm probe. Cutting strength was determined using a cutting probe (7.5×38.3 mm) attached to a rheometer (Sun Rheo Meter, COMPAC-100II, Sun Sci Co., Tokyo, Japan), with a maximum load cell stress of 10 kg and a table speed of 120 mm/min. Samples were cut into cross-sections of 1.0×2.0×0.5 cm for this analysis.
Moisture content was measured using a loss-on-drying method. For each day of storage, 3 g of TVP was sliced into 0.2 mm thick sections and placed nonoverlapping on an aluminum plate. Samples were then dried in a 105°C oven to a constant weight, with the final moisture content expressed as a percentage (%).
Water absorption capacity and solid leaching were evaluated by modifying the methodology of Kang et al. (1989). For water absorption capacity measurements, 10 g of the sample was heated in five times its weight of boiling distilled water for 3 min, then drained using a sieve. After cooling at room temperature for 2 h, surface water was removed, and the sample was weighed. The water absorption rate was calculated using equation (1). Solid leaching was assessed by collecting the solution that passed through the sieve during the water absorption measurement, transferring it to a preweighed aluminum container, and oven-drying it at 105°C for 24 h. After cooling for 30 min at room temperature, the container’s weight was measured again to calculate the solid leaching using equation (2).
The pH was determined by preparing a 10% suspension from 2 g of the sample in distilled water, homogenizing this mixture for 30 s at 12,000 rpm using a homogenizer (T25basic, IKA, Rawang, Malaysia), and then centrifuging at 4,000 rpm for 20 min (2236HR, GYROZEN Co. Ltd., Kimpo, Korea). The pH of the supernatant was measured using a pH meter (ORION STAR A211, Thermo Scientific, Waltham, MA, USA).
Color measurements were performed using a colorimeter (Color i7, X-rite Inc., Grand Rapids, MI, USA). The extruded sample was placed in a 35 mm dish, and values for lightness (L), redness (a), and yellowness (b) were recorded. Measurements were taken in triplicate and averaged. The calibration was based on a standard white plate with values of L=+95.75, a=-0.21, and b=+2.78.
Turbidity was assessed by heating 10 g of the sample in five times its weight of boiling water for 3 min, draining the liquid through a sieve, and measuring the absorbance at 600 nm (OD 600 nm) using a spectrophotometer (Cary 3500 Multicell Agilent, Santa Clara, CA, USA).
Free amino acids were quantified using an amino acid autoanalyzer (L-8900, Hitachi Co., Ltd, Tokyo, Japan). A quantity of 10 mL of a 5% trichloroacetic acid solution (Junsei Chemical Co. Ltd., Tokyo, Japan) was added to 1 g of the sample, vortexed for 1 min, and centrifuged at 4°C and 12,000 ×g for 15 min. The supernatant was diluted twofold with 0.02 N HCl (pH 2.2), filtered through a 0.2 μm filter (Millipore Co., Cork, Ireland), and analyzed using a PF#2622 column (4.6×60 mm, Hitachi Co. Ltd.) with the column oven set at 57°C and the reactor at 136°C. A ninhydrin solution (Wako Pure Chemical Industrial, Osaka, Japan, Ltd.) was used for color development.
Data were statistically analyzed using SPSS (version 23.0, SPSS Inc., Chicago, IL, USA) and expressed as mean±standard deviation for each sample. Differences between samples were evaluated using a one-way ANOVA, with Duncan’s multiple range test applied to identify significant differences (p<0.05).
3. Results and discussion
Fig. 1 presents the visual characteristics of TVP across various storage temperatures over time. From the day of extrusion until day 9 of storage (Fig. 1(A)), TVP stored at −20 and 0°C became noticeably softer and more brittle starting on day 6. At 4°C, TVP exhibited rapid hardening from day 3. Further examination of its internal structure revealed a significant bouncing force upon cutting. Additionally, detailed observations of the tissue organization under a stereomicroscope (Fig. 1(B)) indicated that at −20°C, the fibrous tissue’s clarity, evident on the day of extrusion, was maintained through day 9. However, at 0°C, the distinctness of the fibrous tissue observed initially was lost, with the fibrous layers appearing to merge as early as day 3. At 4°C, while the clarity of the fibrous tissue persisted until day 9, the fibrous layers began to show signs of damaged morphology from day 3, characterized by a lack of flexibility upon cutting, leading to spreading and cracking in the absence of moisture. This deterioration might be attributed to the aging of starch, wherein water molecules are expelled from between starch molecules, causing phase separation (Cheon et al., 2017) and tissue curing, ultimately resulting in a decline in quality.
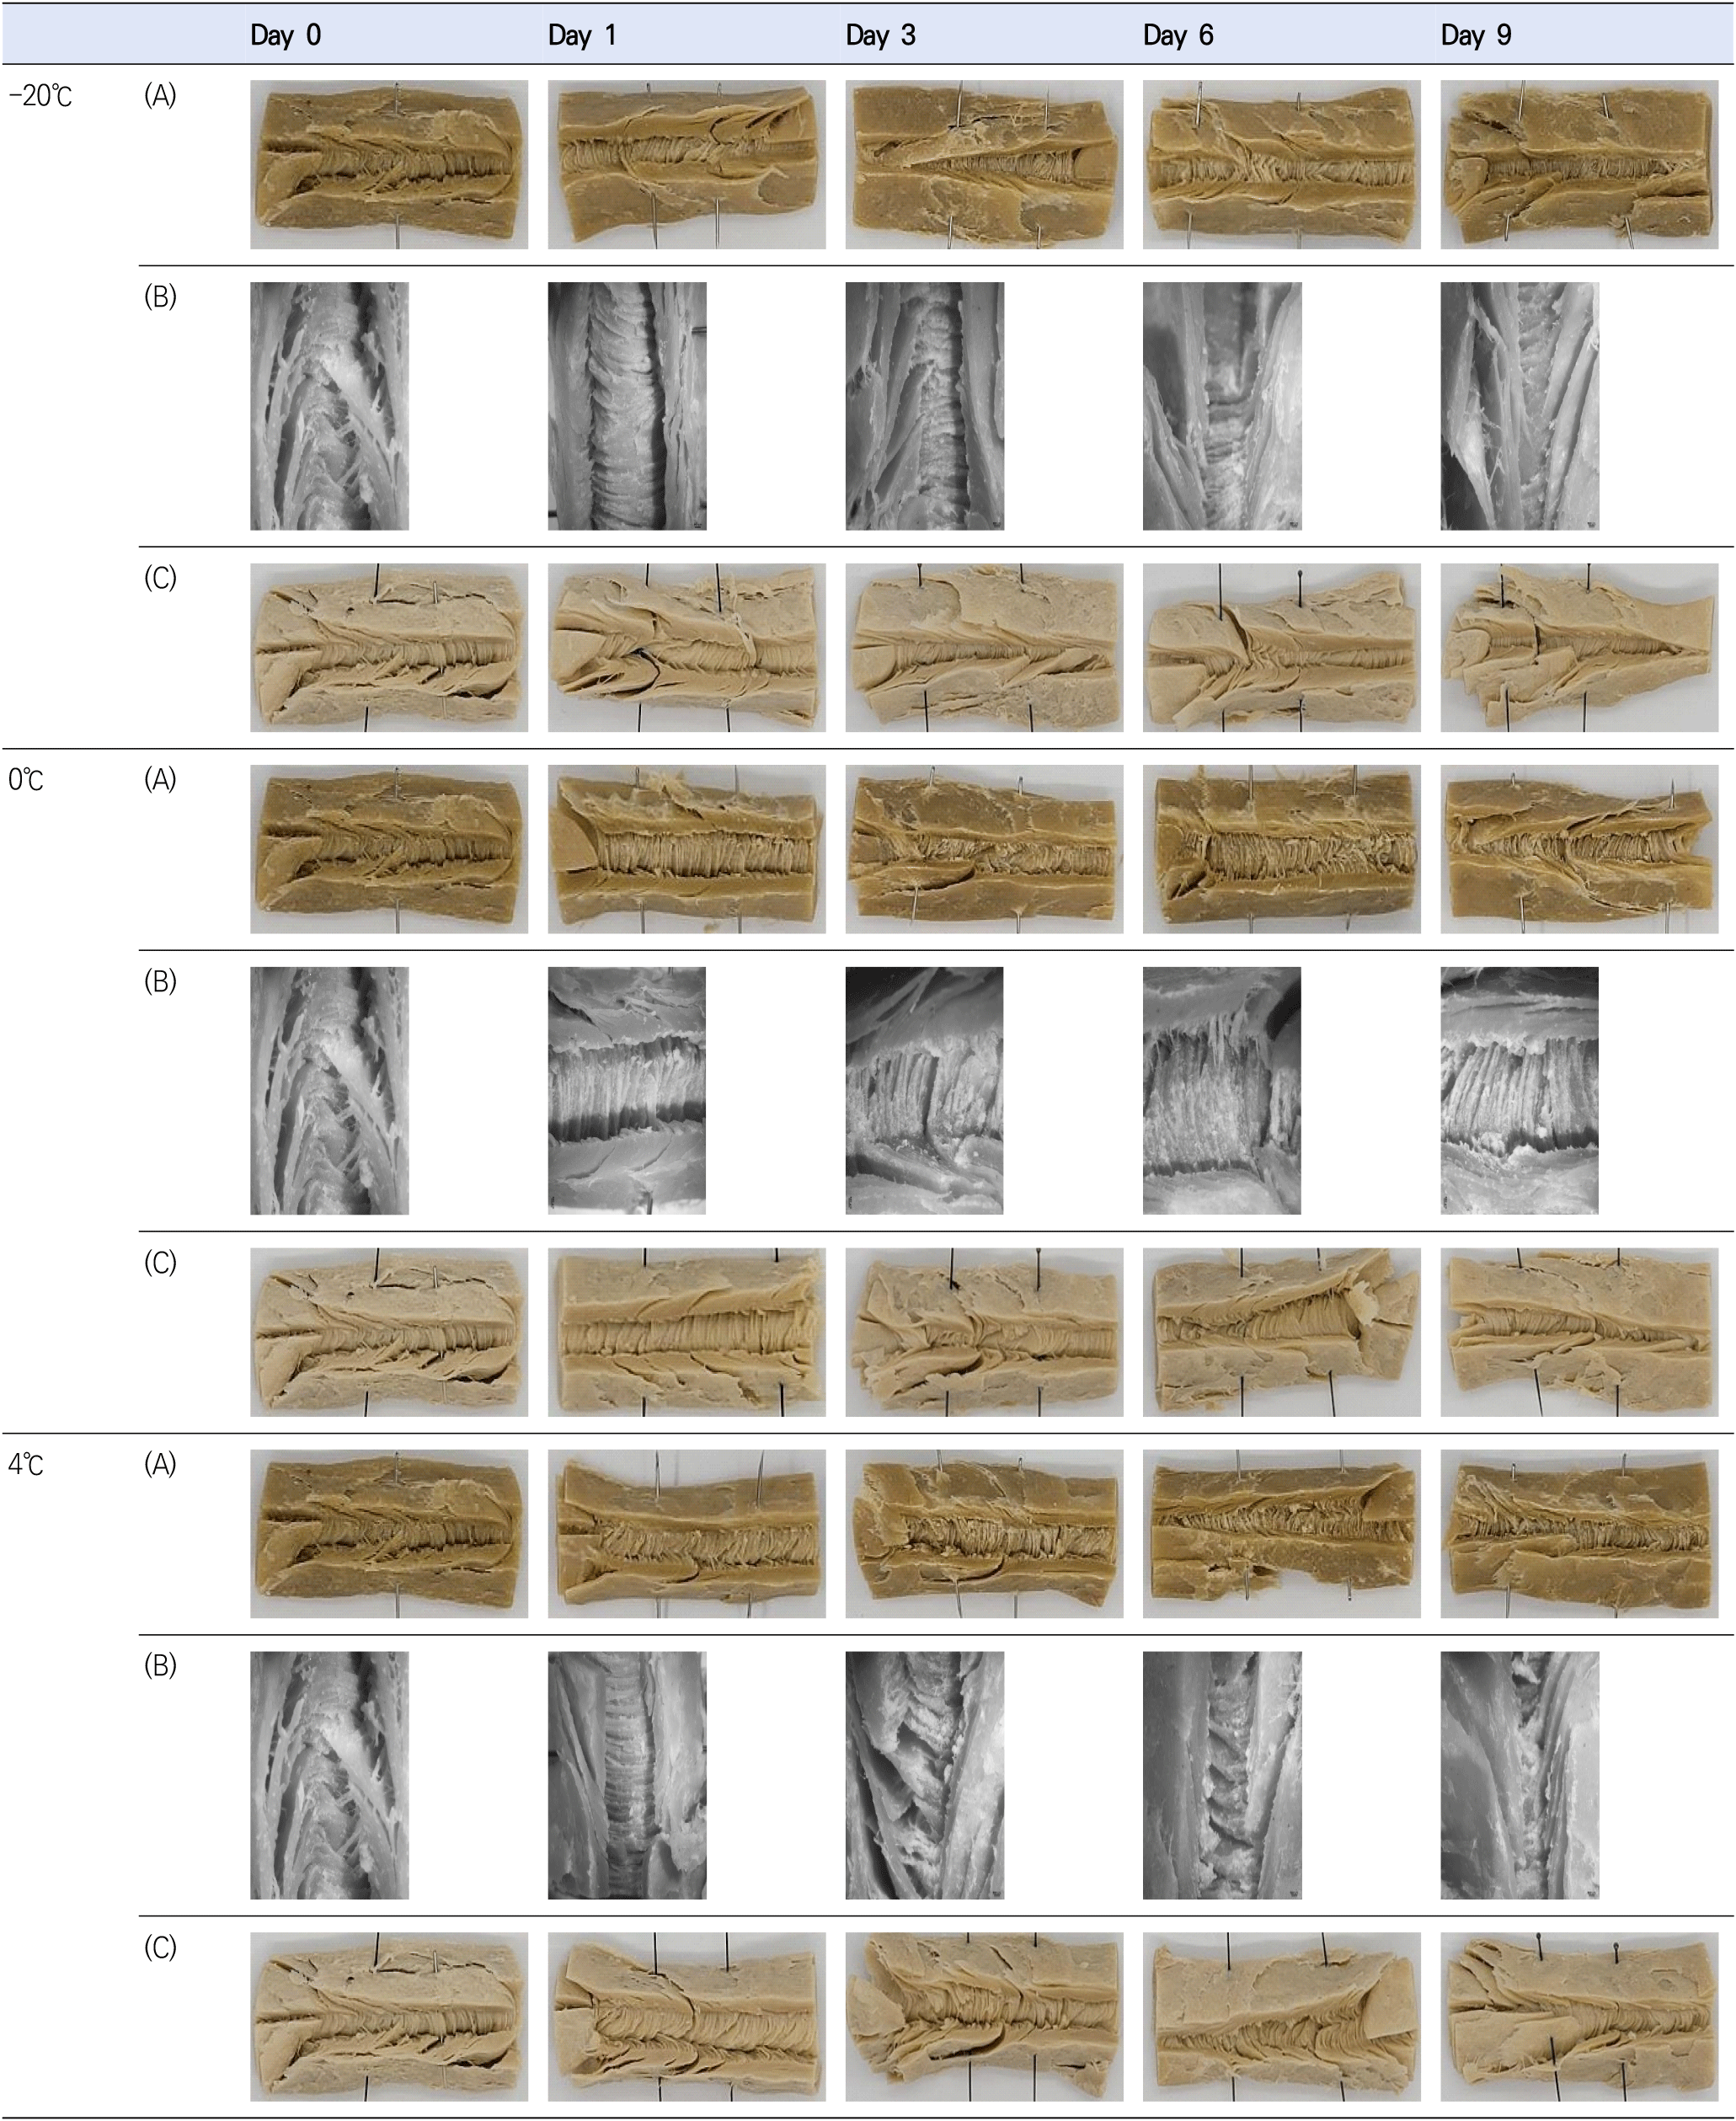
Table 1 shows the texture measurements of TVP across different storage temperatures over a period of 0-9 days. Texture profile analysis revealed that hardness ranged from 1,366.67±164.50 to 2,760.00± 424.95 g at −20°C, with an initial increase up to day 3, where the peak value of 2,760.00±424.95 g was observed, followed by a subsequent decrease. At 0°C, hardness spanned from 1,366.67±164.50 to 5,020.00±536.11 g, with a sharp rise to 5,020.00± 536.11 g on the first day, then a decline, showing no significant difference from day 3 to 9 (p<0.05). For storage at 4°C, hardness varied between 1,366.67±164.50 and 5,418.33±1,311.57 g throughout the 0-9 day period, increasing until day 3 and then decreasing from 5,418.33±1,311.57 g, with no notable difference observed from day 6 to 9 (p<0.05).
The least curing was observed at −20°C, followed by 0 and 4°C, respectively. At 0°C, a sharp increase in hardness was noted on day 1; at 4 and −20°C, the degree of change in hardness varied, but the trend over the period was similar. This was similar to the rapid increase in hardness of baekseolgi (white steamed rice cake) stored at 0°C on day 1 (Kim, 1998) and injeolmi (sweet rice cake) after a day of frozen storage (Lee et al., 2017). The elasticity at −20°C showed no significant variation from the day of manufacture through day 9, whereas, at 0 and 4°C, a significant increase in elasticity was recorded on day 1, with no significant changes observed from day 1 to 9 of storage (p<0.05). This was consistent with a study by Baek et al. (2021), which found that bread with immature glutinous rice barley powder increased in resilience over a 4-day storage period at 4°C.
Gumminess significantly increased from the manufacturing day at −20°C, peaking on day 3, then declining. At 0°C, a sharp rise on day 1 was followed by consistent levels through day 9 of storage (p<0.05). At 4°C, gumminess increased sharply on day 1, continued to increase until day 3, and then decreased by day 6, with no significant differences observed from day 3 to 9 (p<0.05). Cutting strength peaked on day 6 across all temperatures, showing a decline by day 9 compared to the day of extrusion (p<0.05).
The observed texture changes are attributed to the starch aging phenomenon. Hong et al. (2008) identified that hardness was the most noticeable characteristic of aging in their study on the storability of soy protein-enhanced flour. Similarly, Kim and Shin (1996) reported that aging occurred more rapidly at 4°C compared to -18, 4, and 20°C during their investigation into the aging characteristics of rice flour. Furthermore, the results revealed that when stored at −20, 0, and 4°C, whether frozen or refrigerated, the degree of curing was more pronounced at 0 and 4°C than at −20°C, and the rate of curing was found to be faster at 0°C compared to 4°C. This difference in physical properties among storage temperatures can be attributed to the notable variation in texture at refrigeration temperatures of 0°C, the freezing point of water, and 4°C. At these temperatures, the samples hardened, and the cell walls became harder as moisture was expelled from the cells and large ice particles formed. In contrast, at a storage temperature of −20°C, the cell walls remained intact upon thawing (Kim and Shin, 1996).
Fig. 2 shows the moisture content of TVP across different storage temperatures. Initially, the moisture content was recorded at 43.76±0.57% on the day of extrusion. The lowest moisture content across all temperatures was observed on day 6 (43.34±0.79% at −20°C, 42.38±070% at 0°C, and 41.89±1.20% at 4°C) with statistical significance (p<0.05). The highest moisture content during the 9-day storage period was noted on day 9 at both −20 and 4°C. Moisture content in food products fluctuates throughout storage and distribution, with the duration to achieve moisture equilibrium varying by product, depending on initial moisture levels (Shin et al., 2016). Specifically, cereals of different types exhibit different moisture equilibration times (Lee, 2013). Over the 9-day storage period, TVP’s moisture content exhibited a pattern of initial decrease followed by an increase, particularly noted on the final day (p<0.05). These findings align with those of Kim and Sing (1989), who reported no significant change in moisture content across various storage temperatures in their analysis of chemical changes in livestock sausages during temperature-dependent storage. Similarly, Kang et al. (2011) observed in their study on the quality characteristics of tteokbokki tteok (rice cake) with different numbers of extrusion molds that increased number of extrusions and exposure to cooling water led to moisture diffusion into the sample and water infiltration, thereby increasing moisture levels.
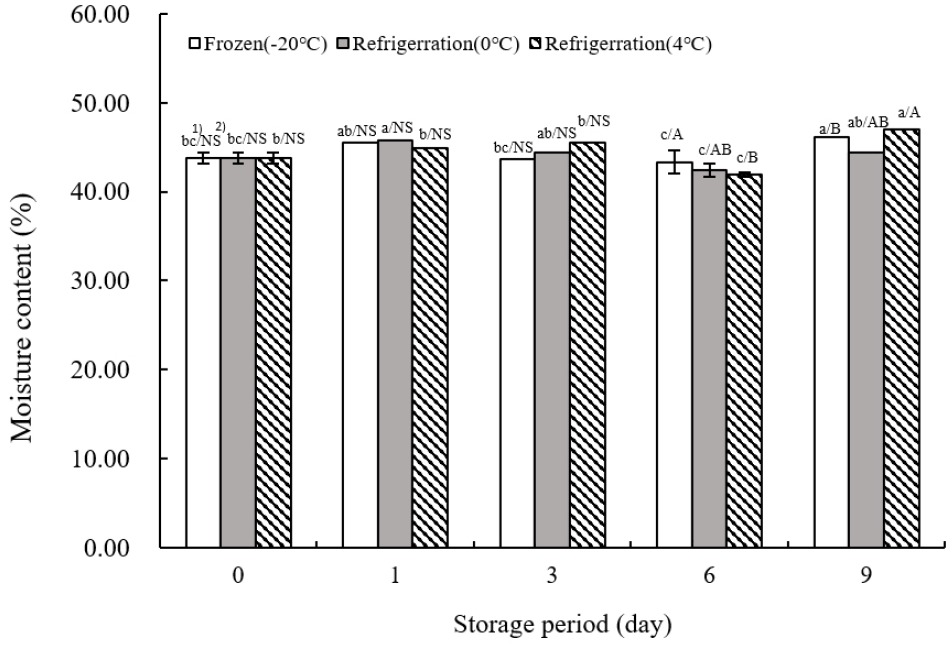
Fig. 3 illustrates the water absorption capacity of TVP as influenced by storage temperature. On the day of extrusion, water absorption was measured at 10.21±1.47%. At −20°C, the water absorption tended to increase significantly as the storage duration extended (p<0.05). This was consistent with the findings of Park et al. (2023), where water absorption was enhanced with the addition of aronia powder, peaking at 0°C on day 3. The highest water absorption values at 4°C were recorded on day 6. Unlike at −20°C, water absorption rates at 0 and 4°C showed fluctuations, increasing and decreasing throughout the storage period. The increase in water absorption can be attributed to the less dense tissue inside the TVP, which facilitates water penetration.
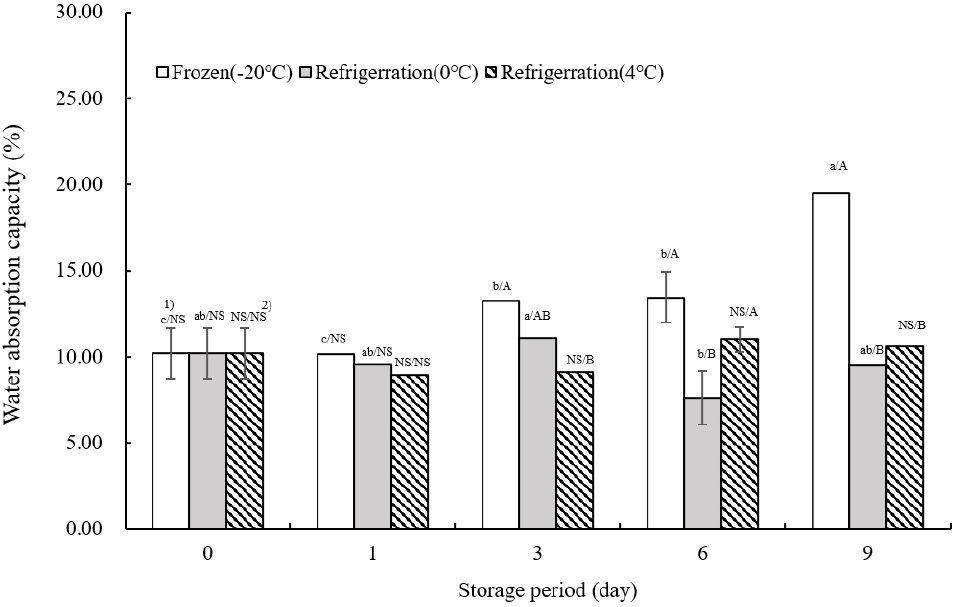
Fig. 4 presents the data on solid leaching from TVP. On the day of extrusion, solid leaching was measured at 1.16±0.05%. At −20°C, the peak leaching occurred on day 6 of storage, with no significant variation in leaching rates across different storage days except for day 6 (p<0.05). At both 0 and 4°C, the highest leaching rates were recorded on the first day of storage, followed by fluctuating levels of increase and decrease. This suggests that as storage duration increased, the density of the internal tissue of the TVP reduced, leading to more pronounced leaching during boiling. The extent of leaching inversely correlates with the internal cohesion of TVP, serving as an indicator of its structural integrity.
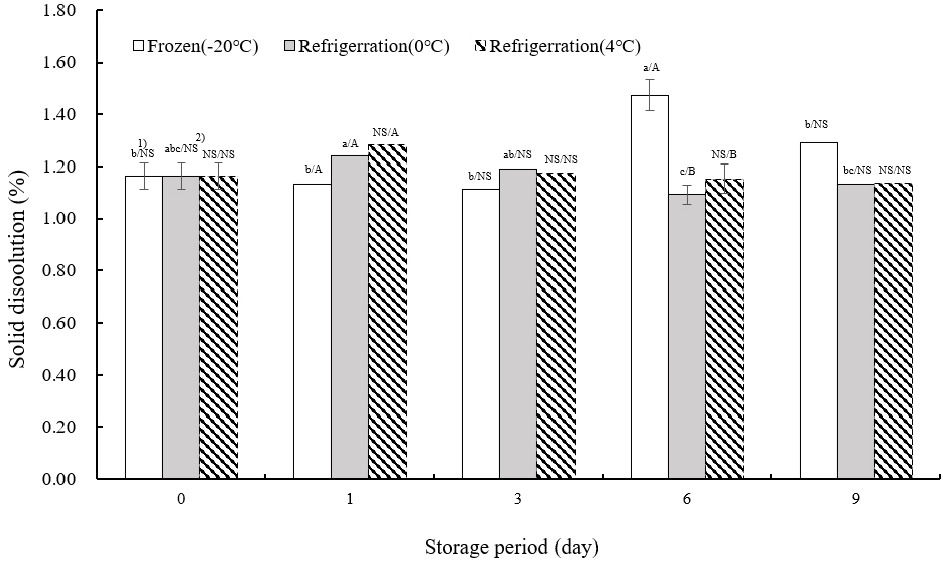
Table 2 presents the pH measurements of TVP across various storage temperatures. The pH for samples stored at −20 and 0°C increases significantly, with the maximum pH recorded at 6.98±0.01 on day 6 of storage, followed by a marginal decrease (p<0.05). At 4°C, a significant increase in pH was observed on day 9 of storage (p<0.05). This was consistent with the results of Park et al. (2023), who reported a pH measurement of 6.67±0.02 for TVP. The pH values ranged between 6.87 and 6.99 across all temperatures, indicating a neutral pH level. The pH is a crucial determinant of food safety and moisture retention, serving as an indicator for assessing food spoilage (Kang et al., 1992). The findings suggest that TVP’s pH remains relatively stable and neutral over 9 days of storage at −20, 0, and 4°C.
Table 2 details the color measurements of TVP under various storage temperatures. The L* value, indicative of lightness, showed a significant increase by day 6 at −20°C before marginally declining on day 9. At 0°C, no notable changes in lightness were observed across the storage period, except on day 1. At 4°C, lightness initially increased from the day of extrusion to day 1, followed by a decrease throughout the storage period. The a* value, representing redness, decreased significantly over time at −20°C, with similar values from days 0 to 9, except for a distinctive reading on day 6 at 0°C. In the case of −20 and 0°C temperatures stored below the freezing point of 0°C, some moisture is eluted outside as the internal tissue is frozen, and overall brightness and redness are considered to decrease. Redness increased with prolonged storage at 4°C. The b* value, which represents yellowness, decreased after storage at −20, 0, and 4°C by day 9 compared to the day of extrusion. Research on the storage stability of sausages with nitrite and red beet by Jung et al. (2010) demonstrated that internal factors affecting pigmentation, such as browning or degradation of pigments like anthocyanins, significantly influence color variations during storage. Similarly, Lee et al. (2012) investigated the storage impact on tteokbokki tteok prepared with soy curd, noting that the high lightness from soy curd markedly influenced the final product, in contrast to the control without soy curd, which showed no significant differences in lightness, redness, or yellowness. Thus, in the absence of significant color-altering factors during storage, color variations in TVP are minimal and not substantially impactful.
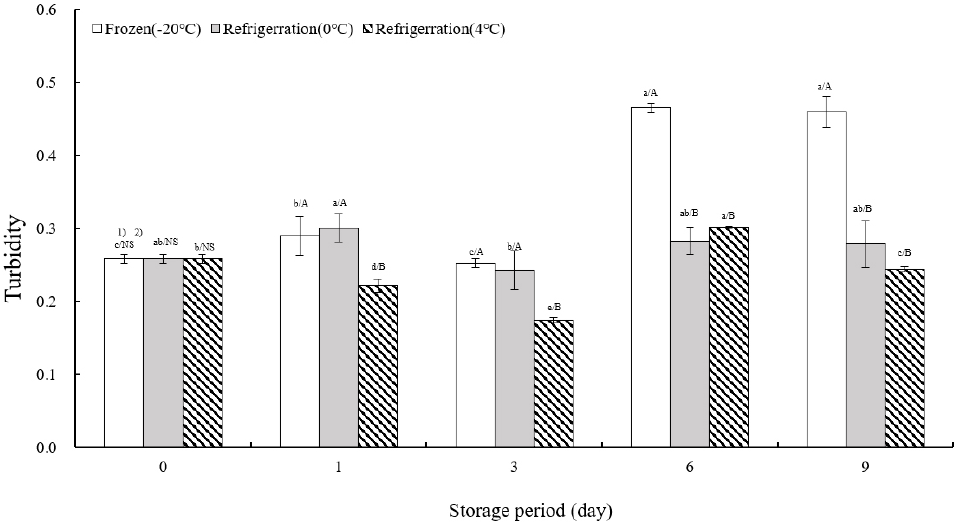
Fig. 5 illustrates the turbidity measurements of TVP across various storage temperatures. Initially, turbidity was recorded at 0.26±0.01 on the day of extrusion. At −20°C, turbidity remained consistent from the day of extrusion until day 3, followed by a significant increase of more than 180% between days 6 and 9. At 0°C, turbidity peaked on day 1, decreased by day 3, and stabilized from days 6 to 9. Storage at 4°C showed a notable decrease in turbidity from the day of extrusion to day 3 (p<0.05), a substantial increase of over 115% by day 6, and a subsequent decrease on day 9. The study by Jung and Cho (2002) on the storage characteristics of tofu with green tea powder utilized turbidity as an indicator of indirect spoilage, which correlates with the safety duration of storage. This study aligns with Lee et al.’s (2012) research on storage characteristics of tteokbokki tteok, where total TVP—representing the final form consumed by customers—served as a marker for the extent of internal tissue loosening during cooking, alongside moisture absorption and solid leaching measurements. Cho and Ryu (2020) examined the quality attributes of extruded meat analogs with added mushrooms, noting that mushrooms improved internal binding but reduced water retention capacity. Correspondingly, in this study, as TVP hardened in relation to storage temperature-specific texture measurements, internal cohesion diminished, leading to increased turbidity.
Tables 3-5 show the impact of storage temperature on the free amino acid profile of TVP, which plays a critical role in flavor perception. Aspartic acid and glutamic acid are notable for contributing umami flavors, while alanine, glycine, lysine, proline, serine, and threonine are associated with sweetness. Arginine, histidine, leucine, methionine, phenylalanine, valine, and tyrosine are linked to bitterness (Kato et al., 1989). The study aimed to examine changes in TVP’s flavor profile related to storage temperature.
No changes were detected in aspartic acid levels across all temperatures. Glutamic acid, however, started at 231.69±0.16 μg/g on the day of extrusion and increased to 261.13±3.18 μg/g at −20°C, 265.72±6.19 μg/g at 0°C, and 260.71±7.68 μg/g at 4°C. On the day of extrusion, the sweetness-related amino acids—alanine, glycine, and lysine—were measured at 83.42±3.00, 31.27±1.48, and 35.73± 0.16 μg/g, respectively, with proline, serine, and threonine undetectable in the total TVP. When stored at −20°C, alanine, glycine, lysine, proline, and serine levels were 91.12±0.71, 32.66±0.37, 38.90±0.37, 17.45±0.27, and 14.62±0.85 μg/g, respectively, exhibiting an increasing trend from the day of extrusion, with the highest values at day 3. When stored at 0°C, alanine, glycine, lysine, and proline levels were 94.81±1.65, 34.67±0.72, 39.13± 1.17, and 3.41±4.82 μg/g, respectively, which tended to increase from the day of extrusion, peaking between days 6 and 9. Serine reached its highest at 20.85±0.21 μg/g on day 6, then decreased by day 9. When stored at 4°C, alanine, glycine, lysine, and proline levels were 93.48±2.12, 33.14±0.11, 39.43±1.26, and 16.76±3.03 μg/g, respectively, which increased with storage period. Serine peaked at 15.08±0.00 μg/g on day 6 but decreased to 8.52±8.32 μg/g by day 9, lower than its initial level.
The bitterness-related amino acids—arginine, histidine, leucine, methionine, phenylalanine, valine, and tyrosine—showed initial levels of 582.24±3.25, 24.36±0.17, 22.88±0.37, 15.85±2.73, 64.73±0.86, 12.94±0.40, and 27.15±0.24 μg/g respectively. When stored at −20°C, valine and methionine showed the highest values of 13.92±0.79 and 19.44±3.82 μg/g, respectively, on day 3 of storage; however, the change from the day of extrusion was not significant. For leucine, tyrosine, phenylalanine, and histidine, the highest values of 26.34±1.07, 31.67±0.69, 75.84±3.05, and 27.70±1.87 μg/g, respectively, were observed during on day 3 of storage. For arginine, the highest value of 647.03± 13.65 μg/g was on day 6, indicating an increase from the day of extrusion. When stored at 0°C, valine and methionine levels decreased to 11.99± 1.43 and 12.40±5.03 μg/g, respectively, on day 1 of storage. Leucine, tyrosine, phenylalanine, and arginine increased to 26.02±0.59, 30.99±0.98, 74.14±2.35, and 651.70±10.24 μg/g, respectively, on day 6, and histidine increased to 27.37±1.17 μg/g with storage. When stored at 4°C, valine decreased to 11.181±0.66 μg/g on day 9 of storage and methionine decreased to 14.40±8.23 μg/g on day 1; leucine, tyrosine, phenylalanine, histidine, and arginine increased to 24.37±1.00, 29.24±1.27, 72.26±23.38, 27.03±1.51, and 637.33±17.83 μg/g, respectively, on day 9 of storage. β-alanine, acting as a neurotransmitter in the central nervous system (Tiedije et al., 2010), was initially measured at 29.70±0.20 μg/g and increased to 33.69±0.30, 33.98±1.10, and 33.23±0.83 μg/mL when stored at −20, 0, and 4°C, respectively.
4. Conclusions
This study investigated the impact of storage temperature on the quality characteristics of TVP. TVP was produced by mixing defatted Daewon soybean flour, gluten, and corn starch in a 5:3:2 ratio and then extruding the mixture at a screw speed of 250 rpm and a barrel temperature of 190°C with moisture injection at 9 rpm. The extruded TVP was vacuum-sealed in PE packs and stored at −20, 0, and 4°C for a duration of 9 days. The texture analysis indicated that the rate of curing followed the order of 4°C > 0°C > −20°C. No significant difference was observed in color values across the storage conditions, while moisture content increased at all temperatures. A significant variation was noted in moisture absorption capacity (%) and solid leaching (%), following the order of −20°C > 0°C > 4°C. The turbidity of the solution extracted during the cooking process followed the sequence from highest to lowest of −20°C > 4°C > 0°C, with the pH remaining neutral. Regarding free amino acids, sweetness and texture profiles improved with storage across all temperatures. However, certain bitterness components showed a decrease at 4°C.
In conclusion, storage at −20°C exhibited the least change in hardness, which is closely linked to aging, making it the most suitable storage condition. Storage at 0 and 4°C for 9 days did not result in spoilage, as indicated by stable pH levels, and although negative flavor components were diminished, mushiness was observed by day 3. This suggests that further research is necessary to mitigate texture alterations for TVP distribution at refrigerated temperatures.


