


1. Introduction
Legumes belonging to the Fabaceae family contain large amounts of arabinose and galactose, in addition to various other monosaccharides. Arabinogalactans (AGs) are polysaccharides containing arabinose and galactose linked by glycosidic bonds (Borner et al., 2003; Kieliszewski and Lamport, 1994; Xu et al., 2008). The AG chemical structure consists of a 1,3-linked β-D-galactose main chain with highly branched 3- and 6-linked galactose and 3-linked arabinose (Sanchez et al., 2008). Despite extensive efforts to elucidate the structure of AGs, they still have not been fully characterized, mainly due to the great heterogeneity of the glycan structures (Estévez et al., 2006).
AGs, mainly isolated from legumes, are widely used as emulsifiers in the food industry (Castellani et al., 2010). AGs are used as a thickening agent to supplement beverages to enhance viscosity and provide pH stability (Rumpagaporn et al., 2012). In humans, AGs are non-digestible soluble dietary fibers, which are mainly fermented by intestinal microbiota (Mellinger et al., 2008). Chemical and mechanical modification of AGs happens in the stomach due to low pH. Acidity in the stomach directly promotes the release of arabinosyl units from the polysaccharides (Zhang, 2003).
The chemical structures and rheological properties of several types of AGs have been reported, including green bean (Bradbury and Halliday, 1990; Fischer et al., 2001; Redgwell et al., 2002; Redgwell et al., 2005), Arabidopsis leaf (Tryfona et al., 2012), Stevia rebaudiana (Oliveira et al., 2013), and Acacia trees (Beltrán et al., 2008; Li et al., 2011; Mahendran et al., 2008; Yadav et al., 2007). Results showed that the variety in the carbohydrate composition and structure of the AGs have a strong influence on the rheological properties of solutions and pastes formed with these AGs. Depending on the AG type and concentration, the rheological properties may exhibit either Newtonian flow behavior (generally at high shear rates) or shear thinning flow behavior (generally at low shear rates) (Li et al., 2009; Mothé and Rao, 1999; Sanchez et al., 2002; Weinbreck et al., 2004).
In this study, three different types of legumes—black gram (BG), great northern bean (GNB), and California small white bean (CSWB)—having different carbohydrate structures and compositions, were selected and chemically characterized. Further objectives of this work were characterization of the rheological properties of their solutions and pastes and finding relationships between these rheological properties and the carbohydrate structures and compositions of the AGs obtained from these legumes.
2. Materials and methods
AGs were extracted from BG, GNB, and CSWB legumes. The procedure used to isolate the AGs was as follows. Seed flour (40 mesh, 200 g) was extracted with 1 L of 10% (w/v) aqueous trichloroacetic acid (TCA, CCl3COOH, Fisher, Fair Lawn, NJ, USA) at 4°C with constant magnetic stirring for 20 h, then centrifuged at 17,700 ×g for 20 min. The supernatant was filtered through filter paper. The residue was re-extracted overnight, followed by centrifugation at 17,700 ×g for another 20 min. The supernatants from two extraction steps were combined and subjected to precipitation with cold 75% (v/v) acetone. After acetone precipitation, the precipitate was collected using vacuum filtration through a filter paper and was washed 5 times with 200 mL of 75% (v/v) cold acetone in water. The precipitate was then re-dissolved in a minimum volume of 10% (w/v) TCA in water and then re-centrifuged at 17,700 ×g for 20 min. The clear supernatant was re-precipitated with cold 75% acetone, and the fibrous precipitate was collected, washed 5 times with 100 mL of cold acetone, and dispersed in distilled water and dialyzed using dialysis tubing with a molecular weight cutoff of 6 kDa (SpectrumLabs, Dominguez, CA, USA) against distilled water. After freeze-drying, the lyophilized powders were stored in air-tight, screw-capped, plastic bottles until further use.
AG solutions were prepared by dispersing the AG powders in distilled water. The solutions were stirred overnight at room temperature to fully hydrate. The concentrations of AGs used for rheological testing were 1%, 2.5%, and 5% (w/v).
Samples were mixed with inositol (3 mg/mL), and 250 μL of 2 N-trifluoroacetic acid was added to the sample with heating to 121°C. The hydrolyzed sample was dissolved in 100 μL of 1 M ammonium hydroxide. Dimethyl sulfoxide (1 mL) was added to the mixture and heated at 40°C. Glacial acetic acid was added to the mixture until the bubbling ceased, followed by addition of 100 μL of 1-methylimidazole and 500 μL of acetic anhydride solution. This mixture was combined with 4 mL of H2O and 1 mL of methylene chloride. The mixture was dried by adding methylene chloride, and the remaining residue was dissolved in acetone. The neutral sugar composition of the AGs was determined by gas chromatography/mass spectrometry (GC/MS: Agilent 6890 GC/5973 Mass Selective Detector, Agilent Technologies, Santa Clara, CA, USA; HP-5 Column: 30 m×0.25 mm×0.25 μm). The oven temperature was 50°C for 2 min and heated to 150°C (2 min) at the rate of 30°C/min, then to 220°C (2 min) at the rate of 3°C/min and finally to 300°C (2 min) at the rate of 30°C/min. The retention tiem of rhamnose, fucose, arabinose, xylose, mannose, galactose, and glucose were 15.7, 16.1, 18.6, 20.6, 22.9, 23.6, and 24.5 min, respectively.
Rheological tests were carried out with a mechanical spectrometer (ARG-2 Model, TA Instruments, Newcastle, DE, USA) using a cone-plate geometry 40 mm in diameter, a cone angle of 1° 59′ 56″, and a 55-μm gap.
AG solutions with concentrations of 1%, 2.5%, and 5% (w/v) were prepared. The flow properties were determined by steady shear tests at 25°C with a shear rate range from 0.1 to 100 s−1. Data were collected in a log mode of 5 points/decade.
To identify time effects in the viscosity of the samples, cycling shear tests with increasing and decreasing shear rates were performed. Time effects on the samples were determined upon a shear rate ramp-up range from 0.1 to 100 s−1, a peak hold of 60 s with a shear rate of 100 s−1, and a shear rate ramp-down from 100 to 0.1 s−1 at 25°C. Hysteresis effects (thixotropy and/or rheopexy) were obtained by subtracting the viscosity values obtained in the ramp-down period from those obtained during the ramp-up period.
For small shear amplitude oscillatory measurements, AG solutions with 1%, 2.5%, and 5% (w/v) concentrations were prepared. Two types of tests were conducted: strain sweep and frequency sweep tests. The strain sweep test was conducted to determine the linear viscoelastic region of the sample. During the test, a frequency of 1 rad/s was selected, whereas the strain was changed in the range of 0.1-20%. Based on the strain sweep test results, a frequency sweep test was performed with 3.0% strain amplitude over a frequency range of 0.1-100 rad/s. Results were expressed in terms of the storage (G′) and loss (G″) moduli, and the phase angle (δ) as a function of frequency. To investigate the effect of pre-shearing, different shear rates (0, 500, and 1,000 s-1) were applied to the AG solutions for 10 min. After the pre-shearing step, both storage and loss moduli were measured as a function of time at a constant frequency of 1 rad/s and a normal stress of 0.01 Pa.
3. Results and discussion
The monosaccharide composition of polysaccharides was determined by GC analysis after hydrolyzing them to convert the sugars into volatile derivatives. The relative percentage of arabinose and galactose in AGs were measured by GC, and G/A was calculated; the results are shown in Table 1. The AG samples were divided into three categories: low, medium, and high G/A ratios, and that of the tested legumes was in the order of BG > GNB > CSWB. AGs vary in their galactose to arabinose ratios (G/A). Since the molecular weight of galactose (C6H12O6) is higher than that of arabinose (C5H10O5), the amount of galactose was considered as an important factor that influences the rheological properties of AG solutions.
| Legume | Sugar composition (%) | G/A2) | ||||||
|---|---|---|---|---|---|---|---|---|
| Ara1) | Gal | Glc | Xyl | Fuc | Rha | Man | ||
| BG3) | 53.8 | 31.8 | 8.6 | 1.4 | ND4) | 4.2 | 0.2 | 0.59 |
| GNB | 50.9 | 18.0 | 9.7 | 14.0 | 5.7 | 1.1 | 0.6 | 0.35 |
| CSWB | 65.5 | 12.9 | 4.1 | 11.7 | 4.3 | 1.5 | ND | 0.20 |
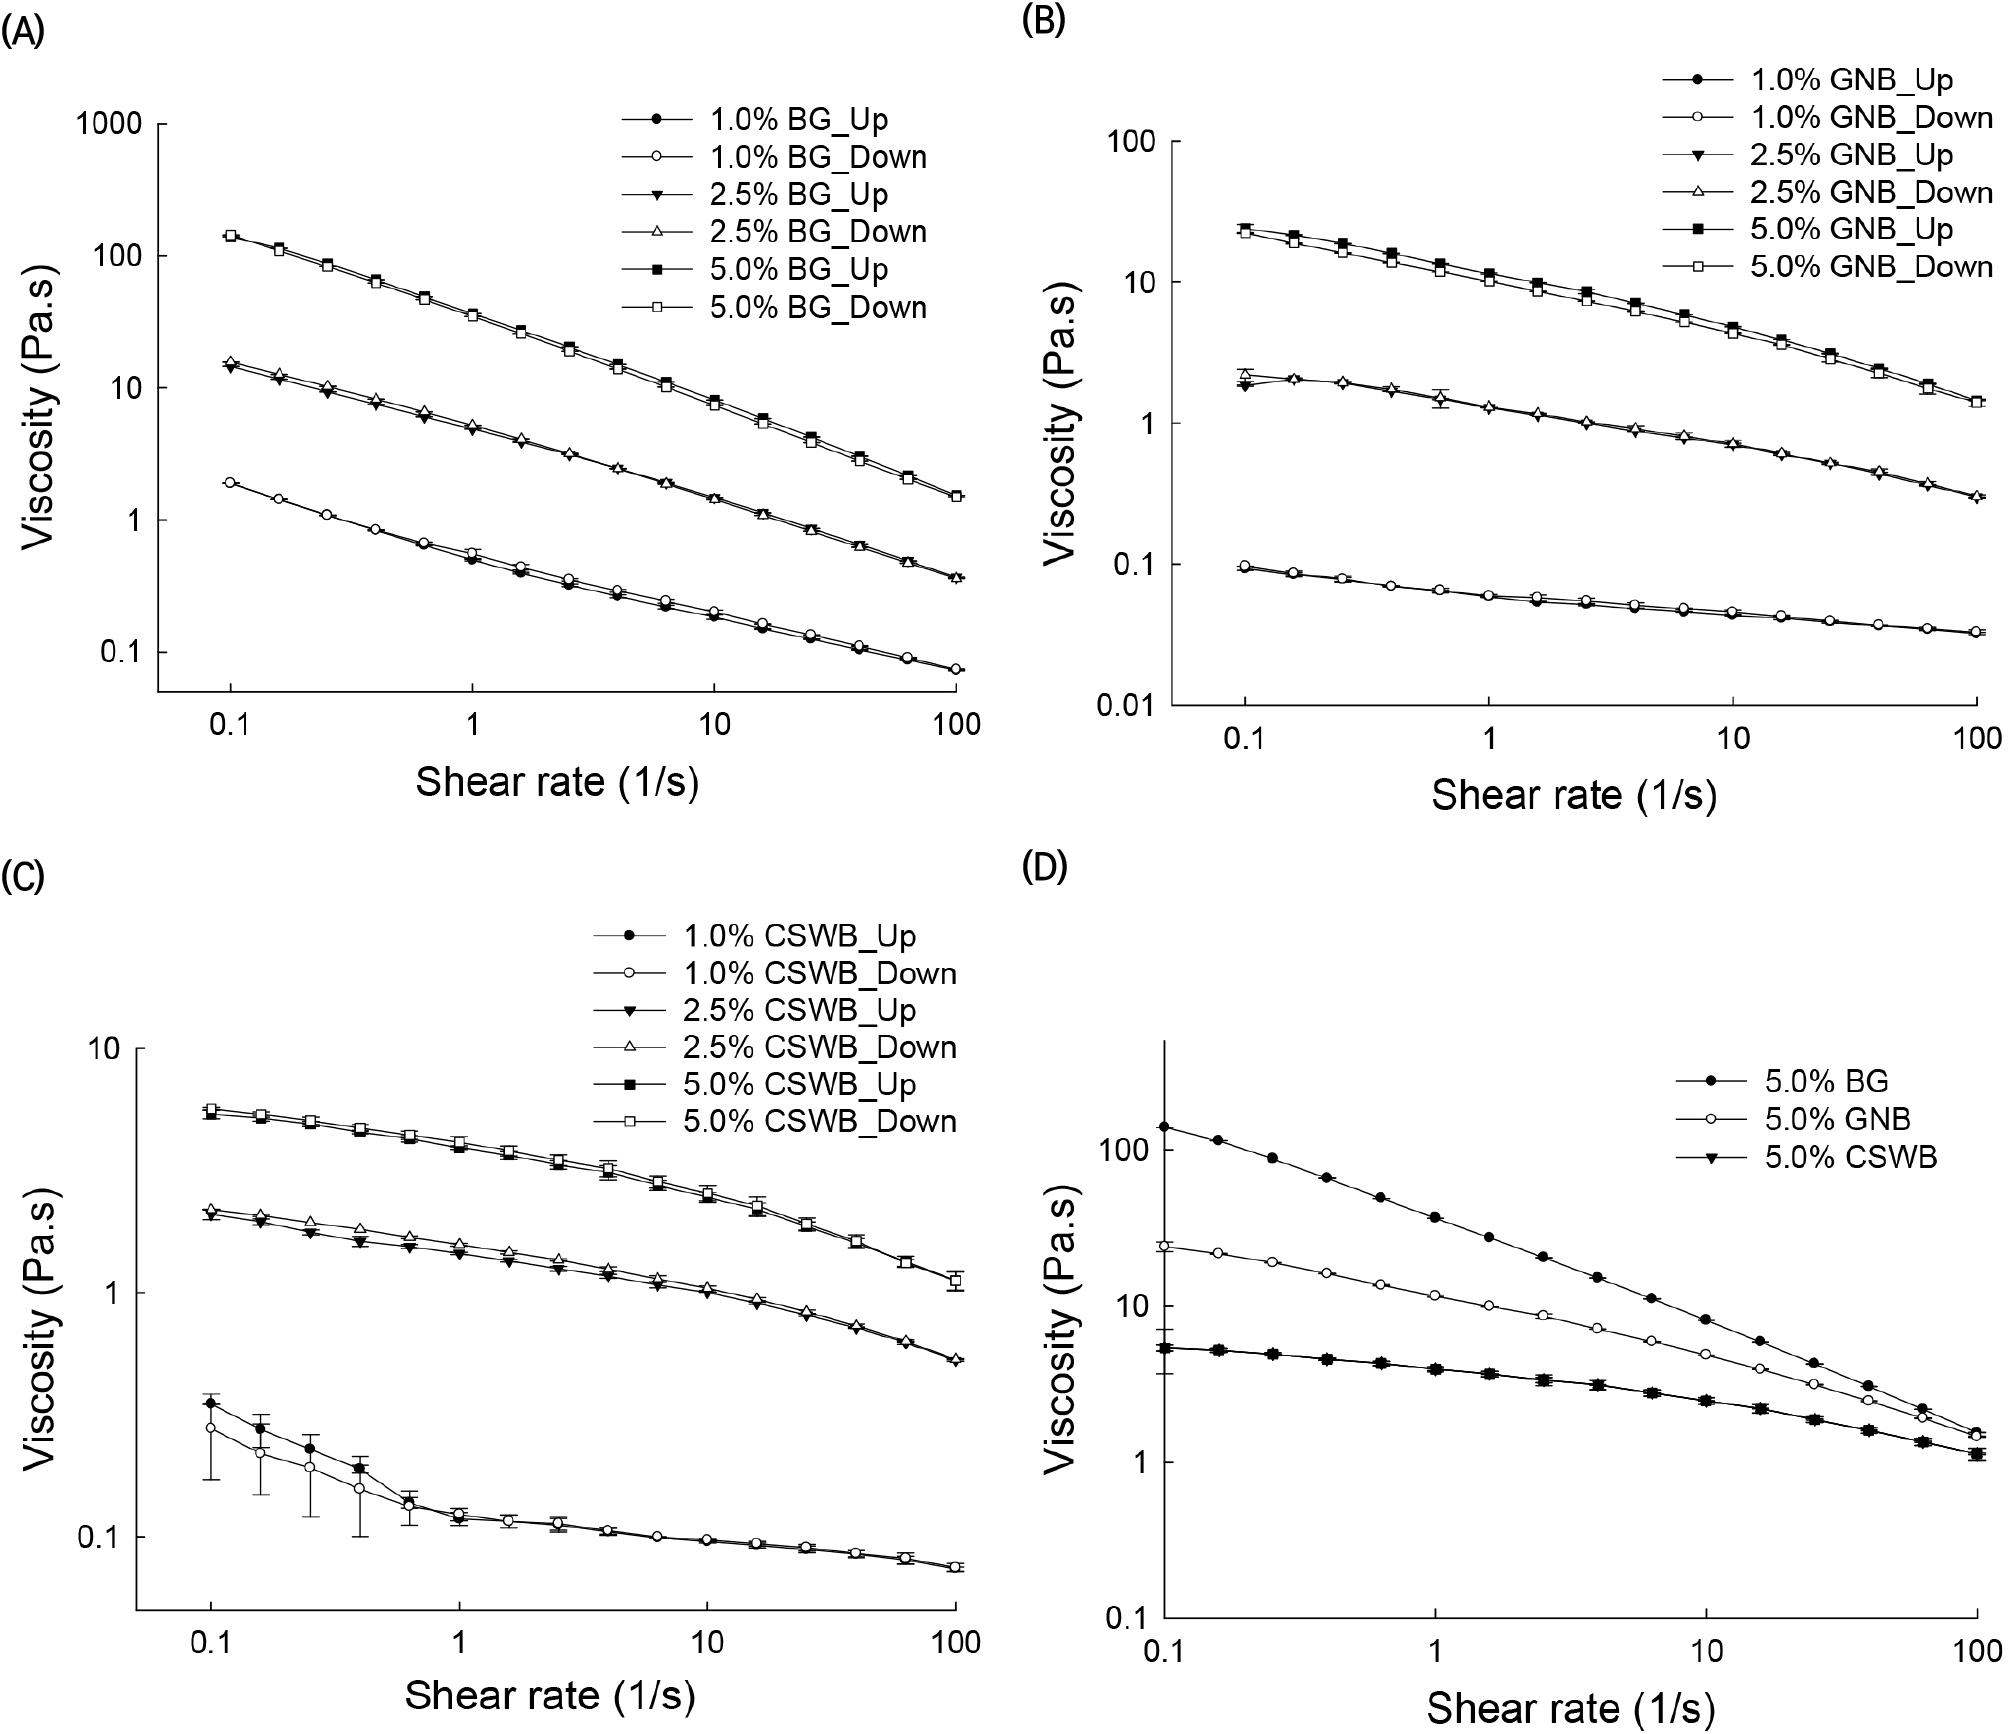
Flow curve cycles with ascending shear rates (up) and descending shear rates (down), presented as viscosity versus shear rate, of the AG solutions obtained from BG, GNB, and CSWB at concentrations of 1%, 2.5%, and 5% (w/v) are illustrated in Fig. 1. The rheological behaviors of all the solutions in terms of viscosity values are clearly different. The viscosity values of 5% AG solutions at a shear rate of 100 s−1 were 143.4, 22.8, and 5.6 Pa.s for BG, GNB, and CSWB, respectively. A comparison between the viscosities of the three AG solutions at the highest solids content is illustrated in Fig. 1(D). Little hysteresis was observed in the results except for CSWB.
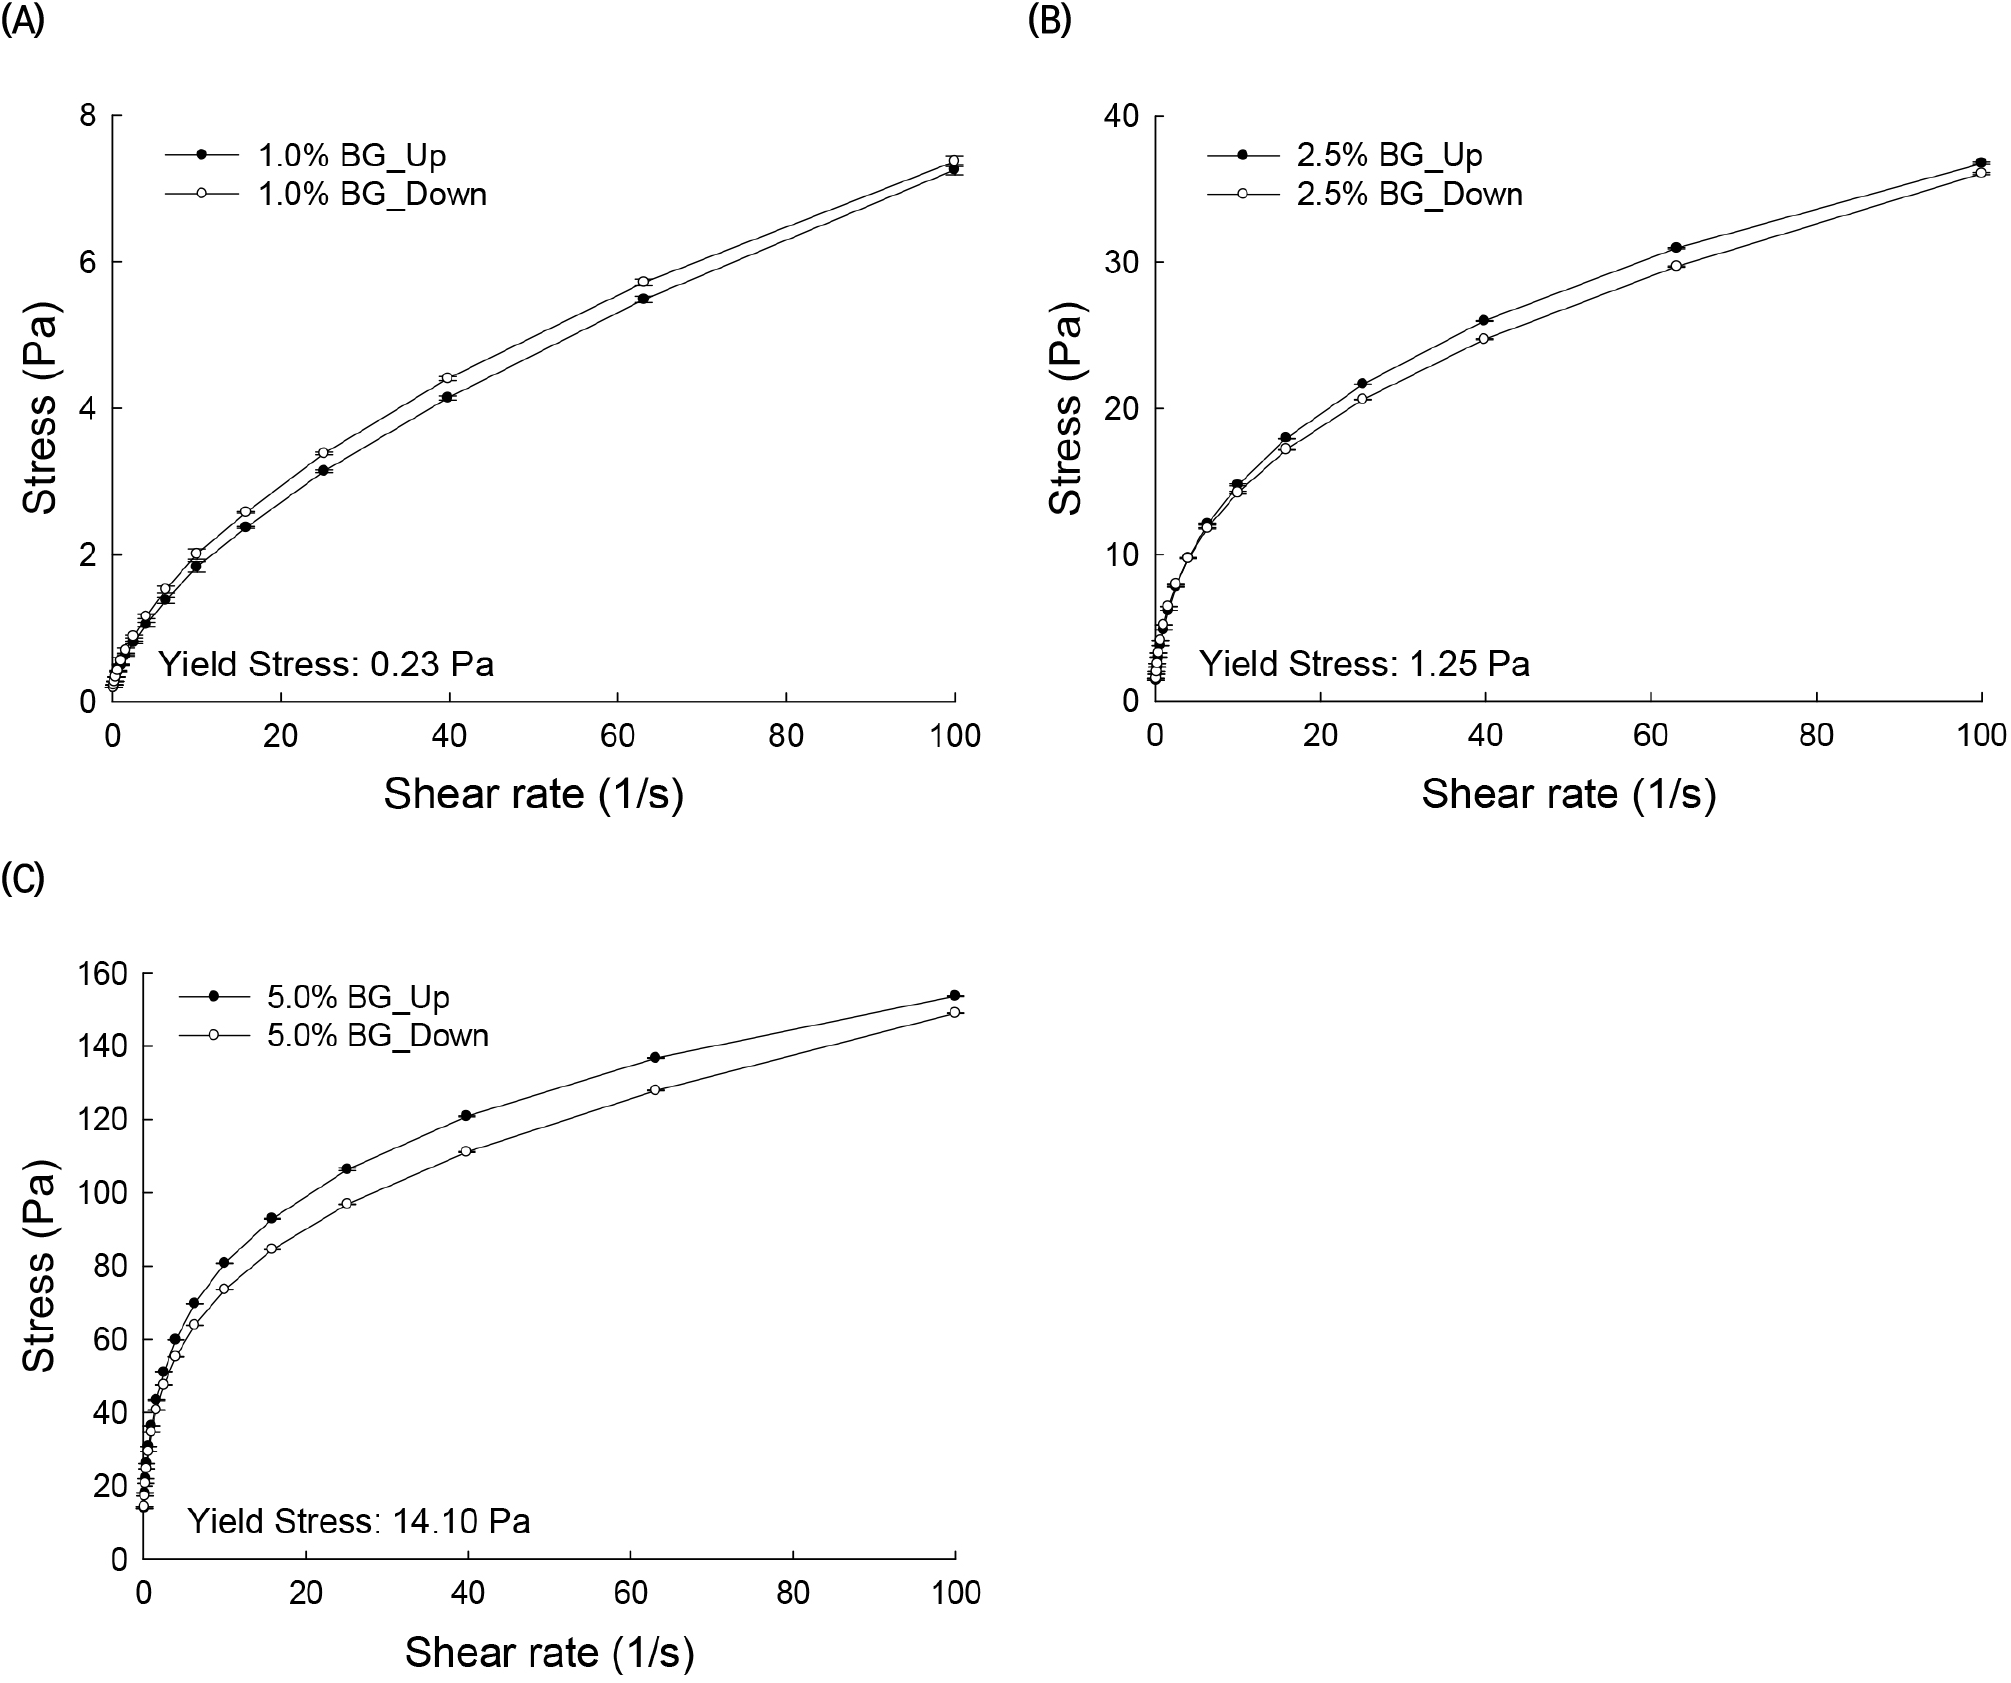
The plot of stress versus shear rate for solutions of AG from BG at three different concentrations is shown in Fig. 2. A yield stress (τ0), which is required to overcome solid behavior, is obtained by extrapolation of the flow curve to zero shear rate. The yield stress values of BG solutions at 1%, 2.5%, and 5% concentrations were 0.23, 1.25, and 14.1 Pa, respectively. Thus, BG exhibited non-Newtonian plastic flow behavior. Hysteresis was observed in the up and down flow curves, especially at the higher concentrations of 5%, and, in this case, the down-shear curves remained lower than the up-shear curves, indicating that the solutions had a thixotropic behavior (Table 2).
It was observed in this study that AG solutions were shear thinning fluids, especially at low shear rates, and slightly shear thinning at high shear rates. However, other studies have shown that AG solutions exhibit only Newtonian behavior. A few studies have shown that gum arabic solutions exhibit Newtonian behavior at a wide range of concentrations and high shear rates, but shear thinning behavior at low shear rates (Li et al., 2009; Mothé and Rao, 1999; Sanchez et al., 2002; Weinbreck et al., 2004). This inconsistency between data in the current work and previous reports could be due to the type of AGs tested and the high concentrations (10-30%) used in those studies.
Time-dependent rheological properties are observed when the solutions are sheared up and down in one or more cycles. Two types of behaviors can be obtained. One such behavior occurs when the viscosity (or shear stress) values in the up-shear curve are higher than the corresponding viscosity values in the shear-down curve. This is known as thixotropic behavior of a fluid. Conversely, when the viscosity (or shear stress) values in the up-shear curve are lower than the corresponding values in the down-shear curve, the behavior is known as rheopectic. The thixotropic and rheopectic properties of AG solutions become evident with the presence of hysteresis effects on shear-up and shear-down cycles. These properties are related to the molecular association of polymers forming the solutions (Barnes, 1997). The rheological properties and the molecular association of AG molecules in these solutions can be examined by their shear rate-dependent structural breakdown and buildup (Li et al., 2011). Hysteresis effects in viscosity and shear stress as a function of shear rate flow curves are observed in Figs. 1 and 2. In particular, hysteresis in the measured viscosity range was calculated by subtracting the viscosity values of the up curve from the corresponding viscosity values of the down curve (Fig. 1). The hysteresis phenomenon was more evident among the 5% AG solutions than at lower concentrations. BG and GNB solutions with high and medium G/A ratios exhibited thixotropic flow behavior. On the other hand, the CSWB solution, with a low G/A ratio, exhibited rheopectic behavior. It should be noted that hysteresis effects were more noticeable at low shear rates.
Oscillatory tests of AG solutions yielded values for the storage modulus, G′, loss modulus, G″, and the phase angle, δ. These three values provide an indication of the mechanical signature of the material and enable its classification into groups such as solid-like, paste, and liquid-like materials (FevziogluHamaker and Campanella, 2012). The lower the phase angle value, the more elastic the material is (KhatkarBell and Schofield, 1995).
In order to viscoelastic property, frequency sweep tests of AGs were performed. BG solutions with a 5% concentration had G′ values significantly higher than G″ values, indicating a solid-like structure or gel-3D network (Fig. 3(A)). Differences between G′ and G″ values decreased when the concentration of the solution decreased. For 1% BG solutions, G′ and G″ were very close, indicating that these solutions behave more like pastes or high viscosity liquids.
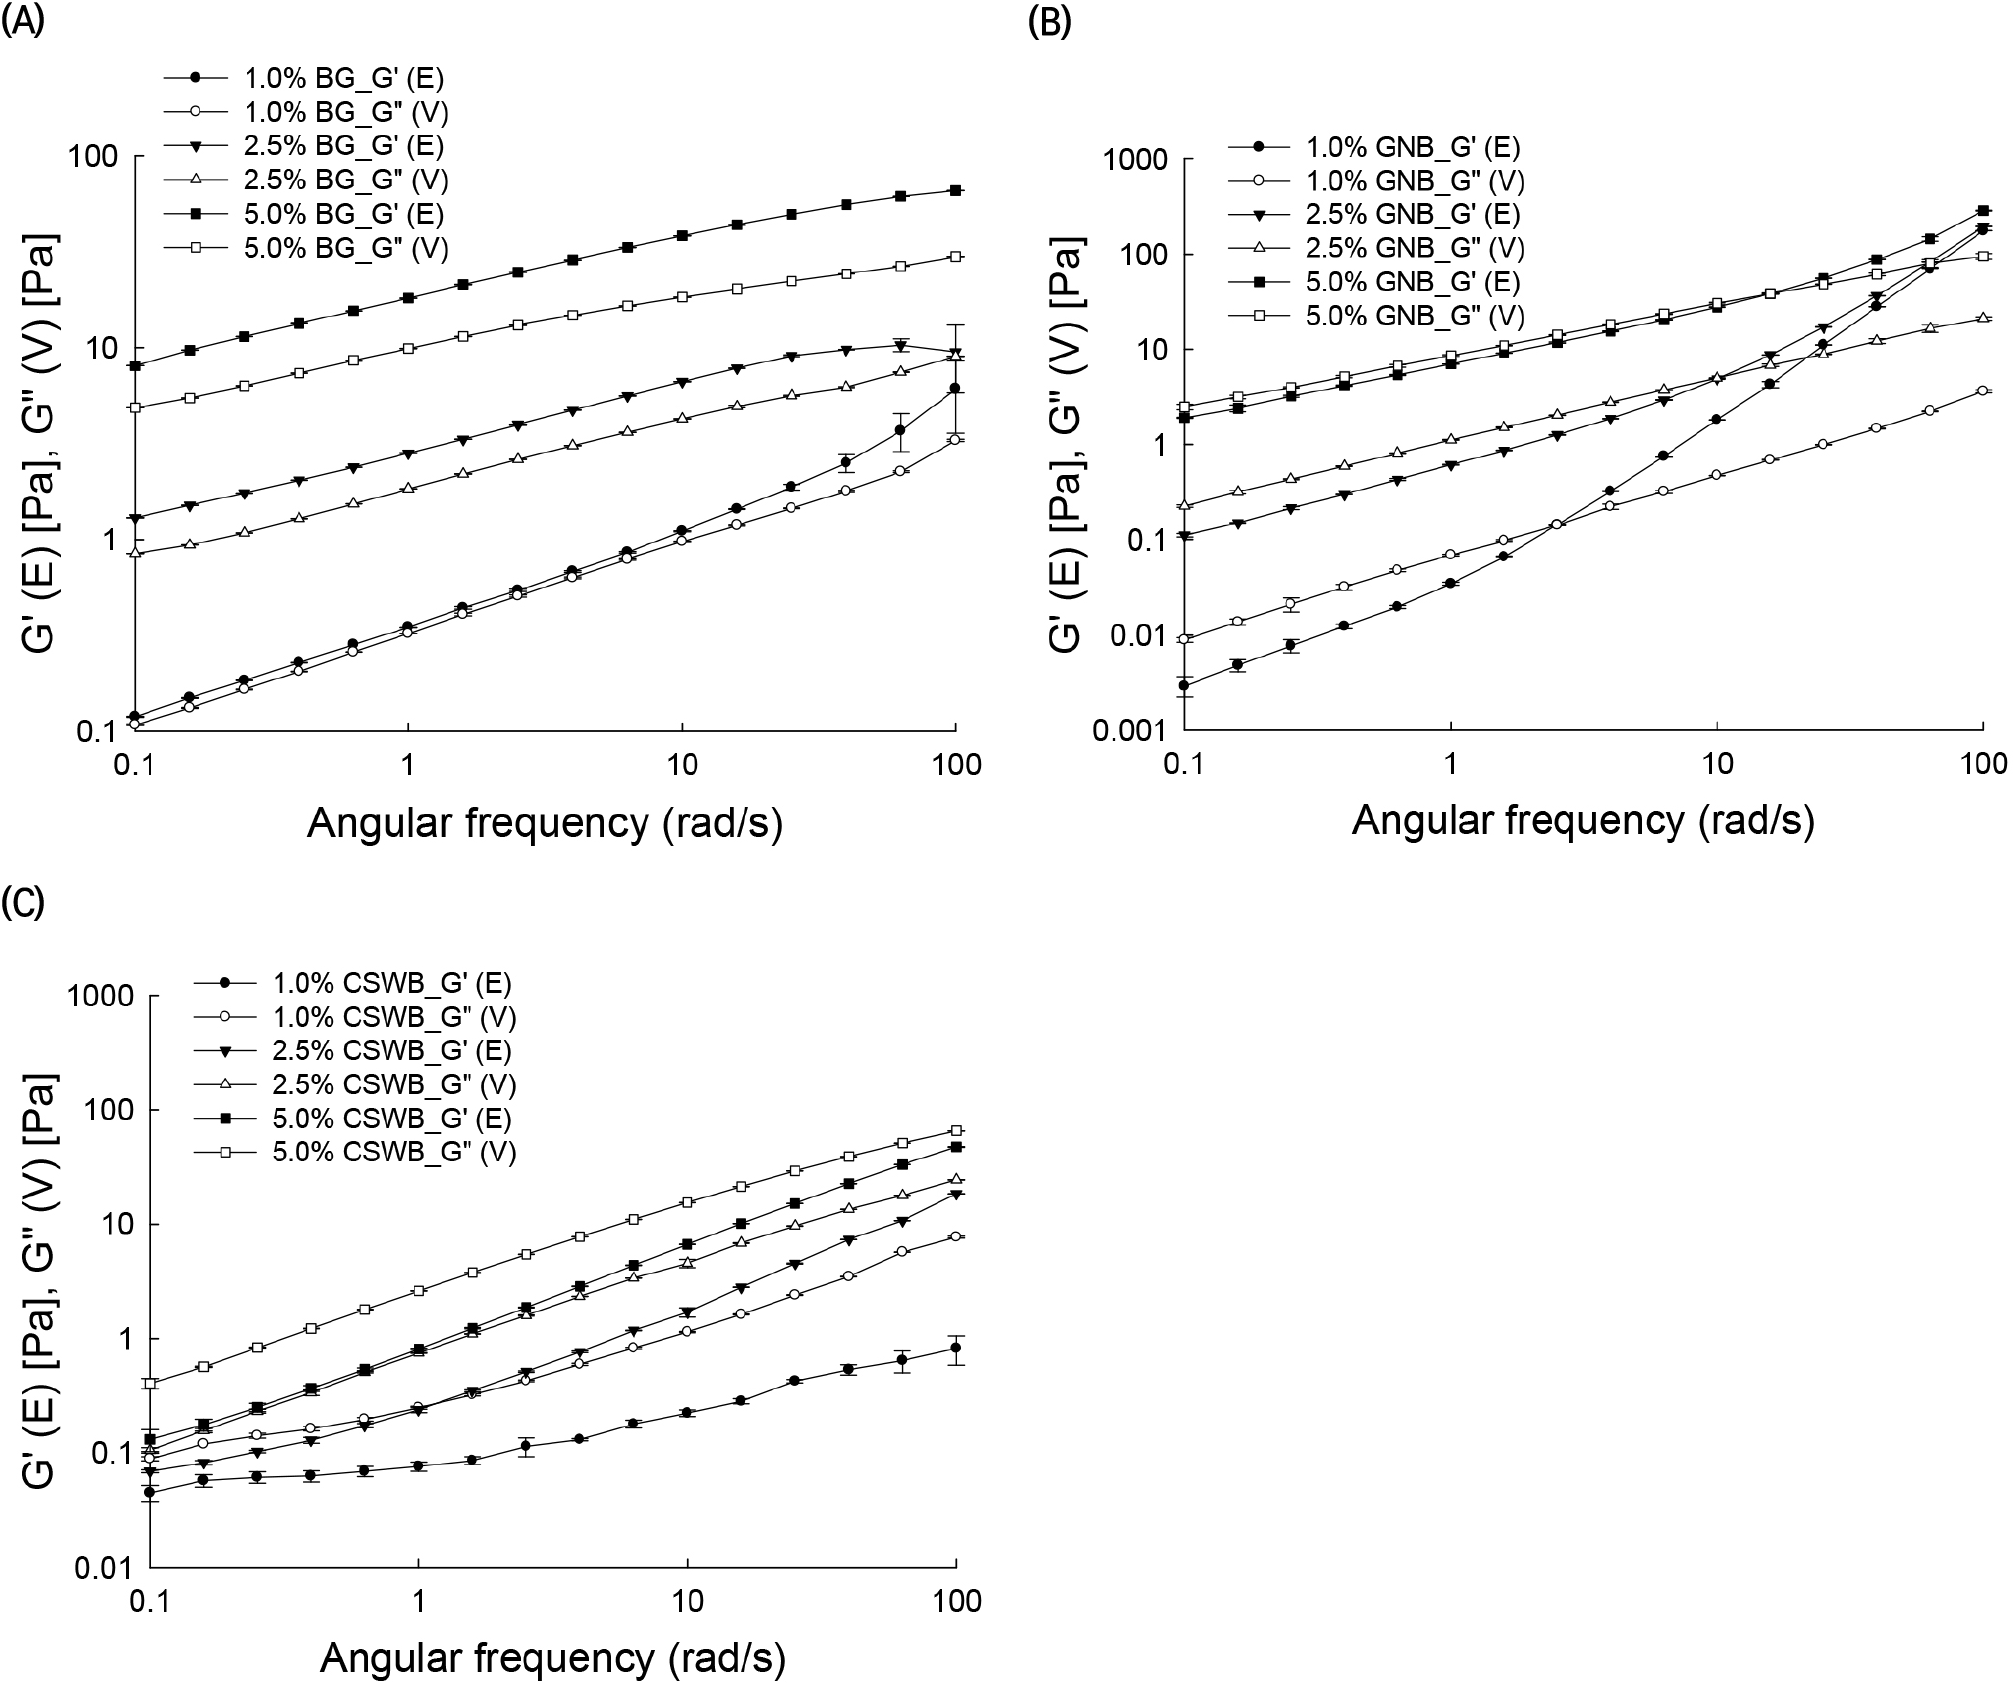
GNB solutions exhibited G″ values close to G′ at the 5% concentration, whereas for low concentrations, G″ values were higher than G′ at low angular frequencies. At higher frequencies, a cross-over was observed, after which the behavior of the solution was more elastic, i.e. G′ values were higher than G″ values. The cross-over observed in the GNB solutions with 1% and 2.5% concentrations could be defined as a critical gelling point of the solution (Yang et al., 2013). Interestingly, the cross-over is affected by the concentration of the solution. Critical gelling points of 1%, 2.5%, and 5% GNB solutions were determined as approximately 2.5, 10, and 15 rad/sec, respectively (Fig. 3(B)). This result is somewhat unexpected, as the opposite relationship between the gelling point of the solution and its concentration would be expected. In other words, more concentrated solutions could reach a gel-like behavior at lower frequencies. For this case, the changes of G′ with frequency would provide a better indication of the nature of the sample. For instance, large changes in the storage and loss moduli with frequency are more indicative of liquid-like viscoelastic materials, which are very noticeable for the 1% GNB solution, followed by the 2.5% and 5% solutions, as illustrated in Fig. 3(B). The CSWB solutions exhibited significantly higher G″ than G′ values at all frequencies, suggesting that CSWB solutions exhibited liquid-like behavior (Fig. 3(C)).
The phase angle is defined as δ=tan-1 (G″/G′), or its tangent as tan δ=G″/G′, and, as discussed previously, provides the viscoelastic behavior of the material. The δ values obtained for the three solutions at the three different concentrations were classified in groups: solutions with tan δ<1, solutions with 1<tan δ<3, and solutions with tan δ>3. Values of tan δ for BG, GNB, and CSWB were tan δ<1, 1<tan δ<3, and tan δ>3, respectively (Table 3). Interestingly, the G/A ratio had a large influence on the measured tan δ values. BG with high G/A exhibited tan δ<1. GNB with a medium G/A showed 1<tan δ<3, and CSWB with a low G/A exhibited tan δ>3. Thus, there was a very clear relationship between the viscoelastic characteristic of the solutions in the concentration range from 1% to 5% and the chemical structures of the AGs forming them.
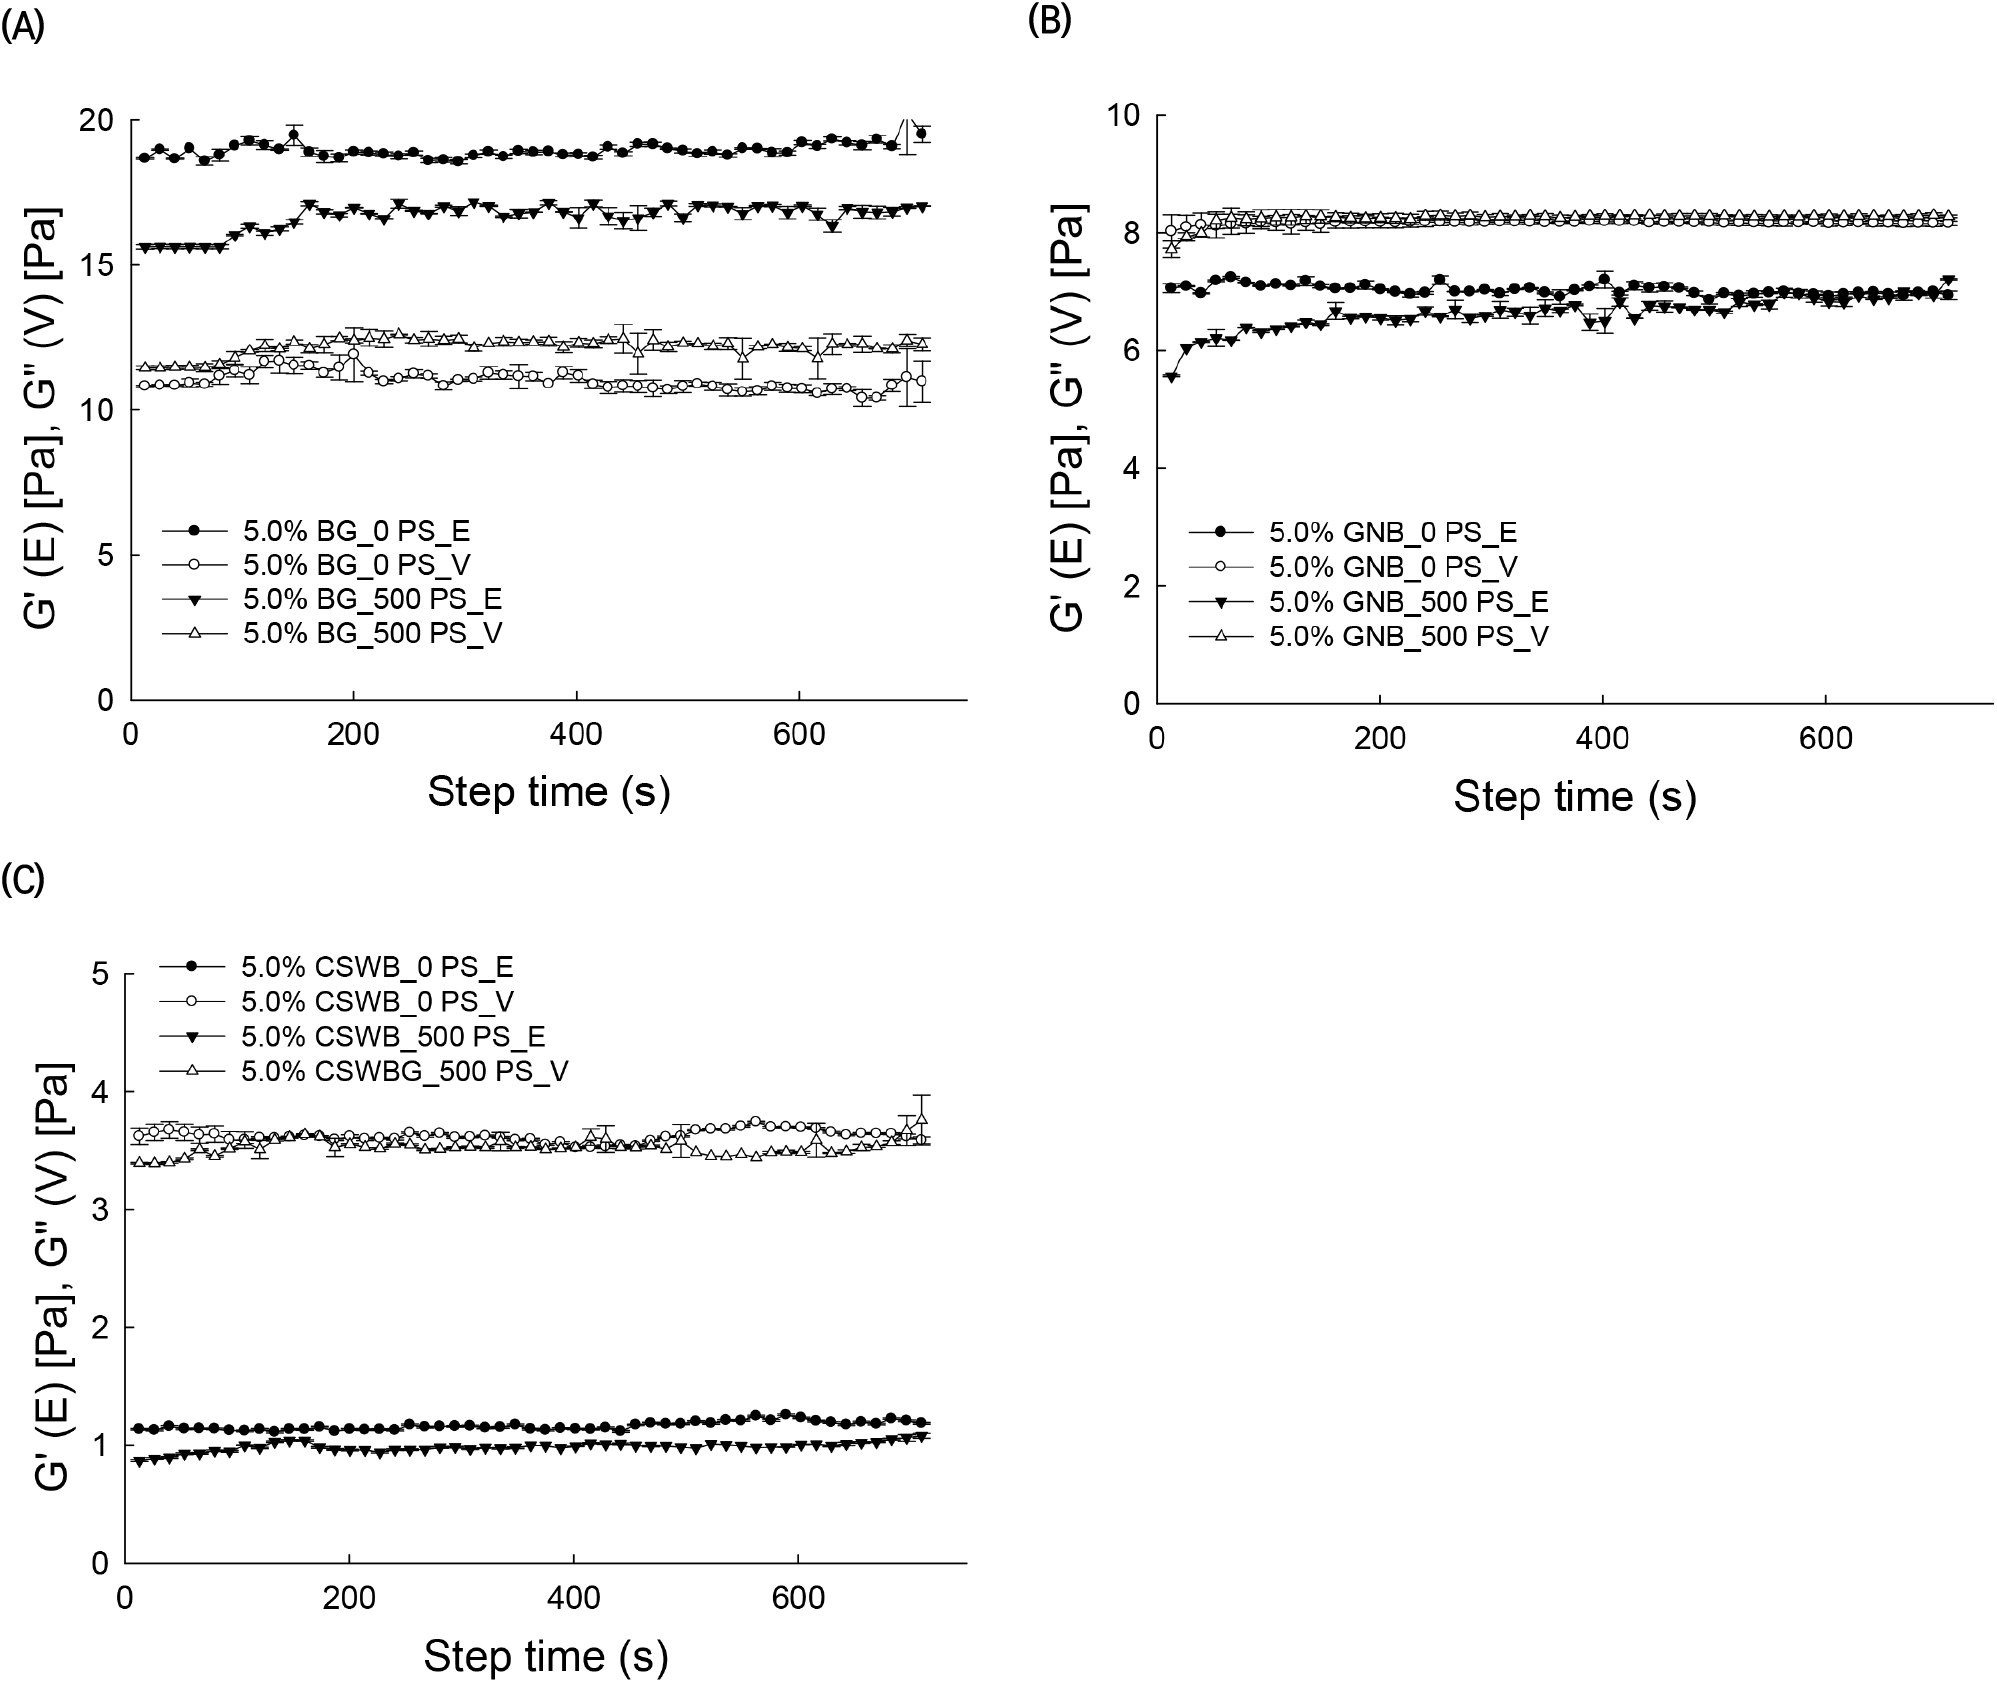
AG solutions were pre-sheared at different shear rates (0, 500, and 1,000 s−1) for 10 min followed by measurement of G″ as a function of time at an angular frequency of 1 rad/s. This time sweep test for 5% solutions of BG, GNB, and CSWB is illustrated in Fig. 4. G″ values of the BG solution drastically increased when the pre-shearing rate increased with respect to the un-sheared solution. Changes of G″ over time increased slightly after the application of the pre-shear treatment. Increasing G″ values upon the application of shearing would indicate a structural building process of the dispersed AG molecules in the solution (Li et al., 2009). Values of G″ did not change significantly when pre-shearing was applied to the GNB and SCWB 5% solutions. Measured phase angle values for BG, GNB, and CSWB were tan δ<1, 1<tan δ<3, and tan δ>3, respectively, after shearing, indicating that the viscoelastic behavior of the samples was altered by the pre-shearing treatment in terms of the degree of elasticity of the samples.
4. Conclusions
Different types of AGs with different chemical structures exhibited a variety of rheological properties. The carbohydrate compositions and structures, along with the rheological properties, of BG, GNB, and CSWB were determined. In this study, the rheological properties of BG, GNB, and CSWB were affected by the G/A ratio of the arabinogalactan molecules. As a result of GC analysis, BG had the highest G/A ratio, followed by GNB and CSWB. The BG solution exhibited plastic flow behavior with yield stress (τ0). The frequency sweep test indicated that the 5% BG solution resembled a gel-3D network, GNB was related to paste property, and CSWB has a liquid-like nature. The effect of different pre-shearing treatments on the structural recovery of the solution was measured as a function of time. The G″(V) values of BG solution increased while the G′(E) values decreased. These results suggest that an intensive pre-shearing treatment with the highest G/A ratio of arabinogalactan is influential in promoting particle-particle interactions and viscosity properties. In conclusion, AGs from different legumes were shown to have different rheological properties, since they are formed by polysaccharides with different compositions and chemical structures.